Ng2-charts: Second chart colors are all grey!!
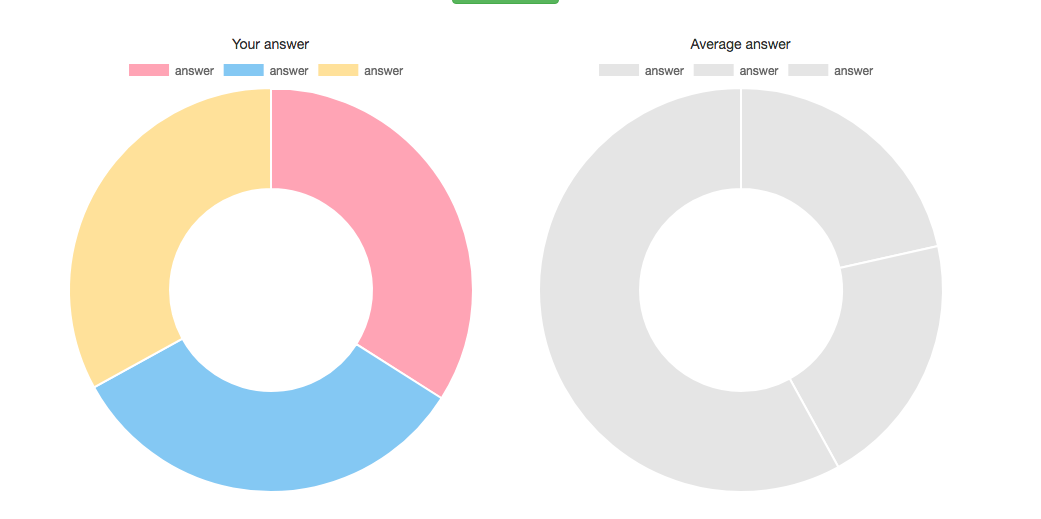
I placed two doughnut chart.
First one has colors but second one's colors are all grey.
please check the screenshot.
here's code for this issue.
<div class="col-xs-12 col-md-6">
        <div class="col-xs-12 text-center"> Your answer </div>
        <canvas baseChart
            [data]="localValues"
            [labels]="names"
            [chartType]="'doughnut'"></canvas>
</div>
<div class="col-xs-12 col-md-6">
        <div class="col-xs-12 text-center"> Average answer </div>
        <canvas baseChart
            [data]="avgValues"
            [labels]="names"
            [chartType]="'doughnut'"></canvas>
</div>
I tried with changing second chart's label variable, but not working.
why is this happening?
 dj-techs
All 3 comments
you have to use color option
HTML
<canvas baseChart
            [data]="avgValues"
            [labels]="names"
            [colors]="doughnutChartColors"
            [chartType]="'doughnut'"></canvas>
in .ts File
public doughnutChartColors: Array<any> = [
        {
            backgroundColor: ['#01dd93', '#4ce7b3', '#99f1d3'],
            borderColor: 'transparent'
        }
    ];
 immohammadjaved
on 13 Nov 2017
immohammadjaved
on 13 Nov 2017
See this stackblitz for an example: https://stackblitz.com/edit/ng2-charts-multiple-charts-aor8tt
 paviad
on 8 Mar 2019
paviad
on 8 Mar 2019
See this stackblitz for an example: https://stackblitz.com/edit/ng2-charts-multiple-charts-aor8tt
Even that example when you press "Update" it only gets grey color, is there an option to put colors automatically?
 tiagoriba
on 7 Oct 2020
tiagoriba
on 7 Oct 2020
Related issues
 sarn3792
·
4Comments
sarn3792
·
4Comments
 tssobe
·
4Comments
tssobe
·
4Comments
 hggeorgiev
·
4Comments
hggeorgiev
·
4Comments
 dslima90
·
3Comments
dslima90
·
3Comments
 shenriksen4
·
3Comments
shenriksen4
·
3Comments
Most helpful comment
you have to use color option
HTML
<canvas baseChart
            [data]="avgValues"
            [labels]="names"
            [colors]="doughnutChartColors"
            [chartType]="'doughnut'"></canvas>
in .ts File
public doughnutChartColors: Array<any> = [
        {
            backgroundColor: ['#01dd93', '#4ce7b3', '#99f1d3'],
            borderColor: 'transparent'
        }
    ];