Hi,
We need daily counts (sum) of success/failures requests in our custom dashboard. We have created custom dashboard and configured our piechart as below
<div data-netdata="springboot_server1.message_counts"
        data-width="200"
        data-method="sum"
        data-chart-library="easypiechart"
        data-dimensions="Success"
        data-title="Success"
        data-after="-86400"
        data-before="0">
</div>
<div data-netdata="springboot_server1.message_counts"
        data-width="100%"
        data-chart-library="dygraph"
        data-title="Message Counts"
        data-height="400"
        data-after="-600">
</div>
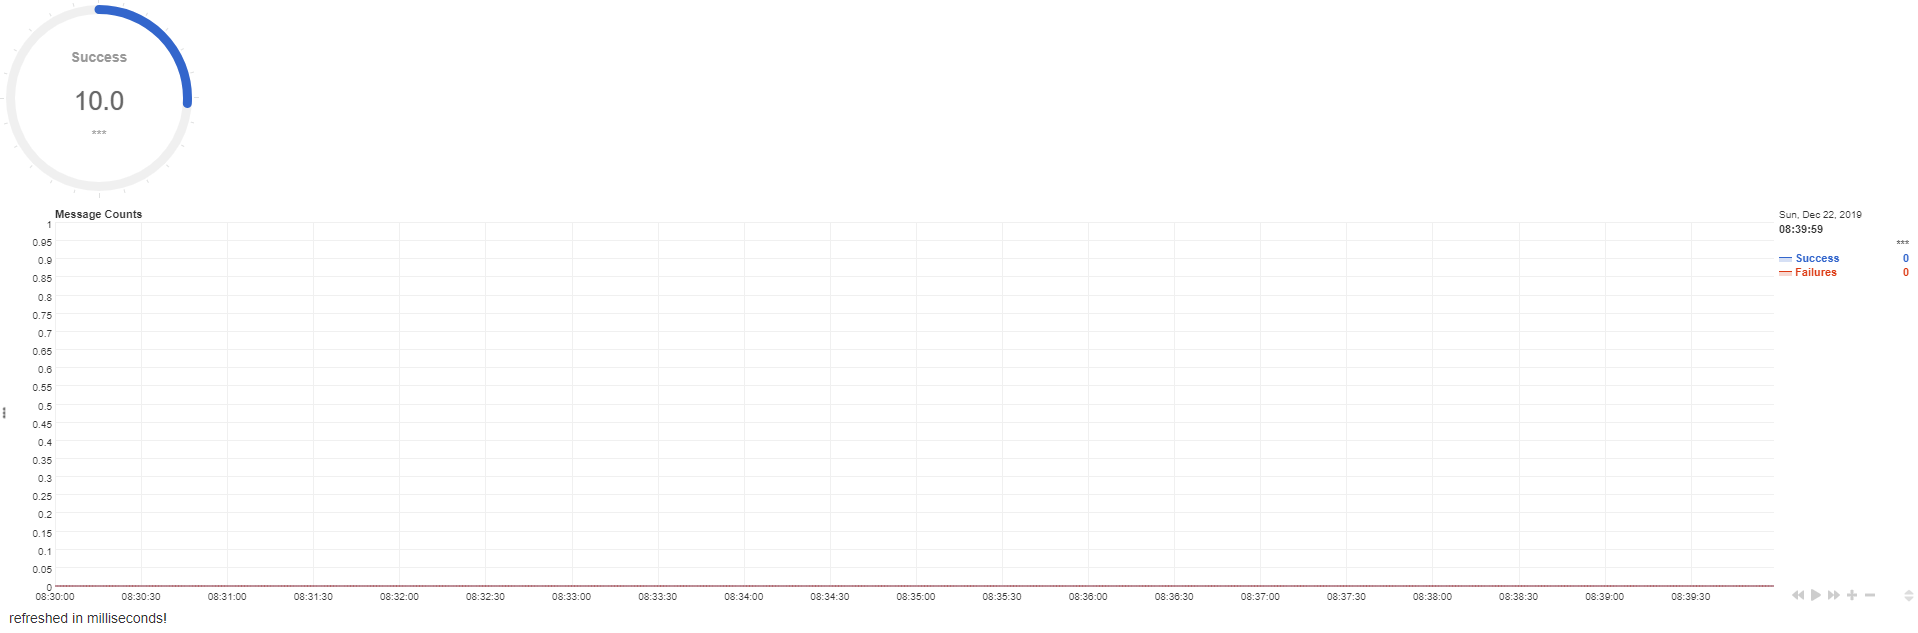
We are expecting that this chart should display the (sum) of counts of "Success" dimension for last 24 hours. But the counts are directly related to the "data-width" i.e. increasing/decreasing this value is actually changing the numbers which are displayed in pie chart.
Here is our springboot.conf
notificaion_center:
  name: 'server1'
  url: 'http://xx.xx.xx.xx:xxxx/actuator/features'
  defaults:
    response_code: false
    threads: false
    gc_time: false
    gc_ope: false
    heap: false
  extras:
   \- id: 'message_counts'
     options: { title: 'Message Counts', units: '\*\*\*', family: '\*\*\*', context: 'nc.\*\*\*', charttype: 'line' }
     lines:
     \- { dimension: 'nc_successCounter',name: 'Success'}
     \- { dimension: 'nc_failCounter',name: 'Failures'}
   \- id: 'payments'
     options: { title: 'Payments', units: '\*\*\*', family: '\*\*\*', context: 'nc.\*\*\*', charttype: 'line' }
     lines:
     \- { dimension: 'nc_amount',name: 'Amount', divisor: 1000}
And this is what our rest end point returns
{"nc.failCounter":"0","nc.successCounter":"0"}
Is it possible with netdata what we are trying to achieve? If yes what point we are missing here?
 azeemdin
>All comments
We have figured it out using "unaligned" options. Now this chart gives us count for last 24 hours.
data-append-options="unaligned"
<div data-netdata="springboot_NotificationService.NotificationCounts"
        data-width="20%"
        data-gtime="86400"
        data-method="sum"
        data-dimensions="NcRequestReceived"
        data-chart-library="easypiechart"
        data-title="Received"
        data-height="400"
        data-before="0"
        data-append-options="unaligned"
        data-after="-86400"></div>
azeemdin
on 23 Dec 2019
Related issues
 jordanhubbard
·
3Comments
jordanhubbard
·
3Comments
 Ryuzavi
·
3Comments
Ryuzavi
·
3Comments
 ktsaou
·
3Comments
ktsaou
·
3Comments
 dugajean
·
3Comments
dugajean
·
3Comments
 gino
·
3Comments
gino
·
3Comments
Most helpful comment
We have figured it out using "unaligned" options. Now this chart gives us count for last 24 hours.
data-append-options="unaligned"<div data-netdata="springboot_NotificationService.NotificationCounts" data-width="20%" data-gtime="86400" data-method="sum" data-dimensions="NcRequestReceived" data-chart-library="easypiechart" data-title="Received" data-height="400" data-before="0" data-append-options="unaligned" data-after="-86400"></div>