key bugs fixed
streaming slaves consuming 100% CPU
A bug has been fixed, at the streaming functionality. netdata was not handling all the error cases properly, resulting in 100% cpu utilization of a single core, at the slaves, under certain conditions. Especially under FreeBSD and macOS slaves, these conditions were always met, so using FreeBSD or macOS as netdata slaves, was completely broken.
Also, there have been many more improvements at the streaming functionality.
missing alarm notifications on netdata masters
A bug has been fixed, affecting alarm notifications at netdata masters. netdata was incorrectly messing cached alarm state data between the alarms of the mirrored hosts, resulting in alarm notifications not dispatched under certain conditions. This was affecting only netdata masters (ie. netdata servers with more than one host databases, with health monitoring enabled). The alarms were generated and were visible at the dashboards, but the notifications were not always sent.
It is now fixed.
netdata API generating corrupted JSON
Another bug has been fixed, at the netdata API. netdata was assuming that the JSON representation of a chart would at most be 1024 bytes, and it was generating corrupted JSON output when any chart was exceeding that limit.
Removed the limitation (ie. now there is no limit).
netdata crashing when starting on systems without writable disks
There was an issue that caused netdata to crash while starting, if no usable disks were found.
Fixed.
python.d.plugin URLService did not support HTTP keep-alive
netdata now uses urllib3 (shipped with netdata for both python v2 and v3) for URLService based plugins.
This enables HTTP keep-alive on all connections, which allows netdata to have permanent connections to third party web applications.
Fixed by @l2isbad
This can be considered an enhancement, but given that netdata collects metrics per second, the lack of HTTP keep-alive was forcing netdata to reconnect on every iteration, which (to my view), is a bug.
streamed charts with duplicate names
There was an issue with charts that were created with name aliases. When these charts were streamed from netdata slaves to netdata masters, they ended up with duplicate chart names (ie instead of type.name they had type.type.name). Fixed it.
compatibility enhancements
- better support for Oracle Linux, by @schindlerd
- better support for Alpine Linux
- various fixes at the build procedure for macOS
fpingcan now run as non-root, in static binary netdata packages
netdata generic enhancements
netdata can now listen on UNIX domain sockets (
.sockfiles). This allows a local web server and netdata to communicate bypassing the network stack (for netdata setbind to = unix:/path/to/netdata.sock- this option supports multiple arguments, so netdata can listen to multiple unix sockets and tcp sockets, at the same time).minor fixes at the installer, by @vincele
systemd
netdata.servicenow allows setting negative netdata OOM score and restarts netdata if it crashes. The newnetdata.serviceis not automatically installed when updating netdata. Either delete/etc/systemd/system/netdata.serviceand then update/re-install netdata, or copy the file by hand.
new plugins
- Added Intel CPU temperature charts on FreeBSD and macOS, by @vlvkobal
- Added CPU thermal throttling charts on Linux (useful on physical servers and possibly laptops)
- Added
chronyplugin, by @domschl - Added Stiebel Eltron plugin to collect metrics from heat pumps and hot water installations from Stiebel Eltron ISG.
improved plugins
web_logbugfixes, enhancements and optimizations (includingsquidlogs), by @l2isbadweb_lognow enables parsing HTTP/2 logs incustom_log_format, by @Funzinatorredisbugfixes, by @l2isbadhaproxybugfixes, by @l2isbadelasticsearchbugfixes and optimizations, by @l2isbadrabbitmqbugfixes and optimizations, by @l2isbadmdstatbugfixes, by @JeffHensontomcatimprovements, by @Wing924mysqlimprovements, by @alibo and @l2isbaddovecotimprovementspostgresimprovements, by @facetoecpufreqfixed a bug that preventedaccuratereporting of CPU frequencies.accurateworks with theacpi-cpufreqdriver and calculates the average CPU clock of the CPUs utilizing the accounting per frequency, as reported by the kernel, by @tychocpuidleperformance improvements (faster under load) by @tychofail2banbugfixes, by @l2isbadSNMPplugin new uses latestnet-snmpand the corrupted 64 bit counters encountered under certain node.js version is now fixed.
dashboard improvements
easypiechartsandgaugescan now render arbitrary ranges and animate clock wise or counter clock wise.container network interfaces are now moved to the container section and they are rendered from the container view point (i.e.
sent= what the container sent) - no moreveth*garbage on the dashboard.The interfaces also appear as
eth0(or whatever the container sees) and they are inside the container section of the dashboard. netdata maps eachveth*interface to the right container, using plaincgroupsfeatures, so this works for all container managers (docker, lxc, etc).containers and VMs now have summary gauges on the dashboard

traditionally netdata was using 1024 bits = 1 kilobit. It is fixed: 1000 bits = 1 kilobit.
netdata charts should now work on wordpress pages.
alarms and notifications
alarm-notify.shnow supports debug mode, showing the exact commands it runs to send notifications, whenexport NETDATA_ALARM_NOTIFY_DEBUG=1alarm-notify.shnow supports setting the sender email address of the emails it sends.emails sent by
alarm-notify.shnow include headers to reduce the possibility of them being scored as spam, by @Ferroinnetwork related alarms got new thresholds and improved badges
netdata now detects if the system has been suspended and pauses all alarms for 60 seconds on resume, to prevent false alarms (no more false alarms on laptops when they resume).
netdata alarms now support filtering based on hostname and O/S (linux, freebsd, macos). This means that netdata masters, can now support alarms for slaves of any O/S (i.e. a Linux netdata master can handle alarms for a FreeBSD slave).
netdata slack notifications now show the host sent the alarm. In the image below, the alarm is about
bangalore, and is sent bynetdata-build-server(at the lower left corner):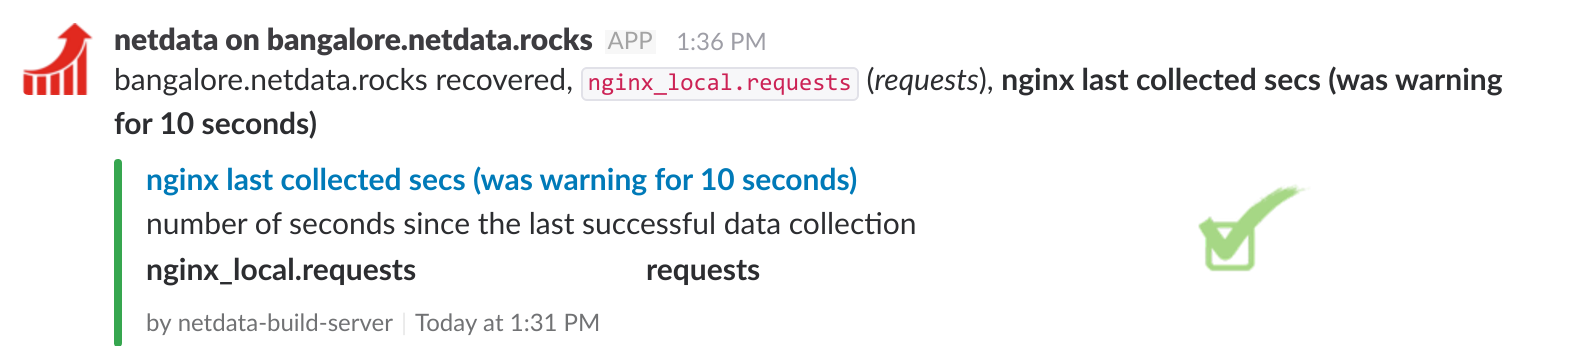
statsd
- the number of fractional points supported by statsd is now configurable (1 to 7).
- 95th percentile calculation on statsd histograms and timers, was incorrectly averaging the values. It is now fixed.
- statsd metrics with non ASCII text were processed by the statsd server, but were breaking JSON data generated by netdata. Fixed it by replacing all invalid characters.
 ktsaou
All 3 comments
I have promised that v1.8 will bring central health monitoring, but given that there is no progress in that area yet, and we have fixed major bugs in netdata, I think we should release v1.8 asap and plan all new features for v1.9.
ktsaou
on 10 Sep 2017
As a mostly unrelated sidenote- I really must applaud the changes to the prometheus scraping api @ktsaou . It was a small pain to update everything in my grafana, but being able to add entire families with one line vs 8+ is sooooo much better. Kudos to everyone involved with that process!
 GitStoph
on 14 Sep 2017
GitStoph
on 14 Sep 2017
released v1.8.0
thanks!
ktsaou
on 17 Sep 2017
Related issues
 jordanhubbard
·
3Comments
jordanhubbard
·
3Comments
 dankott
·
3Comments
dankott
·
3Comments
 genrihx2
·
3Comments
genrihx2
·
3Comments
 eXcalibre
·
3Comments
eXcalibre
·
3Comments
 ibnesayeed
·
3Comments
ibnesayeed
·
3Comments
Most helpful comment
I have promised that v1.8 will bring central health monitoring, but given that there is no progress in that area yet, and we have fixed major bugs in netdata, I think we should release v1.8 asap and plan all new features for v1.9.