Napari: Investigate and fix performance issues when drawing multiple layers
@Czaki showed some profiling results on Zulip when adding "many" napari layers, specifically 100 images. It seems a lot of time is spent on computing the world extent:
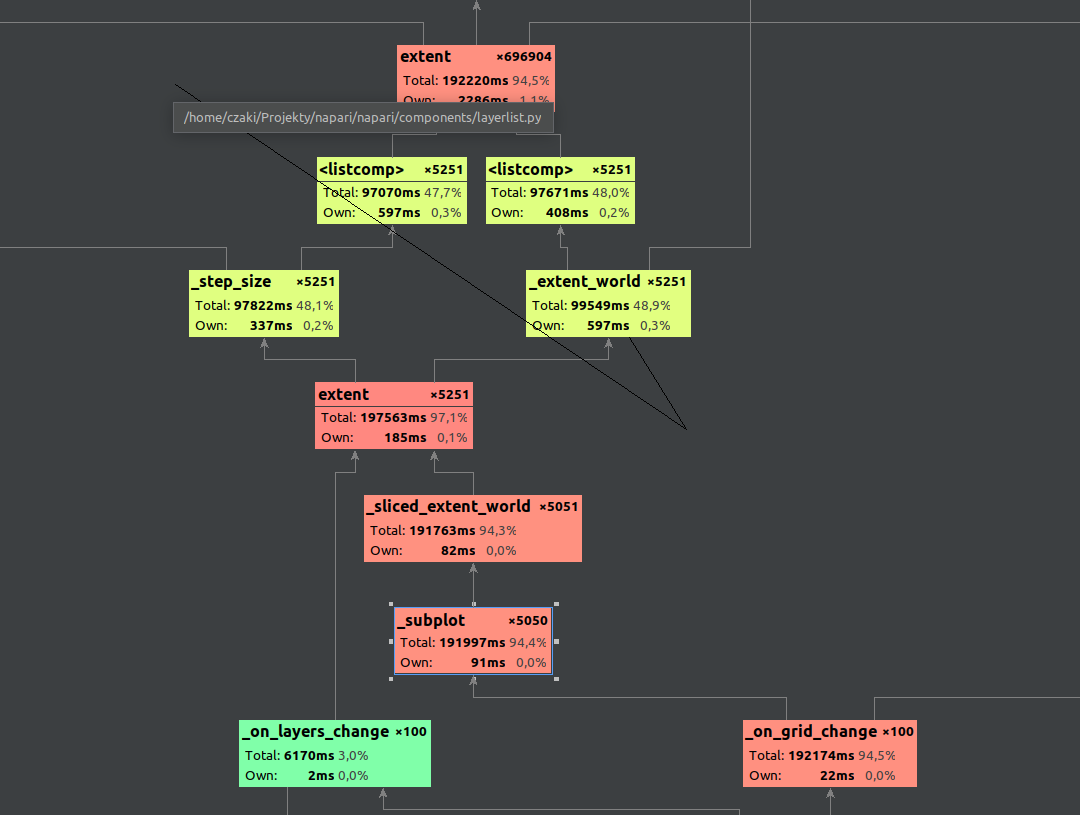
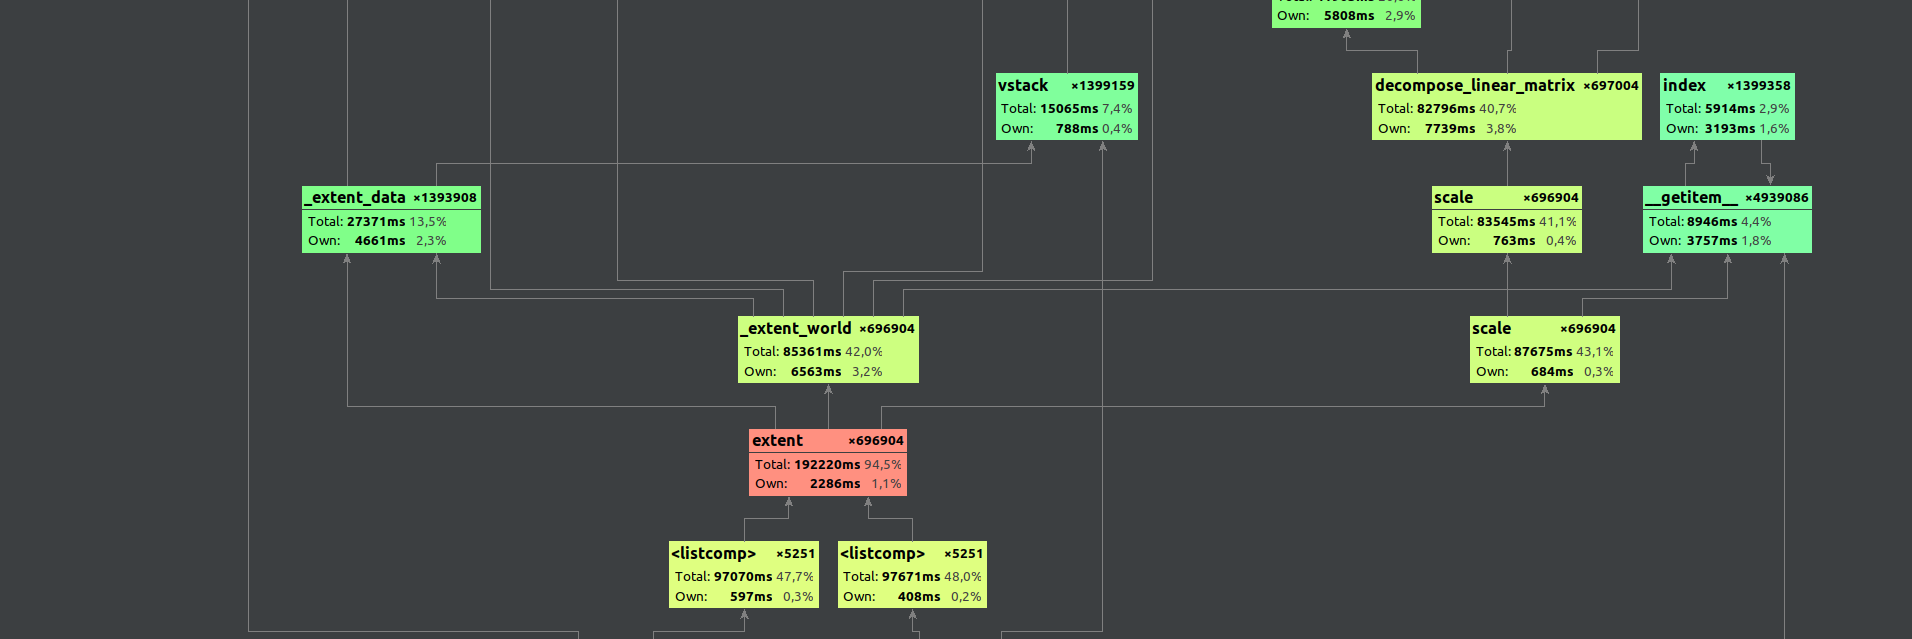
so that's a good low-hanging fruit.
We do have benchmarks, so adding a benchmark for adding "many" small images would be useful, too.
 jni
jni
All 3 comments
Many thanks to @Czaki for the investigation! 🙏
jni
on 17 Nov 2020
A short tutorial for reproducing without using PyCharm Professional.
May be need to patch running_as_bundled_app
def running_as_bundled_app() -> bool:
    """Infer whether we are running as a briefcase bundle"""
    # https://github.com/beeware/briefcase/issues/412
    # https://github.com/beeware/briefcase/pull/425
    try:
        app_module = sys.modules['__main__'].__package__
        metadata = importlib_metadata.metadata(app_module)
        return 'Briefcase-Version' in metadata
    except Exception:
        return False
Profiled code in sample_code.py
import napari
import napari.plugins.io
import sys

with napari.gui_qt():
    viewer = napari.Viewer()
    for iteration in range(0,100):
        print(iteration)
        viewer.add_image(
            napari.plugins.io.read_data_with_plugins("image.png")[0],
        )
    viewer.close()
    sys.exit()
Install graphviz program
Install gpof2dot package in the python environment . Then call
$ python -m cProfile -o napari.pstat sample_code.py
...
$ python -m gprof2dot -f pstats napari.pstat | dot -Tpng -o output.png
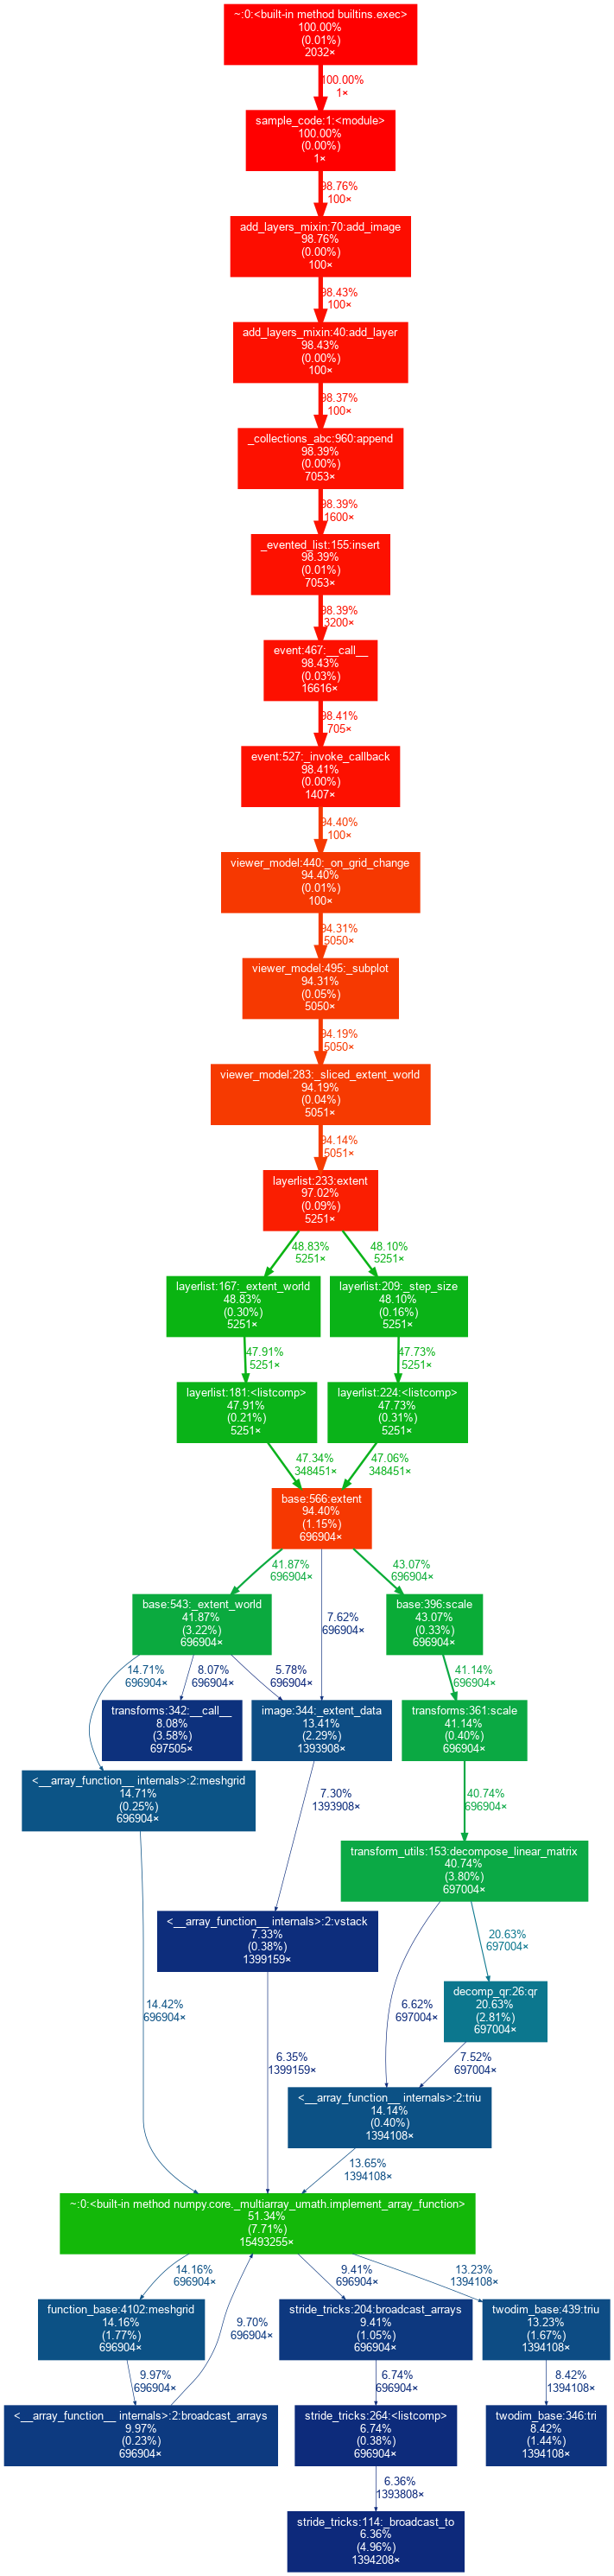
Here sample output (with removed nodes which total time bellow 6% because of github limitations)
 Czaki
on 17 Nov 2020
Czaki
on 17 Nov 2020
Just noting that this has been dramatically improved with the merge of #1945, but we still have #1949 and #1950 in progress that could cause further improvements.
 sofroniewn
on 28 Nov 2020
sofroniewn
on 28 Nov 2020
Related issues
 JoOkuma
·
3Comments
JoOkuma
·
3Comments
 royerloic
·
3Comments
royerloic
·
3Comments
 VolkerH
·
3Comments
VolkerH
·
3Comments
 kevinyamauchi
·
4Comments
sofroniewn
·
3Comments
kevinyamauchi
·
4Comments
sofroniewn
·
3Comments
Most helpful comment
A short tutorial for reproducing without using PyCharm Professional.
May be need to patch
running_as_bundled_appProfiled code in
sample_code.pyInstall graphviz program
Install
gpof2dotpackage in the python environment . Then callHere sample output (with removed nodes which total time bellow 6% because of github limitations)