Msbuild: For large projects with globs, MSBuild takes up to 30% - 50% of a build searching the disk
I'm been analyzing two projects to try and understand the reasoning behind long design-time builds. Some projects design-time builds are taking upwards of 3 seconds to run - when the expectation is that don't take more than 50 - 100 ms. This results in very observable lag times from when you make a change (such as adding a reference) and it seen by the compiler, or time before you get useful intellisense the first time you open a solution. It also makes evaluation inside the VS process itself slow, resulting in observable UI delays if we put this on the UI thread, or the UI thread is blocked on evaluation in another thread.
Looking at these builds under PerfView, I can see that half the build is dedicated to evaluating the project, of which the majority is caused by MSBuild searching the disk:
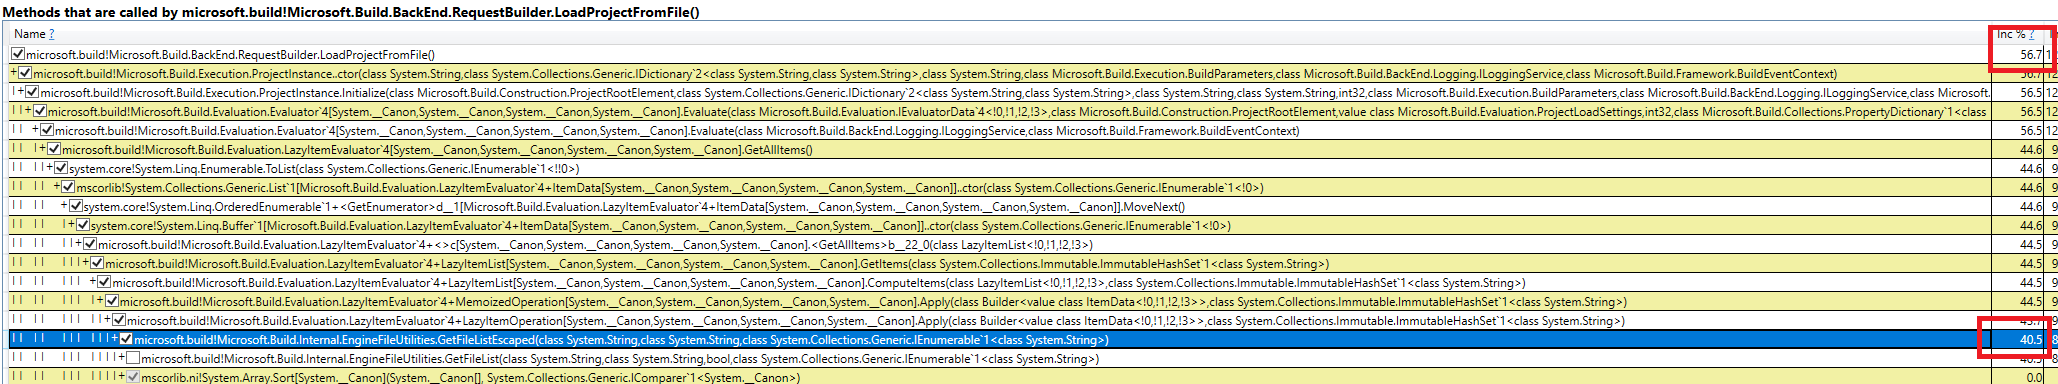
The second project was taking 3 seconds for a design-time build, it's build evaluation time looked like this:
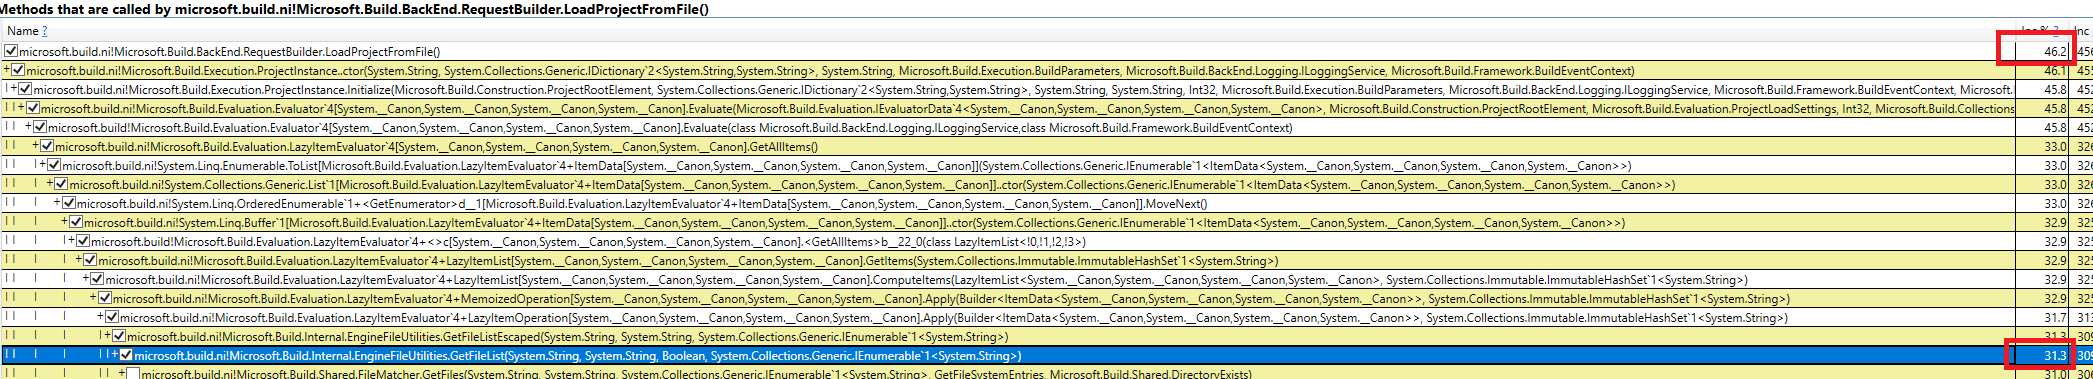
There were two main projects that I was looking, the first http://github.com/dotnet/roslyn, was taking up to 1 second for a design-time build, it's build evaluation time looked like this:
The first project, Roslyn, does nothing but import the default globs from the SDK.
The second project, is a lot more complex, and includes the following syntax:
       <ItemGroup>
              <None Include="**\*.iPhone.cs" />
              <None Include="**\*.Google.cs" />
              <None Include="**\*.Microsoft.cs" />
              <None Include="**\*.WinRT.cs" />
              <None Include="**\*.Xamarin.cs" />
       </ItemGroup>

       <ItemGroup>
              <Compile Remove="**\*.iPhone.cs" />
              <Compile Include="**\*.iPhone.cs" Condition="'$(TargetDevice)' == 'iPhone'" />

              <Compile Remove="**\*.Google.cs" />
              <Compile Include="**\*.Google.cs" Condition="$(TargetDevice)' == 'Google'" />

              <Compile Remove="**\*.Xamarin.cs" />
              <Compile Include="**\*.Xamarin.cs" Condition="'$(TargetDevice)' == 'Google' or '$(TargetDevice)' == 'iPhone'" />

              <Compile Remove="**\*.Microsoft.cs" />
              <Compile Include="**\*.Microsoft.cs" Condition="$(TargetDevice)' == 'Microsoft'" />

              <Compile Remove="**\*.WinRT.cs" />
              <Compile Include="**\*.WinRT.cs" Condition="$(TargetDevice)' == 'WinRT'" />
       </ItemGroup>
 davkean
All 28 comments
Possibly related: #2000
 dsplaisted
on 4 Aug 2017
dsplaisted
on 4 Aug 2017
I would expect #2000 to not be in play for these measurements, since we could only get a big win from that for the Exclude="**\pattern*\**" case, which isn't in the default excludes (except the **\.*\** one, but I wouldn't expect that to be relevant in the Roslyn case).
 rainersigwald
on 4 Aug 2017
rainersigwald
on 4 Aug 2017
Another inefficiency here is that we consider each item separately, so if you have
<ItemGroup>
  <A Include="**\*.cs" />
  <B Include="**\*.cs" />
</ItemGroup>
We'll grovel the whole directory twice.
Since the Sdk autoglobs cover Compile, EmbeddedResource, and None, all with recursive extension-based globs, that's (roughly) 3 full enumerations of files under the project folder.
It shouldn't be possible to create files between item evaluations in MSBuild (file-creation functions aren't available in property functions, thank heavens), so we could probably cache the result of directory enumerations for the duration of the item evaluation pass, making subsequent lookups faster.
rainersigwald
on 4 Aug 2017
How many disk lookups do we do for this?
 <Compile Include="**\*.iPhone.cs" />
 <Compile Remove="**\*.iPhone.cs" />
That'd be a full expansion--there's no mechanism to subtract patterns.
I don't think it'd be worthwhile to do the trivial "this exactly matches" pattern subtraction, and doing more sophisticated ones gets really complicated.
rainersigwald
on 4 Aug 2017
Nope, I'm wrong: we do have an if-exclude-exactly-matches-include check:
So that winds up doing no I/O.
rainersigwald
on 4 Aug 2017
@davkean
 <Compile Include="**\*.iPhone.cs" />
 <Compile Remove="**\*.iPhone.cs" />
Walks the file tree only once, for the include. Remove uses path aware comparisons and Regexes to remove.
 cdmihai
on 15 Aug 2017
cdmihai
on 15 Aug 2017
Recently while I was optimizing the generator that I am working on, I discovered that a lot of time is spent just by opening the project. To be more specific, it takes 20 seconds for opening the NHibernate test project by using the Project class (tested on Intel I7 860).
By analyzing the msbuild source to see what is exactly going on I found that the problem lies in the FileMatcher.GetFiles method which spends the most time on calling FileUtilities.PathsEqual (10 seconds) and FileMatcher.GetAccessibleFileSystemEntries (8 seconds).
Here is the whole trace:
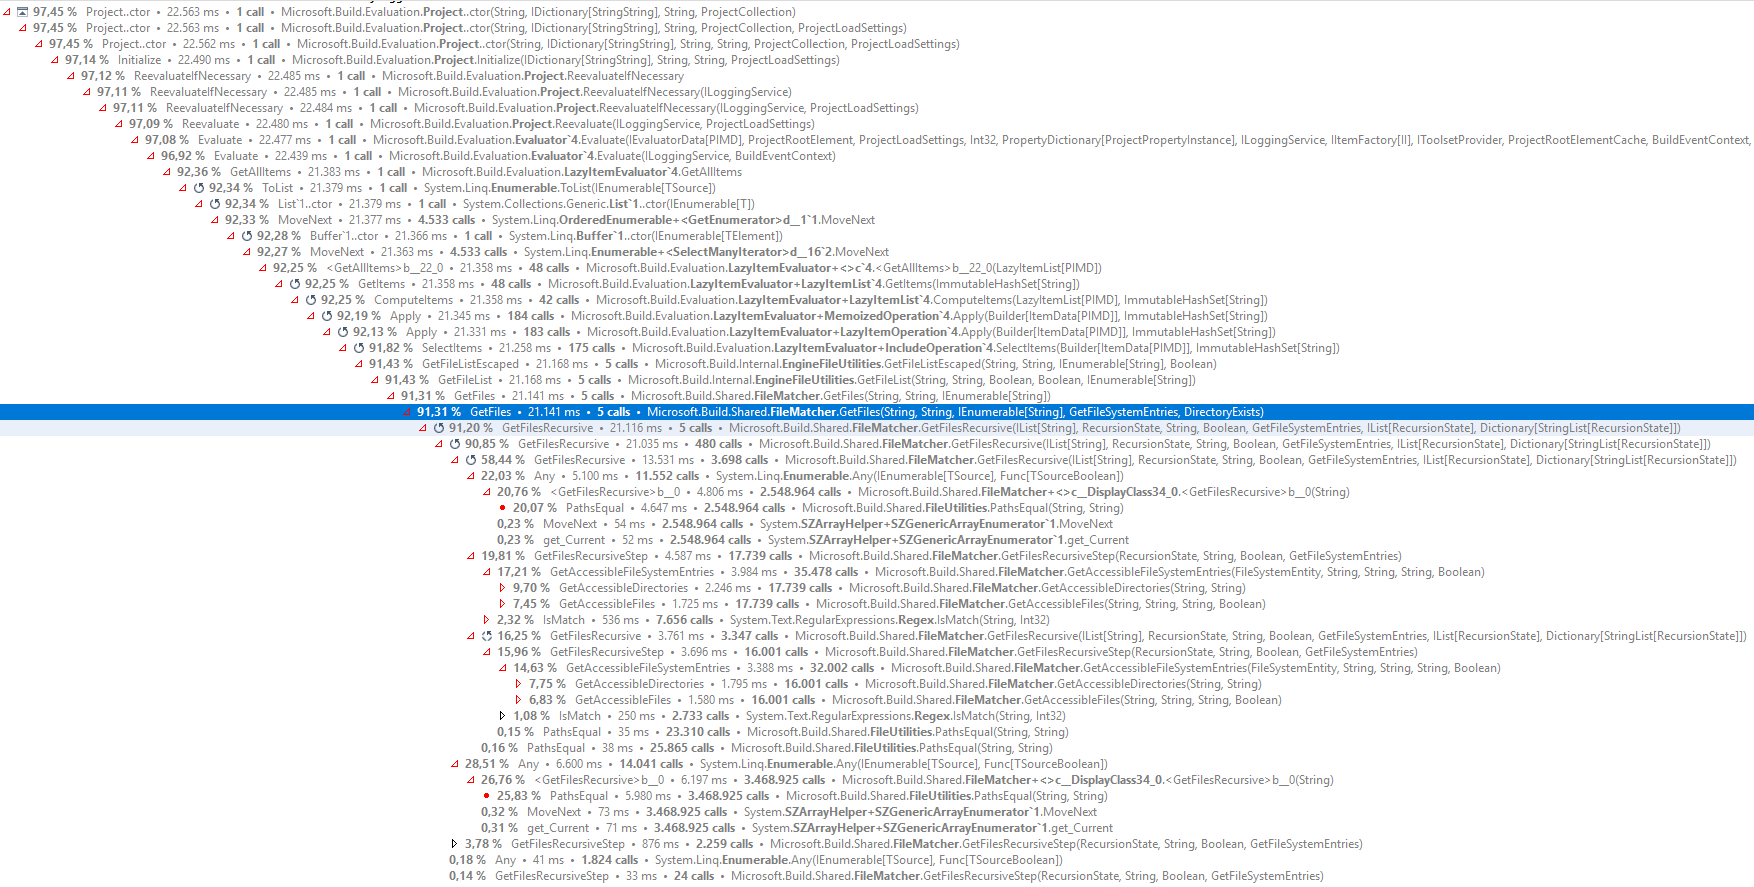
From the image above we can see that GetFiles method is called 5 times and by adding some extra logging the calls look like this:
Time: 8907ms, Returned files: 14, Call: FileMatcher.GetFiles(@"C:\Source\NHibernate.Test", @"**/*", new [] { @"obj\/**", @"**\*.hbm.xml", @"bin\Debug\/**", @"**/*.resx", @"**/.*/**", @"packages/**", @"**/*.vssscc", @"**/*.cs", @"**/*.sln", @"**/*.*proj", @"**/*.user", @"obj\Debug\/**", @"**\*.jpg", @"bin\/**" })
Time: 5132ms, Returned files: 3509, Call: FileMatcher.GetFiles(@"C:\Source\NHibernate.Test", @"**/*.cs", new [] { @"obj\/**", @"bin\Debug\/**", @"**/.*/**", @"packages/**", @"**/*.vssscc", @"**/*.sln", @"**/*.*proj", @"**/*.user", @"obj\Debug\/**", @"bin\/**" })
Time: 4945ms, Returned files: 0, Call: FileMatcher.GetFiles(@"C:\Source\NHibernate.Test", @"**/*.resx", new [] { @"obj\/**", @"bin\Debug\/**", @"**/.*/**", @"packages/**", @"**/*.vssscc", @"**/*.sln", @"**/*.*proj", @"**/*.user", @"obj\Debug\/**", @"bin\/**" })
Time: 329ms, Returned files: 827, Call: FileMatcher.GetFiles(@"C:\Source\NHibernate.Test", @"**\*.hbm.xml", new [] { @"bin\**\*.*" })
Time: 302ms, Returned files: 1, Call: FileMatcher.GetFiles(@"C:\Source\NHibernate.Test", @"**\*.jpg", new [] {  })
I don't know if those calls can be reduced but what I do know is that we could parallel the directory traversing as in those 20 seconds the cpu was always below 20% and we could add some caching to prevent calling GetAccessibleFileSystemEntries with the same arguments multiple times. By doing so, the opening time of the project was reduced to 6 seconds.
 maca88
on 17 Sep 2017
maca88
on 17 Sep 2017
PathEquals was redone in https://github.com/Microsoft/msbuild/pull/2401/commits/5ca888848c29aff808fbeec886d431004e0c0862 by @benaadams . Is your profile session done against the latest master?
Your experiments look good! We intend to introduce more caching in the evaluator, potentially a shareable cache with VS. Regarding parallelism, we're going to have to discuss it with VS. We've had instances in the past were we starved its thread pool.
cdmihai
on 19 Sep 2017
@cdmihai I think there will be a gain here if we do parallelism in long running "tasks" for just the I/O portion.
davkean
on 19 Sep 2017
Is your profile session done against the latest master?
Yes, I forgot to mention that, so the change for PathEquals was there.
I took some more time on experimenting those 5 calls in the previous post by applying 4 optimizations step by step to see the benefits of each, where each further step will contain the optimizations of the previous steps.
This is the test that will be run on each step, which basically contains the above 5 calls with some additional logging.
Before applying any optimization let's run the test on the latest master branch:
File spec: **/*, Call time: 8218ms, Returned files: 14
File spec: **/*.cs, Call time: 4479ms, Returned files: 3509
File spec: **/*.resx, Call time: 4573ms, Returned files: 0
File spec: **\*.hbm.xml, Call time: 290ms, Returned files: 827
File spec: **\*.jpg, Call time: 293ms, Returned files: 1
Total time: 17855ms
Now for each step apply an optimization and run the test:
- Add a per call cache to prevent calling
GetAccessibleFileSystemEntrieswith the same arguments multiple times:
File spec: **/*, Call time: 7136ms, Returned files: 14
File spec: **/*.cs, Call time: 3888ms, Returned files: 3509
File spec: **/*.resx, Call time: 3863ms, Returned files: 0
File spec: **\*.hbm.xml, Call time: 336ms, Returned files: 827
File spec: **\*.jpg, Call time: 332ms, Returned files: 1
Total time: 15558ms
- Normalize directory paths when calling
GetAccessibleFileSystemEntriesin order to replaceFileUtilities.PathsEqualwith==operator:
File spec: **/*, Call time: 1876ms, Returned files: 14
File spec: **/*.cs, Call time: 1306ms, Returned files: 3509
File spec: **/*.resx, Call time: 1119ms, Returned files: 0
File spec: **\*.hbm.xml, Call time: 342ms, Returned files: 827
File spec: **\*.jpg, Call time: 348ms, Returned files: 1
Total time: 4995ms
- Replace the per call cache with a "global" cache so that all 5 calls will share the same cache:
File spec: **/*, Call time: 1867ms, Returned files: 14
File spec: **/*.cs, Call time: 240ms, Returned files: 3509
File spec: **/*.resx, Call time: 257ms, Returned files: 0
File spec: **\*.hbm.xml, Call time: 15ms, Returned files: 827
File spec: **\*.jpg, Call time: 15ms, Returned files: 1
Total time: 2397ms
- Add parallel processing of subdirectories:
File spec: **/*, Call time: 414ms, Returned files: 14
File spec: **/*.cs, Call time: 60ms, Returned files: 3509
File spec: **/*.resx, Call time: 61ms, Returned files: 0
File spec: **\*.hbm.xml, Call time: 6ms, Returned files: 827
File spec: **\*.jpg, Call time: 4ms, Returned files: 1
Total time: 547ms
For each step the test was ran multiple times on idle cpu and the average time was taken.
As we can see from the above results the first optimization (cache per call) is slower (check **\*.hbm.xml and **\*.jpg) when there aren't multiple calls with the same arguments (or just few of them), because of the cache overhead. The cache only shines when shared through multiple calls.
maca88
on 19 Sep 2017
OK, here's what I think we should do:
For 15.5
Since the deadline is close, we'll go with these changes. Thanks @maca88! I'll fork your branch and get it ready:
- see if I can fix the breaking tests. Normalizing the paths to avoid
PathsEqualseems to be breaking a couple of assumptions. - experiment with bounding the
Parallel.ForEachvia ParallelOptions.MaxDegreeOfParallelism. My worry here is that the backing thread pool might create many threads if it notices the Parallel.ForEach tasks are taking a long time.
After 15.5
- Better, shareable, IO caching. The cache that @maca88 introduced avoids maybe half the IO a globbing walk does. This is because the file walk hits the disk twice for every subdirectory: once for directories, and once for files. While the directory enumeration hits the cache because it's similar between file walks, the file enumeration misses the cache each time because the cache keys are different (
*.cs, vs*.resx, vs*). Other benefits of the general IO cache:
- can be shared with multiple evaluation stages, like condition or property function existence checks
- can be pushed down from VS
The drawback of this cache is that we'll have to reimplement the .Net IO APIs used by evaluation to work on top of the cache's file system object model and not the real file system (e,g, directory enumeration with patterns). I wish .Net had a swap-able abstraction for the file system :(
Cache entire file enumerations.
EvaluationContext. Put the caches into a central object which can be passed by API callers to multiple Project evaluations to increase the lifetime of the caches. Something like
var projects = projectPaths.Select(path => new Project(path, evaluationContext))Look at reducing the number of file walks. It would be nice if we could look ahead at items, collect the literal globs, and do one file walk which collects multiple wildcards. At the very least, we should combine multiple globs from within the same item element into one file walk.
cdmihai
on 22 Sep 2017
@cdmihai We should try these changes on a non-SSD to see if we get similar wins, spinning disks are worse at parallelism than SSDs.
davkean
on 22 Sep 2017
Thanks to @lifengl suggestions I've made another version which contains the suggested modifications without any caching involved. Also, this time I've made sure that all tests are passing.
By running the same test as in the previous post, I've got the following results:
File spec: **/*, Call time: 392ms, Returned files: 14
File spec: **/*.cs, Call time: 355ms, Returned files: 3509
File spec: **/*.resx, Call time: 258ms, Returned files: 0
File spec: **\*.hbm.xml, Call time: 238ms, Returned files: 827
File spec: **\*.jpg, Call time: 239ms, Returned files: 1
Total time: 1484ms
The performance here is much better beacuse now the excluded patterns are not retrieved from the disk but rather checked with a wildcard matching algorithm that I took from here, with a minor modification as there was a bug ('BC*' didn't match 'ABC').
Also, I've added another scenario where the pattern differs on Windows and Unix, which I learned from here.
The next thing I tried was to add a cache so that all calls would share it, here are the results:
File spec: **/*, Call time: 436ms, Returned files: 14
File spec: **/*.cs, Call time: 236ms, Returned files: 3509
File spec: **/*.resx, Call time: 128ms, Returned files: 0
File spec: **\*.hbm.xml, Call time: 112ms, Returned files: 827
File spec: **\*.jpg, Call time: 97ms, Returned files: 1
Total time: 1011ms
The cache was added only for directories as files are now retrieved only once for a pattern. If we compare this result with the result from the previous post on point 3, we can see that in this results, only the first pattern is faster. The reason is that in the previous post all files were retrieved in the first call because they were located in the exclude patterns.
With this version adding a parallel version is not so simple as we are dealing with a IEnumerable<>, also caching required a special wrapper.
Edit:
I managed to make a parallel version by using a thread safe cache for IEnumerable<> and added a simple logic to calculate the MaxDegreeOfParallelism in order to prevent spawning too many tasks.
Here are the results without caching:
File spec: **/*, Call time: 148ms, Returned files: 14
File spec: **/*.cs, Call time: 152ms, Returned files: 3509
File spec: **/*.resx, Call time: 135ms, Returned files: 0
File spec: **\*.hbm.xml, Call time: 112ms, Returned files: 827
File spec: **\*.jpg, Call time: 92ms, Returned files: 1
Total time: 643ms
and with caching:
File spec: **/*, Call time: 149ms, Returned files: 14
File spec: **/*.cs, Call time: 78ms, Returned files: 3509
File spec: **/*.resx, Call time: 47ms, Returned files: 0
File spec: **\*.hbm.xml, Call time: 53ms, Returned files: 827
File spec: **\*.jpg, Call time: 42ms, Returned files: 1
Total time: 369ms
I copied the project to a 1TB 7200rpm HHD to run the test with the parallel version to see the differences and the results were quite surprising for me. By running the test 10 times in a row and comparing the total time, sometimes the SSD was the winner and sometimes the HHD (average difference 50-100ms between the two), so there wasn't a clear winner.
Edit:
I've made a custom wildcard matching algorithm that is faster that the one mentioned above and allocates less memory.
maca88
on 23 Sep 2017
@maca88 This looks really promising. Note I cannot see a license for the code on http://www.c-sharpcorner.com/uploadfile/b81385/efficient-string-matching-algorithm-with-use-of-wildcard-characters/, so if your custom wildcard matching algorithm is based on that - we'll need to clean room implement it on our side.
davkean
on 25 Sep 2017
The custom algorithm is based on the ideas from this article, which are:
- Is enough to store only the last occurrence of the
*wildcard with the last matched character in the input - When a
*wildcard is encountered, we can skip ahead until we find a match on the character after the wildcard e.g.("aaaab", "*b")-> we can storebfrom the input instead the firsta - Skip all repetitive
*wildcards e.g.("aaab", "***b")-> we can skip the first two*wildcards
Based on the above ideas I made my own implementation that I posted here. I don't know if this is a clean room implementation or not.
Also, after revisiting the algorithm I've simplified it and added a tail matching logic when we encounter a pattern *? e.g. ("veryloooongstringb", "*?b") -> only the last two characters will be checked, which was something that came into my mind (no articles involved). Here you can find the current algorithm after the revisit.
maca88
on 25 Sep 2017
@maca88
We're really interested in getting your changes as a PR :)
One big thing we need to settle is the IP for the pattern matching algorithm. To make sure we've understood it right:
- your first algorithm was based on the code snippet from this article
- your second algorithm is written from scratch by you, based on this article
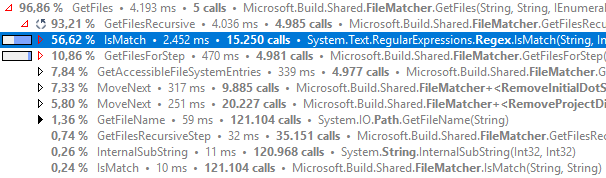
In case there are any IP issues, I quickly hacked up a Regex based implementation of IsMatch to see how it fares. It seems to be doing pretty well:
Info:
- glob.proj has all the includes and excludes from a web project, and it globs over an npm_modules directory
- msbuild was built with the Release configuration
master
File spec: **/*.cs, Call time: 1160ms, Returned files: 3512
File spec: **/*.resx, Call time: 1154ms, Returned files: 0
File spec: **\*.hbm.xml, Call time: 147ms, Returned files: 827
File spec: **\*.jpg, Call time: 139ms, Returned files: 1

Project Evaluation Performance Summary:
      105 ms  e:\delete\nhibernate-core\src\NHibernate.DomainModel\NHibernate.DomainModel.csproj   2 calls
     1889 ms  e:\delete\nhibernate-core\src\NHibernate\NHibernate.csproj   2 calls
     5042 ms  e:\delete\nhibernate-core\src\NHibernate.Test\NHibernate.Test.csproj   1 calls

Project Evaluation Performance Summary:
     7268 ms  E:\delete\npm\glob.proj                    1 calls
custom pattern matching
File spec: **/*.cs, Call time: 31ms, Returned files: 3512
File spec: **/*.resx, Call time: 24ms, Returned files: 0
File spec: **\*.hbm.xml, Call time: 24ms, Returned files: 827
File spec: **\*.jpg, Call time: 20ms, Returned files: 1

Project Evaluation Performance Summary:
       54 ms  e:\delete\nhibernate-core\src\NHibernate.DomainModel\NHibernate.DomainModel.csproj   2 calls
      243 ms  e:\delete\nhibernate-core\src\NHibernate\NHibernate.csproj   2 calls
      664 ms  e:\delete\nhibernate-core\src\NHibernate.Test\NHibernate.Test.csproj   1 calls

Project Evaluation Performance Summary:
      698 ms  E:\delete\npm\glob.proj                    1 calls
Regex based matching
File spec: **/*.cs, Call time: 37ms, Returned files: 3512
File spec: **/*.resx, Call time: 28ms, Returned files: 0
File spec: **\*.hbm.xml, Call time: 22ms, Returned files: 827
File spec: **\*.jpg, Call time: 37ms, Returned files: 1

Project Evaluation Performance Summary:
       60 ms  e:\delete\nhibernate-core\src\NHibernate.DomainModel\NHibernate.DomainModel.csproj   2 calls
      268 ms  e:\delete\nhibernate-core\src\NHibernate\NHibernate.csproj   2 calls
      681 ms  e:\delete\nhibernate-core\src\NHibernate.Test\NHibernate.Test.csproj   1 calls

Project Evaluation Performance Summary:
      724 ms  E:\delete\npm\glob.proj                    1 calls
@cdmihai I would prefer if we didn't use RegEx - it's already showing up on the radar - it's extremely inefficient both in time and memory.
davkean
on 28 Sep 2017
We checked with the lawyers, an algorithm based on the csharpcorner article is fine to submit to us for PR. Their terms are very broad and allows site visitors to use code or articles freely and without restriction. And thanks so much @maca88 !
 AndyGerlicher
on 28 Sep 2017
AndyGerlicher
on 28 Sep 2017
@cdmihai for the pattern matching algorithm, you understood it correctly.
I agree with @davkean, in the long term we should get rid of RegEx completely, as it is really slow (create our own glob matching algorithm).
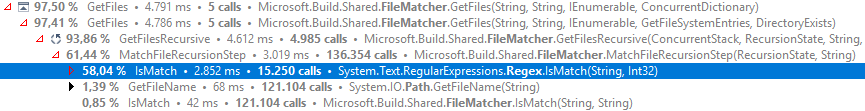
The above trace was captured when running the test on the npm project.
I will create a PR, but before that I will revisit the changes, as I recently discovered that the parallel change doesn't work as expected when we are dealing with paths that are too long, an AggregateException is thrown that is not handled correctly by the ExceptionHandling.IsIoRelatedException.
Also, I don't thnik that the cache change should be included, as currently we don't have a shareable cache that would be passed in the FileMatcher.GetFiles method. IMO, the caching should be added after we will have the EvaluationContext as explained by @cdmihai.
maca88
on 28 Sep 2017
@maca88
Quite curious, are you profiling Release bits? I had found out that Regex.IsMatch goes way down on Release vs Debug.
Regarding caching, I think you should put it in. The EvaluationContext will not come in the next VS release, 15.5, so if you add it in VS users will benefit from caching earlier on :). Later when we add in the EvaluationContext, we'll just push the cache into it.
Your cache's lifetime should be the item evaluation phase, so all item operations from one evaluation would reuse it.
It should probably get created and passed into the LazyItemEvaluator here, and get to the include glob expansion via the include operation builder.
cdmihai
on 28 Sep 2017
Quite curious, are you profiling Release bits?
It was in Debug, I forgot to switch in Release. Here is the trace for Release:
Even in Release is still slow.
For caching it's settled then, will create and pass the cache into the LazyItemEvaluator as you said.
maca88
on 29 Sep 2017
@cdmihai with the new pattern matching logic added by @maca88, I think maybe it is possible to remove the regular expression completely after 15.5. What is more than the file pattern for file names, the path pattern really adds '*', which is similar to what '' did on the file name level.
I think we can implement something like IsMatch(pattern, fullPath) to support patterns like
"wwwroot**", and it can be optimized to return true for a path "wwwrootab\c", once it reaches "wwwroot\" portion of the string without scanning rest characters. Also, it can return false for a path like "abc\d" after checking the first character. That will be somewhat closer to the IsMatch method added in the later iteration of this performance change.
With that, it may be possible to get rid of regular expressions completely.
Go further, with that implementation, we may pull out the local state out of this implementation, and it becomes a no state code + state. The result is that it can start from the state of the parent directory when it scans into its sub directories. So, if the top directory is "abc", the state will reach "No match" state immediately, and if it is an include path, no need to go further to sub directories. And if the top one is "wwwroot", it will enter a state that everything below is matched, and it ends up scanning, if it is the excluded path. When it scans files directories inside one folder, it will start with a shared state (of the parent folder), and the entire scanning process may be driven by the state.
 lifengl
on 7 Oct 2017
lifengl
on 7 Oct 2017
@lifengl
I also think we could get rid of Regex, though we'd have to be careful of complex patterns like wwwroot/**/a?b/**/c*d/**/file?.cs. If there are any other directory fragments after a recursive wildcard, we can't backtrack early and we have to walk the file system in case there's a match for the remaining directory wildcards. The exclude patterns can be equally complex. The current code switches to regexes if it finds any other directories after the first recursive wildcard directory. Didn't think to deeply about it, but one way to get over it is to break.
I'll profile globbing with @maca88's changes and see where the next bottleneck is, Regexes or IO.
cdmihai
on 7 Oct 2017
This has been resolved by: https://github.com/Microsoft/msbuild/pull/2572.
davkean
on 11 Oct 2017
@cdmihai
By the way did you consider compiling Regex i.e. RegexOptions.Compiled? This should improve performance of IsMatch() call however compilation will take some time. It may be worthwhile if the same expression is evaluated multiple times.
 zhilich
on 15 Dec 2017
zhilich
on 15 Dec 2017
Opened #2817
cdmihai
on 15 Dec 2017
Although it might take some work or complexity to make an algorithm to support complex patterns, the 99% of globs used in projects are very simple. They often start from a base folder, either one level or all sub directories with some file extensions. We just need a very efficient code to handle those cases, and leave odd complex patterns to the regular expression. This might give you a more efficient product in the real world scenario than a complete algorithm.
Sent from my phone
On Dec 16, 2017, at 10:29 AM, Mihai Codoban <[email protected]notifications@github.com> wrote:
—
You are receiving this because you were mentioned.
Reply to this email directly, view it on GitHubhttps://eur01.safelinks.protection.outlook.com/?url=https%3A%2F%2Fgithub.com%2FMicrosoft%2Fmsbuild%2Fissues%2F2392%23issuecomment-352116354&data=02%7C01%7C%7C4473ca66a81b4d90f71208d54402e7e2%7C84df9e7fe9f640afb435aaaaaaaaaaaa%7C1%7C0%7C636489701624596121&sdata=DKaiHp3VcdiiHdOZwN0QcWCy2dacQ3qmWNZKdYiI2bI%3D&reserved=0, or mute the threadhttps://eur01.safelinks.protection.outlook.com/?url=https%3A%2F%2Fgithub.com%2Fnotifications%2Funsubscribe-auth%2FALGWwo6xMiUnuolX6Ph6CSJREpubDxIcks5tAuSvgaJpZM4Or9vl&data=02%7C01%7C%7C4473ca66a81b4d90f71208d54402e7e2%7C84df9e7fe9f640afb435aaaaaaaaaaaa%7C1%7C0%7C636489701624596121&sdata=cMOZOXCR%2FbhFGAOrcJuhoCdNVDHUJTaPdNxZlXRAbcA%3D&reserved=0.
lifengl
on 16 Dec 2017
Related issues
davkean
·
3Comments
 rokups
·
3Comments
rokups
·
3Comments
 eduardobr
·
3Comments
dsplaisted
·
4Comments
eduardobr
·
3Comments
dsplaisted
·
4Comments
 v-lali
·
3Comments
v-lali
·
3Comments
Most helpful comment
OK, here's what I think we should do:
For 15.5
Since the deadline is close, we'll go with these changes. Thanks @maca88! I'll fork your branch and get it ready:
PathsEqualseems to be breaking a couple of assumptions.Parallel.ForEachvia ParallelOptions.MaxDegreeOfParallelism. My worry here is that the backing thread pool might create many threads if it notices the Parallel.ForEach tasks are taking a long time.After 15.5
*.cs, vs*.resx, vs*). Other benefits of the general IO cache:The drawback of this cache is that we'll have to reimplement the .Net IO APIs used by evaluation to work on top of the cache's file system object model and not the real file system (e,g, directory enumeration with patterns). I wish .Net had a swap-able abstraction for the file system :(
Cache entire file enumerations.
EvaluationContext. Put the caches into a central object which can be passed by API callers to multiple Project evaluations to increase the lifetime of the caches. Something like
var projects = projectPaths.Select(path => new Project(path, evaluationContext))Look at reducing the number of file walks. It would be nice if we could look ahead at items, collect the literal globs, and do one file walk which collects multiple wildcards. At the very least, we should combine multiple globs from within the same item element into one file walk.