Mplfinance: addplot using dataframes of different dimensions
Hello,
I have a simple use-case, in which I try to plot additional data within the same figure as the basic Candlestick plot using addplot. Now, the requirement is to plot the additional data using a larger version of the dataframe used in the plot function, so that the additional data exceeds the candlesticks on the x axis. For example, in the code snippet below, the compact_df is a slightly shorter version of df.
tcdf = df[['LowerB','UpperB']]  # DataFrame with two columns
apd  = mpf.make_addplot(tcdf)
mpf.plot(compact_df,addplot=apd)
As a result I would expect something like this:
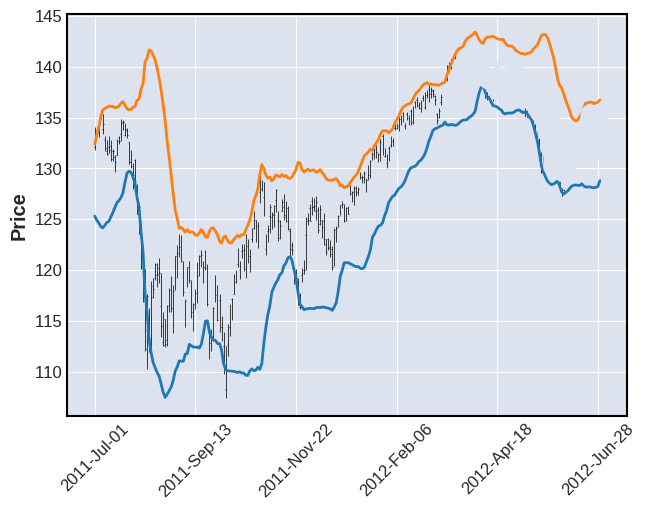
At the moment, the plot function complains about different dimensions of x and y, which I guess is the indended behaviour. My question is: Would it make sense to achieve this going the way I described and if so, how to do it?
I am pretty sure there should be an elegant solution to my problem, but I cannot seem to find anything satisfactory. Thank you for the help.
 viorell91
All 3 comments
Presently mplfinance.plot() requires that the ohlc(v) dataframe, and any addplot data, be the same length.
This was done because:
- addplot data and the ohlc(v) data share the same x-axis
(which defined by the index on the ohlc(v) dataframe that was passed tompf.plot()). - it allows users to pass data into addplot as a simple list, or any other iterable, without the need for any index.
(since the ohlc(v) dataframe index is used for the x-axis).
Note that If you do pass a series or dataframe tomake_addplot(), the index of that series or dataframe is ignored. - it helps keep the code inside mplfinance simpler (and therefore easier to maintain) since mplfinance doesn't have to worry about figuring out how to line up data sets of various lengths.
The solution is to
- make sure all data sets the same length, and
- insert
nanvalues wherever you don't want to see data
Using the example from the addplot notebook:
tcdf = df[['LowerB','UpperB']]  # DataFrame with two columns
apd  = mpf.make_addplot(tcdf)
compact_df = df.copy()
for date in compact_df.iloc[175:].index:
    compact_df.loc[date,:] = [float('nan')]*9
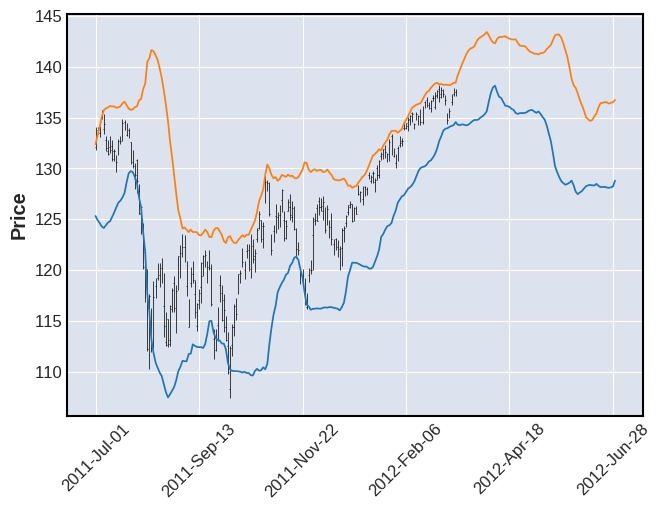
mpf.plot(compact_df,addplot=apd)
The result:
 DanielGoldfarb
on 19 Mar 2021
DanielGoldfarb
on 19 Mar 2021
Thanks @DanielGoldfarb. (I was trying to insert empty strings in places I didn't need the data 🤦)
viorell91
on 21 Mar 2021
@viorell91 ... ha ... i did the "same" thing too once: i inserted None (instead of nan) where I didn't want data ... took me a long time to figure out why it had "stopped working" 😔🤪
All the best. --Daniel
DanielGoldfarb
on 23 Mar 2021
Related issues
 kitt-th
·
5Comments
kitt-th
·
5Comments
 obahat
·
3Comments
obahat
·
3Comments
 schorschie
·
3Comments
schorschie
·
3Comments
 tessanix
·
5Comments
tessanix
·
5Comments
 ghost355
·
5Comments
ghost355
·
5Comments