Mne-python: stc.plot with pyvista: error with hemi='both'
I am not able to plot the two hemispheres of an stc at the same time with time_viewer=True , for instance when using this example:
stc.plot(hemi='both', subjects_dir=subjects_dir, initial_time=0.07,
          size=(800, 600),time_viewer=True)
Error:
File "/home/sh254795/pyvista/pyvista/plotting/plotting.py", line 2215, in subplot
raise IndexError('Column index is out of range ({})'.format(self.shape[1]))IndexError: Column index is out of range (1)
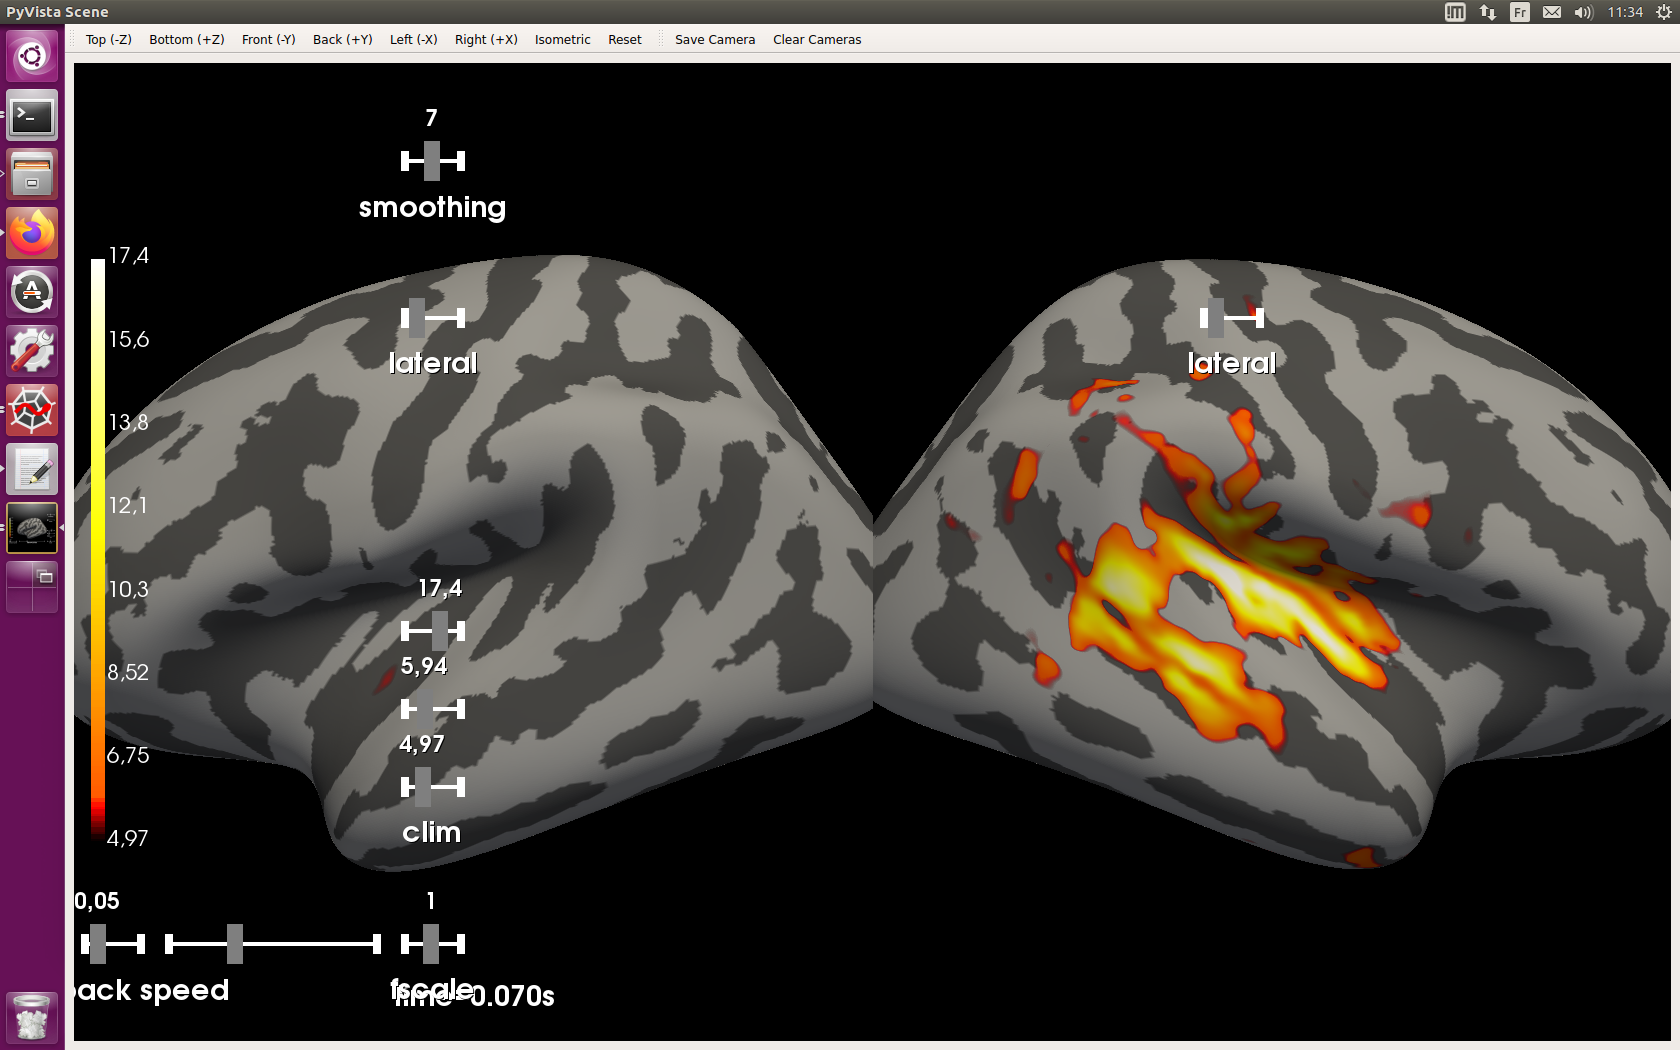
With hemi='split' the panels overlap, and the time-slider is not usable (I can send a screenshot).
Also, from the documentation it is not clear to me what the difference between 'both' and 'split' would do.
 SophieHerbst
All 4 comments
Could you share a screenshot? It would help me understand the situation.
A fix for the slider position in hemi=split is in https://github.com/mne-tools/mne-python/pull/7227/commits/5d78f05ef95c858edb20a7851572cc92719eb1fa. The PR is still waiting for reviews but hopefully soon to be merged.
Also I can reproduce the issue with hemi=both so I'll work on a fix soon :+1:
Also, from the documentation it is not clear to me what the difference between 'both' and 'split' would do.
From the doc of _Brain:
    hemi : str
        Hemisphere id (ie 'lh', 'rh', 'both', or 'split'). In the case
        of 'both', both hemispheres are shown in the same window.
        In the case of 'split' hemispheres are displayed side-by-side
        in different viewing panes.
The hemispheres are in the same view with both and are in different views with split. Feel free to share suggestions about how we can improve the documentation.
 GuillaumeFavelier
on 24 Jan 2020
GuillaumeFavelier
on 24 Jan 2020
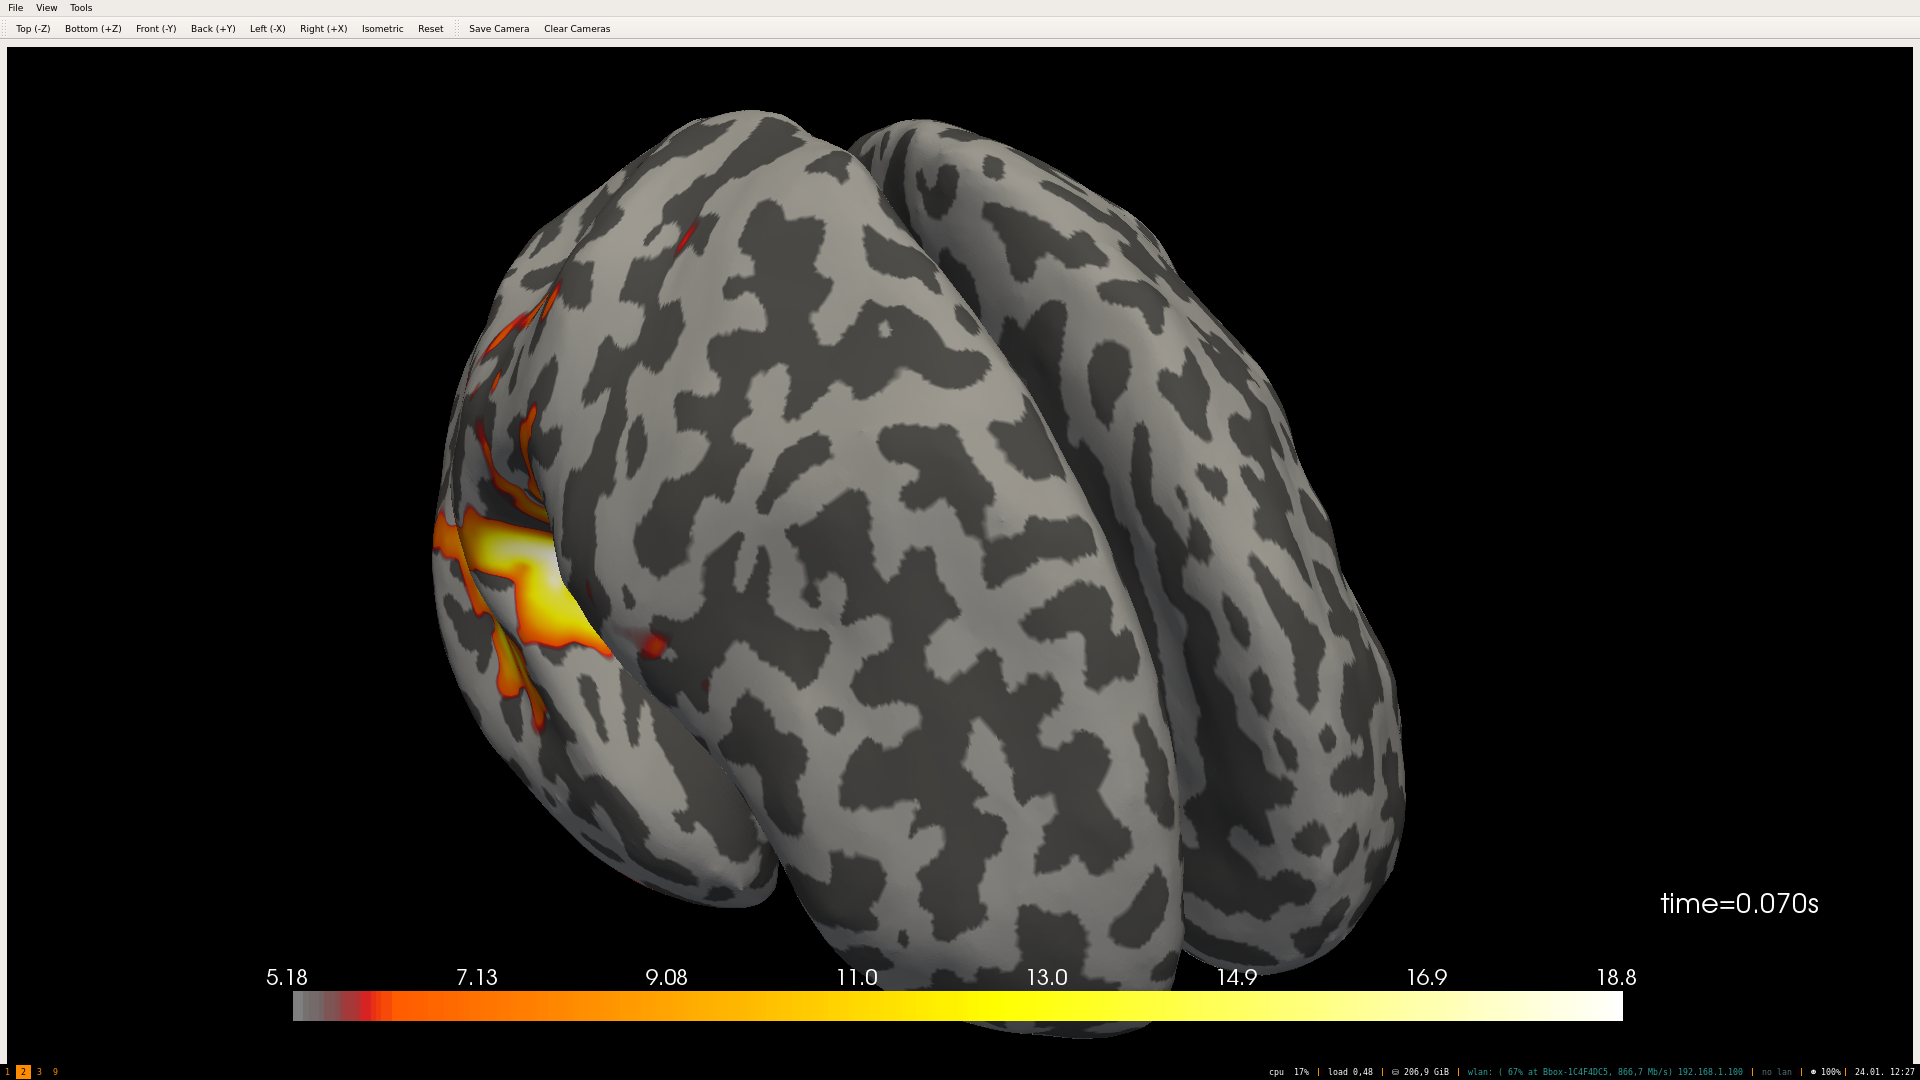
Here is an example:
Split | Both
------|------
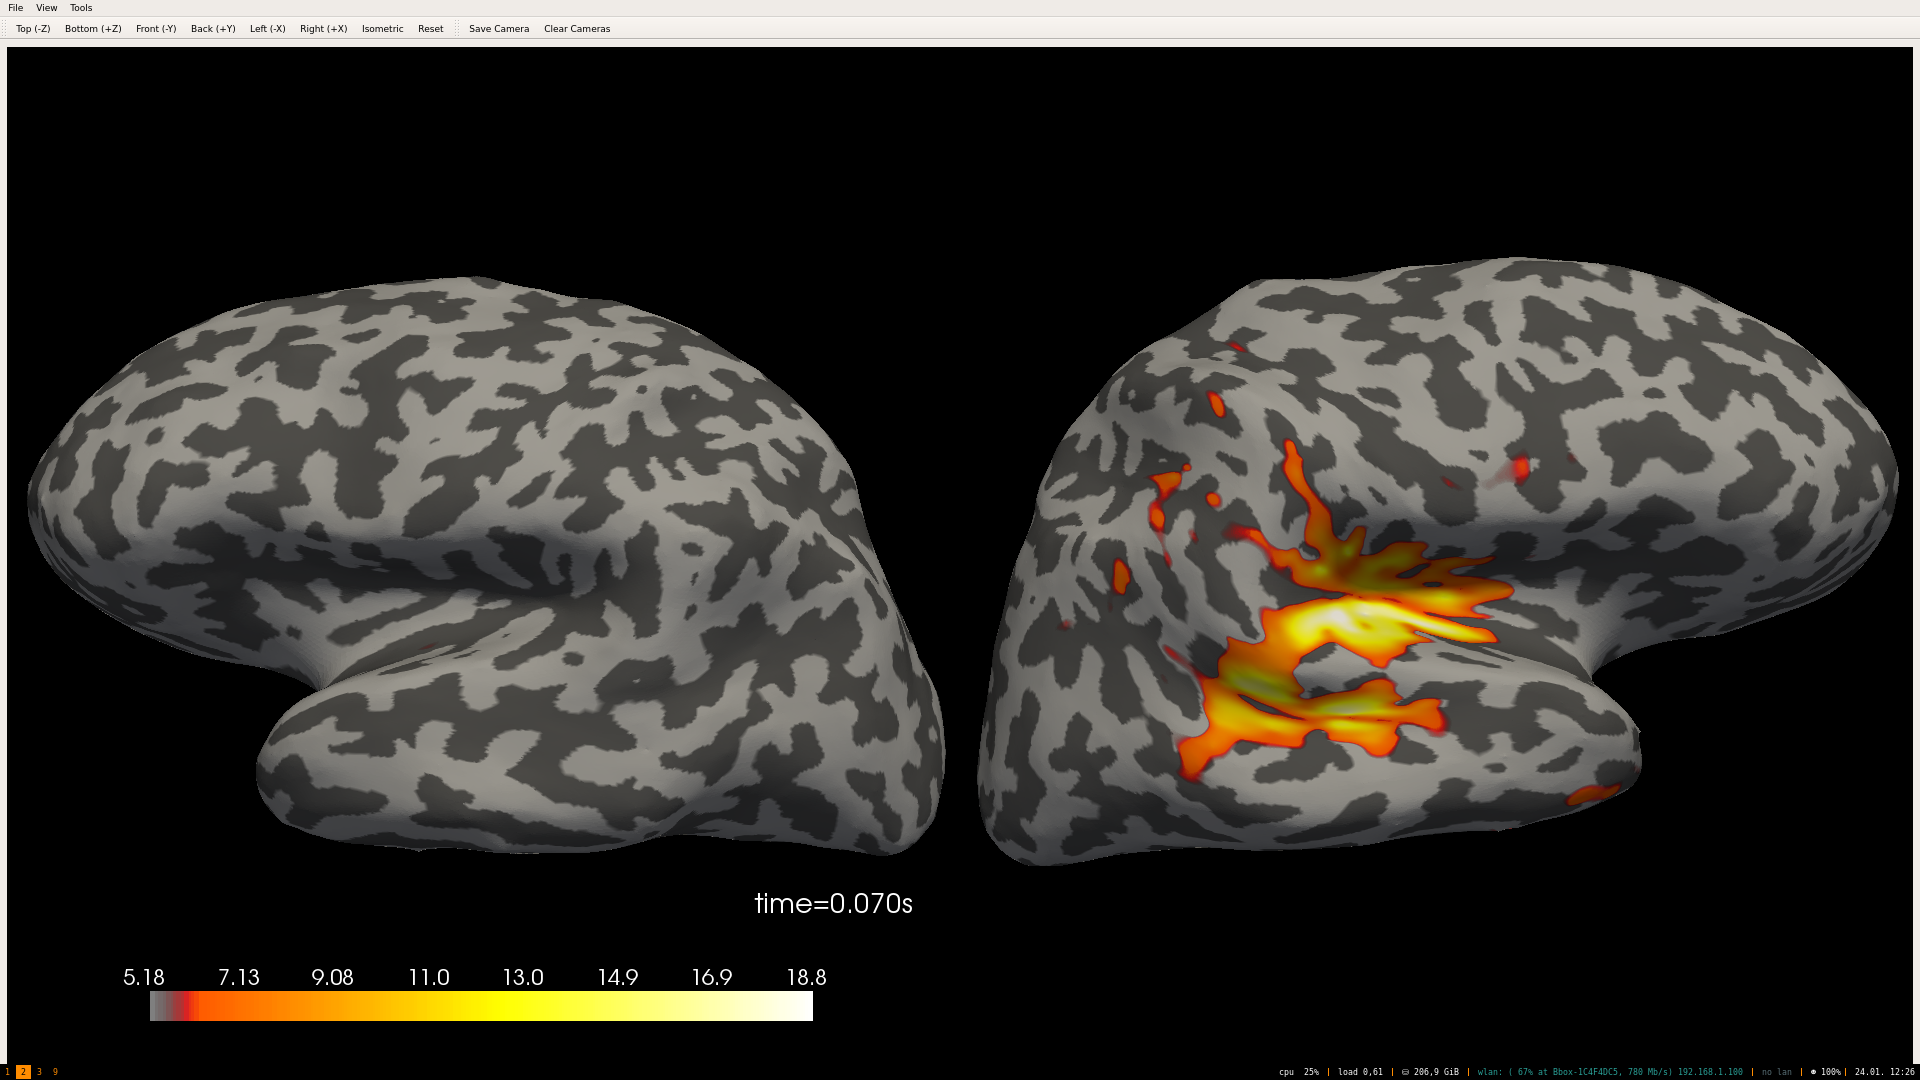 |
| 
GuillaumeFavelier
on 24 Jan 2020
Here is a screenshot, using the split option with time_viewer.
SophieHerbst
on 24 Jan 2020
About the doc: the one from _Brain is totally fine, it just needs to be copied to the one of stc.plot, which currently says:
hemi : str, ‘lh’ | ‘rh’ | ‘split’ | ‘both’
The hemisphere to display.
SophieHerbst
on 24 Jan 2020
Related issues
 hoechenberger
·
6Comments
hoechenberger
·
6Comments
 erfpak7
·
5Comments
erfpak7
·
5Comments
 bloyl
·
6Comments
bloyl
·
6Comments
 nbara
·
4Comments
nbara
·
4Comments
 annesodub
·
3Comments
annesodub
·
3Comments