Mne-python: raw.plot does not work on my data
I've faced a problem regarding the raw.plot().
I have a .csv file with 7782 X 21 (n_times, n_channel) structure - myData. I've used mne.io.RawArray function to convert my data to a raw data format readable by mne data structure.
Besides, it is not an interactive plot. How can I make it interactive?
 erfpak7
All 5 comments
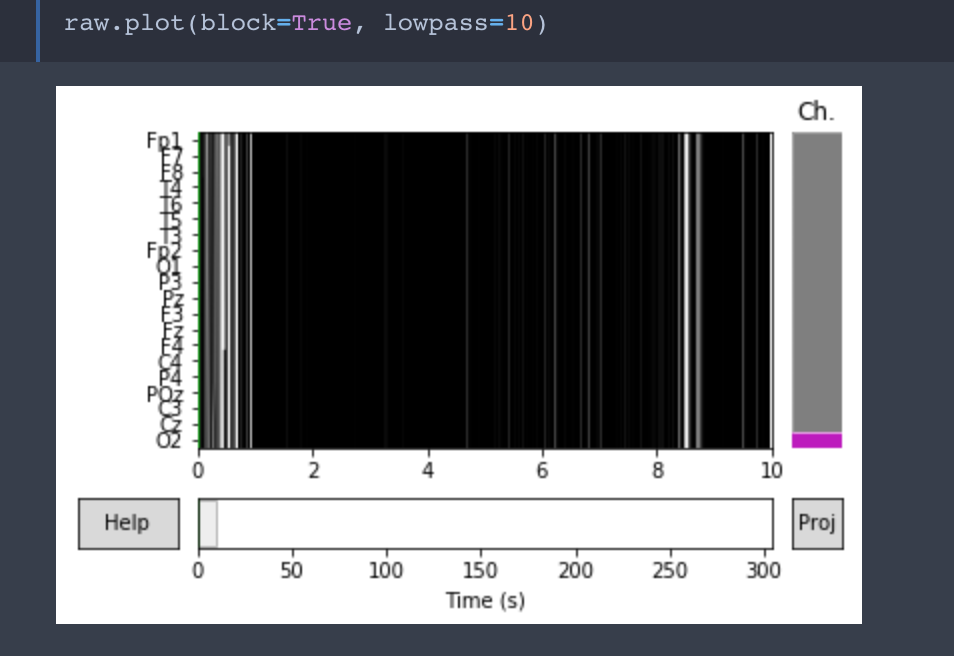
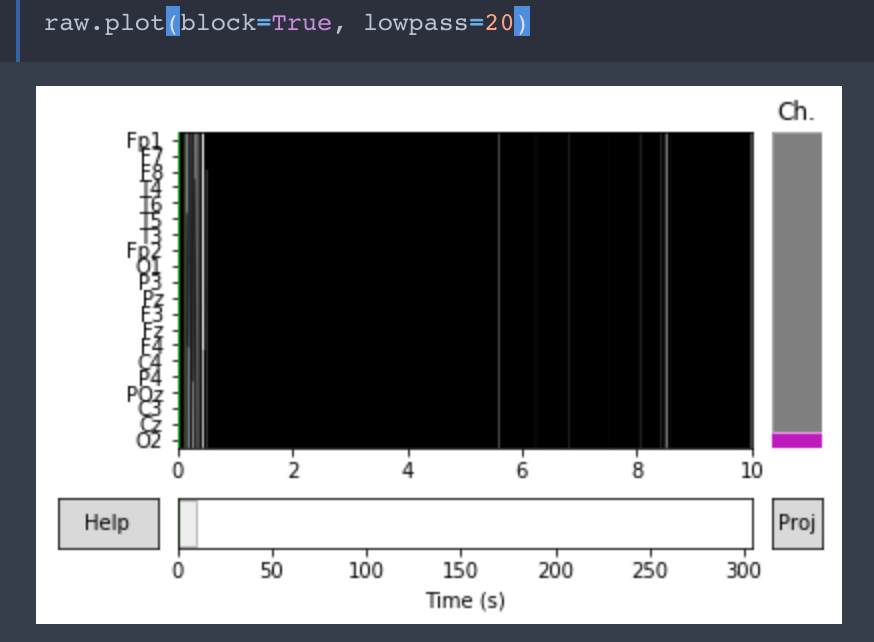
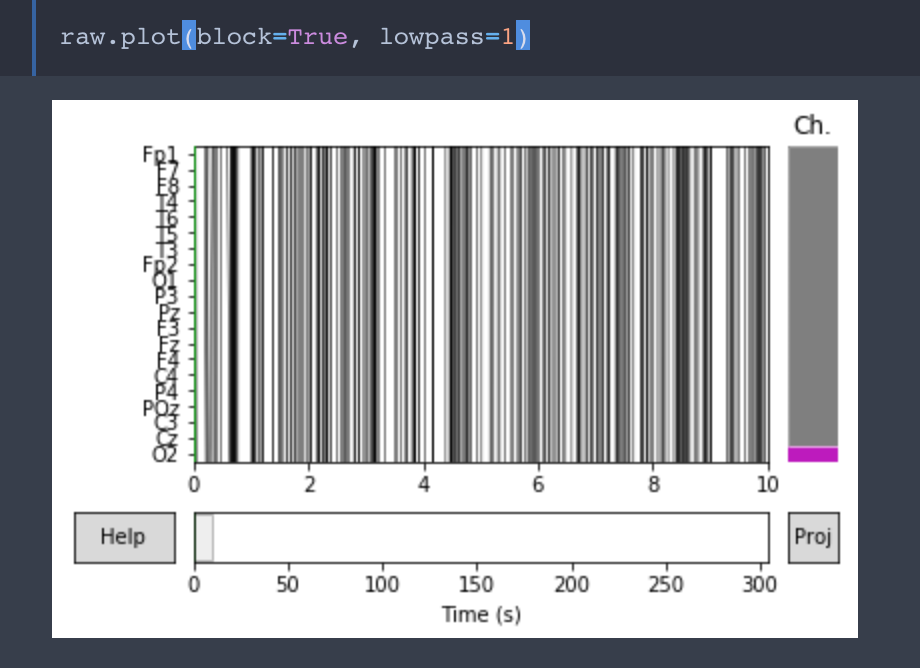
You need to change the scaling of the plot or your data. Probably you have data in units of uV and MNE expects data in V
 larsoner
on 20 Sep 2018
larsoner
on 20 Sep 2018
You need to change the scaling of the plot or your data. Probably you have data in units of uV and MNE expects data in V
Thanks for the quick response. It is not an interactive plot. How can I make it interactive?
erfpak7
on 20 Sep 2018
it's interactive if you don't use %matplotlib inline
in the notebook. You can use "%matplotlib qt" or try
"%matplotlib notebook"
 agramfort
on 20 Sep 2018
agramfort
on 20 Sep 2018
I'd recommend %matplotlib or %matplotlib qt, %matplotlib notebook doesn't work so well on my machine - it seems to be slower and usually the default figure size does not fit in the output window of the notebook so the navigation is inconvenient.
 mmagnuski
on 5 Oct 2018
mmagnuski
on 5 Oct 2018
Closing as solved, @erfpak7 feel free to reopen if you still have troubles
 massich
on 10 Oct 2018
massich
on 10 Oct 2018
Related issues
 annesodub
·
3Comments
annesodub
·
3Comments
 Sirabhop
·
6Comments
larsoner
·
5Comments
Sirabhop
·
6Comments
larsoner
·
5Comments
 seankmartin
·
4Comments
seankmartin
·
4Comments
 hoechenberger
·
6Comments
hoechenberger
·
6Comments
Most helpful comment
You need to change the scaling of the plot or your data. Probably you have data in units of uV and MNE expects data in V