Mne-python: Bug in vector source estimate plotting
Describe the bug
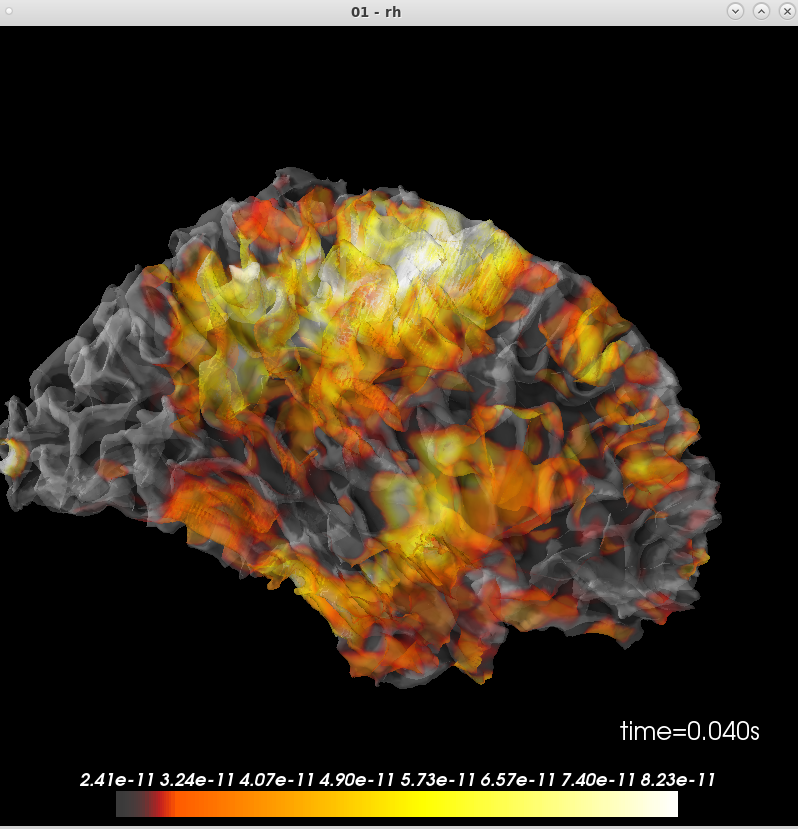
This was reported to me by @rythorpe. The vector source estimate does not plot arrows for the somato data.
Steps and/or code to reproduce
Here is a gist to reproduce the problem. I don't see any issue with the script. Indeed, if you do:
print(stc)
you get:
<VectorSourceEstimate | 8155 vertices, subject : 01, tmin : -199.79521315838787 (ms), tmax : 199.79521315838792 (ms), tstep : 3.3299202193064645 (ms), data shape : (8155, 3, 121)>
and if you do:
print(stc.data.shape)
you get:
(8155, 3, 121)
indicating that the stc is vector.
Expected results
There should be an arrow plot
Actual results
but the plot shows:
Additional information
I'm on the latest master, commit 42948689e.
and mne.sys_info() gives:
Platform:      Linux-3.10.0-957.1.3.el7.x86_64-x86_64-with-centos-7.6.1810-Core
Python:        3.6.7 | packaged by conda-forge | (default, Feb 28 2019, 09:07:38)  [GCC 7.3.0]
Executable:    /autofs/space/meghnn_001/users/mjas/anaconda3/envs/mne/bin/python
CPU:           x86_64: 64 cores
Memory:        125.3 GB

mne:           0.20.dev0
numpy:         1.15.4 {blas=mkl_rt, lapack=mkl_rt}
scipy:         1.2.1
matplotlib:    3.0.2 {backend=Qt5Agg}

sklearn:       0.20.2
numba:         Not found
nibabel:       2.3.3
cupy:          Not found
pandas:        0.24.1
dipy:          0.15.0
mayavi:        4.7.0.dev0 {qt_api=pyqt5, PyQt5=5.9.2}
pyvista:       Not found
vtk:           8.1.2
 jasmainak
All 18 comments
@GuillaumeFavelier maybe can you have a look? thanks
 agramfort
on 5 Nov 2019
agramfort
on 5 Nov 2019
Okay, first good news: I'm able to reproduce. Thanks for reporting @jasmainak
 GuillaumeFavelier
on 5 Nov 2019
GuillaumeFavelier
on 5 Nov 2019
Then there is the fact that the automatically computed scale_factor value is really small in my experiment. This variable influences the scaling of the glyphs:
magnitude = np.linalg.norm(array, axis=1)
magnitude_max = magnitude.max()
scale_factor_norm = scale_factor / magnitude_max
My results using the gist:
scale_factor=3.2947158840968823e-21
magnitude_max=3.0642358332091084e-10
Which gives scale_factor_norm=1.07521615940585e-11, this is too small I think.
For reference: https://github.com/nipy/PySurfer/blob/master/surfer/viz.py#L1098-L1105
GuillaumeFavelier
on 5 Nov 2019
do you suggest a fix?
>
agramfort
on 5 Nov 2019
Apparently using scale_factor=20 instead of scale_factor=None already helps in my case but there is maybe more to it.
GuillaumeFavelier
on 5 Nov 2019
could you try it out @jasmainak ?
...
# Plot brain
- brain = stc.plot(subjects_dir=subjects_dir,subject='01',hemi='rh',views='par',initial_time=0.04)
+ brain = stc.plot(subjects_dir=subjects_dir,subject='01',hemi='rh',views='par',initial_time=0.04, scale_factor=20)
If the scale factor logic can be improved we could consider it a bug fix
 larsoner
on 5 Nov 2019
larsoner
on 5 Nov 2019
Yes, the scale_factor does seem to improve things. Although it is still a bit hard to see the arrows depending on how you rotate the brain. Not sure if that's expected. If the automatic logic is not so reliable, maybe one option is to add it as an option to tweak in the time_viewer ?
jasmainak
on 5 Nov 2019
At the moment, the automatic scaling for plot_vector_source_estimates still relies on PySurfer. If we make a fix in MNE, the patch would be PySurfer-specific right?
On the MNE side, I could suggest something which is in the order of magnitude of:
scale_factor = (np.linalg.norm(array, axis=1)).max() / magnitude[:, 0].max()
I haven't looked at how this is currently handled in the code, so maybe this is a dumb idea, but it seems to me that you will never want your longest arrow to be longer than, say, 1/5 the width of a cerebral hemisphere at most. Would it be enough to always scale such that the longest arrow ends up that size?
On November 5, 2019 8:24:08 AM PST, Mainak Jas notifications@github.com wrote:
Yes, the
scale_factordoes seem to improve things. Although it is
still a bit hard to see the arrows depending on how you rotate the
brain. Not sure if that's expected. If the automatic logic is not so
reliable, maybe one option is to add it as an option to tweak in the
time_viewer?
 drammock
on 5 Nov 2019
drammock
on 5 Nov 2019
@GuillaumeFavelier we can implement the fix on the MNE side, then we don't break people's independent PySurfer code. Or you can try to backport the fix.
We'll probably want it for the PyVista implementation anyway.
Regarding which heuristic to use (e.g., @drammock's comment) it's probably worth trying a few options to see what tends to work. But instead of using max another option is to use a percentile (other than effectively 100%) to help deal with outliers.
larsoner
on 5 Nov 2019
The current state of #7030 might have found a satisfying value for the scale_factor. Could you maybe try it out on your examples @jasmainak ?
Although it is still a bit hard to see the arrows depending on how you rotate the brain.
This is maybe because the type of glyph is 2D? It's cheap to compute but it doesn't improve the vector information conveyed so much in my opinion especially with many of them. We could experiment with another type of glyph, maybe 3D arrows. What do you think?
GuillaumeFavelier
on 7 Nov 2019
hmmm ... I thought it was 3D? Why are the glyphs 2D? also maybe if you plotted on an inflated brain, it might look better -- why is the default for vector source estimates not an inflated surface?
jasmainak
on 7 Nov 2019
Why are the glyphs 2D?
See @GuillaumeFavelier's comment above, efficiency probably. (Also in my experience the 3D ones can be harder to see depending on how they're plotted.)
why is the default for vector source estimates not an inflated surface?
Imagine for a minute all the vectors happened to be normal to the cortical surface (i.e., landed in perfectly fixed orientation even though you had a loose or free inv). They are normal to the white matter surface. If you plotted these vectors on the inflated surface it would both be conceptually misleading, and probably look pretty strange.
larsoner
on 7 Nov 2019
sorry I had a more basic question -- I guess I should have asked "what are 2D glyphs"? :) if it's 2D, is it on a plane perpendicular to my viewing angle? Because some arrows disappear and appear depending on what angle I am looking from. It's a bit confusing.
I agree that the white matter surface might be better to plot to avoid misinterpretation on but currently I can't see much from the plot.
Also are the arrows scaled according to the magnitude of the stc at the vertex?
jasmainak
on 7 Nov 2019
The 2D glyphs indeed belong to a plan, this small animation hopefully demonstrates what I couldn't explain by 2D glyphs (made with PyVista):
Also are the arrows scaled according to the magnitude of the stc at the vertex?
Looking at the code of PySurfer, the function _add_vector_data which uses Mayavi to plot the glyphs uses the option scalars=vector_values. So for short, the answer is yes, the arrows are scaled by the magnitude (you can look here if you want more details), #7030 just tries to find a satisfying value for the length of the maximum glyph.
GuillaumeFavelier
on 8 Nov 2019
@GuillaumeFavelier feel free to try out the 3D version to see if you can get something satisfying. We can have an option for glyph='arrow2d' | 'arrow3d' or so if it ends up looking good
larsoner
on 8 Nov 2019
I opened #7038 to keep track of the progress to fix this issue.
GuillaumeFavelier
on 8 Nov 2019
Related issues
 annesodub
·
3Comments
annesodub
·
3Comments
 kingjr
·
3Comments
kingjr
·
3Comments
 timonmerk
·
5Comments
timonmerk
·
5Comments
 seankmartin
·
4Comments
seankmartin
·
4Comments
 mirgee
·
3Comments
mirgee
·
3Comments
Most helpful comment
@GuillaumeFavelier feel free to try out the 3D version to see if you can get something satisfying. We can have an option for
glyph='arrow2d' | 'arrow3d'or so if it ends up looking good