Mne-python: BUG: stc plot color limits
@larsoner 000dac95c0f7a4439ee60fb92f1007fd288f9611 introduced a color limit bug in the stc plot
import numpy as np
from pathlib import Path
from mayavi import mlab
import matplotlib.pyplot as plt

import mne

data_path = Path(mne.datasets.sample.data_path())
fname = data_path / 'MEG' / 'sample' / 'sample_audvis-meg'

# Read stc from file
stc = mne.read_source_estimate(fname, subject='sample')
stc.data[:, :] = np.random.rand(*stc.data.shape) # some positive data


fig_size = (300, 300)
fig = mlab.figure(size=fig_size)

brain = stc.plot(
    hemi='lh',
    views='lat',
    colormap='coolwarm',
    subjects_dir=data_path / 'subjects',
    clim=dict(kind='value', pos_lims=[0, .2, .5]),  # <-------------------- this what breaks
    backend='mayavi',
    figure=fig,
)

img = mlab.screenshot(figure=fig, mode='rgba', antialiased=True)
plt.imshow(img)
before:
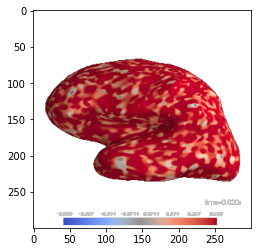
after:

BUG
 kingjr
👀1
All 3 comments
cc @GuillaumeFavelier who probably know intimately the intricate 3d plotting functions
kingjr
on 10 Dec 2020
I can replicate on latest master, @GuillaumeFavelier I can make a quick PR for this since I just dumped https://github.com/mne-tools/mne-python/pull/8335#issuecomment-742531087 on you :)
 larsoner
on 10 Dec 2020
larsoner
on 10 Dec 2020
😄1
👍1
Nice catch, as I was just encountering this bug.
 NeuroLaunch
on 14 Dec 2020
NeuroLaunch
on 14 Dec 2020
Was this page helpful?
0 / 5 - 0 ratings
Related issues
kingjr
·
35Comments
 cbrnr
·
34Comments
cbrnr
·
34Comments
 mmagnuski
·
43Comments
mmagnuski
·
43Comments
 rob-luke
·
51Comments
kingjr
·
66Comments
rob-luke
·
51Comments
kingjr
·
66Comments
Most helpful comment
I can replicate on latest
master, @GuillaumeFavelier I can make a quick PR for this since I just dumped https://github.com/mne-tools/mne-python/pull/8335#issuecomment-742531087 on you :)