microk8s crashes with "FAIL: Service snap.microk8s.daemon-apiserver is not running"
Hello,
I have installed microk8s 3 node cluster, all works great for a a couple of days but then it crashes for no evident reason to apiserver FAILed.
Below is microk8s inspect output and attached tarball
inspection-report-20200925_103006.tar.gz
Inspecting Certificates
Inspecting services
  Service snap.microk8s.daemon-cluster-agent is running
  Service snap.microk8s.daemon-containerd is running
 **FAIL:  Service snap.microk8s.daemon-apiserver is not running**
For more details look at: sudo journalctl -u snap.microk8s.daemon-apiserver
  Service snap.microk8s.daemon-apiserver-kicker is running
  Service snap.microk8s.daemon-control-plane-kicker is running
  Service snap.microk8s.daemon-proxy is running
  Service snap.microk8s.daemon-kubelet is running
  Service snap.microk8s.daemon-scheduler is running
  Service snap.microk8s.daemon-controller-manager is running
  Copy service arguments to the final report tarball
Inspecting AppArmor configuration
Gathering system information
  Copy processes list to the final report tarball
  Copy snap list to the final report tarball
  Copy VM name (or none) to the final report tarball
  Copy disk usage information to the final report tarball
  Copy memory usage information to the final report tarball
  Copy server uptime to the final report tarball
  Copy current linux distribution to the final report tarball
  Copy openSSL information to the final report tarball
  Copy network configuration to the final report tarball
Inspecting kubernetes cluster
  Inspect kubernetes cluster

Building the report tarball
  Report tarball is at /var/snap/microk8s/1719/inspection-report-20200925_103006.tar.gz
This is not first time it has happened. My attempt to deploy a small prod cluster based on microk8s is hindered because of this problem in test environment
 raohammad
All 125 comments
@raohammad Thank you for reporting this.
May i know if all nodes' kube-apiserver crashed? Or just one of the node?
Thanks!
 balchua
on 26 Sep 2020
balchua
on 26 Sep 2020
Same problem here, I investigated a bit, by running sudo /usr/bin/snap run microk8s.daemon-apiserver manually. here is the output:
Flag --insecure-port has been deprecated, This flag will be removed in a future version.
I0926 17:47:00.424759 2403934 server.go:647] external host was not specified, using 192.168.1.28
W0926 17:47:00.424979 2403934 authentication.go:484] AnonymousAuth is not allowed with the AlwaysAllow authorizer. Resetting AnonymousAuth to false. You should use a different authorizer
Segmentation fault (core dumped)
So, api-server is segfaulting. That is very annoying as the binary is striped and I can't get a golang stacktrace.
@raohammad please run that command, maybe you have the same problem
 KeepMasterBranch
on 26 Sep 2020
KeepMasterBranch
on 26 Sep 2020
@bclermont are you running multiple nodes?
Thanks!
balchua
on 26 Sep 2020
are you running multiple nodes?
yes, 2, but I stop the non-master node to test and it still happens
KeepMasterBranch
on 26 Sep 2020
I'm building k8s 1.19.2 API server from source to get the stack trace
KeepMasterBranch
on 26 Sep 2020
Thanks @bclermont do you mind uploading the inspect tarball on the failing node? All nodes from 1.19 will have the api server.
Cc @ktsakalozos @freeekanayaka
Any other information you guys would need from the users?
Thanks.
balchua
on 26 Sep 2020
I'm building k8s 1.19.2 API server from source to get the stack trace
I just tried using stock k8s, but it look like it's different than the one shipped with microk8s :(
do you mind uploading the inspect tarball on the failing node
there is a lot of info there that I rather not expose. is there anything in that tarball you need more than other?
KeepMasterBranch
on 26 Sep 2020
I just realized something, snap upgraded microk8s from 1667 to 1710 imediately before the the problem appeared.
As I can't get a binary with the debug symbol for now, trying to downgrade...
KeepMasterBranch
on 26 Sep 2020
@raohammad Thank you for reporting this.
May i know if all nodes' kube-apiserver crashed? Or just one of the node?
Thanks!
Out of three nodes, on two its 'FAIL' and on one its runnig. Please let me know if inspect tarball would be of interest from other nodes.
raohammad
on 26 Sep 2020
@bclermont MicroK8s embeds dqlite into the apiserver in order to achieve HA without etcd. That's the only difference from upstream.
If you are using a long lasting cluster, we recommend sticking to a more specific kubernetes version channel. Ex 1.18/stable
Moving from one minor kubernetes version or channel usually introduces breaking changes.
balchua
on 26 Sep 2020
Thanks @bclermont do you mind uploading the inspect tarball on the failing node? All nodes from 1.19 will have the api server.
Cc @ktsakalozos @freeekanayaka
Any other information you guys would need from the users?
Thanks.
I think it'd be useful to build libdqlite and libraft by passing --debug to ./configure, as discussed with @ktsakalozos. That might provide a bit more info about the crash.
 freeekanayaka
on 26 Sep 2020
freeekanayaka
on 26 Sep 2020
+1 on this issue, unable to turn up the apiserver with segmentation fault.
 shadowmodder
on 26 Sep 2020
shadowmodder
on 26 Sep 2020
unable to turn up the apiserver with segmentation fault.
@shadowmodder you should try to downgrade to previous release
I think it'd be useful to build libdqlite and libraft by passing --debug to ./configure, as discussed with @ktsakalozos. That might provide a bit more info about the crash.
I needed to bring back ASAP that cluster, so I followed @balchua advice and reinstall the cluster with 1.18/stable
KeepMasterBranch
on 27 Sep 2020
@bclermont you can use 1.19 multi node by disabling ha-cluster. Using the command microk8s disable ha-cluster before joining the nodes. This will behave like 1.18, where etcd and flannel is used instead of dqlite and calico, ofcourse minus the high availability.
balchua
on 27 Sep 2020
@balchua well, it's too late, I already downgraded to 1.18. I just meant that I can't run a debug enabled version of the binary anymore.
KeepMasterBranch
on 27 Sep 2020
@bclermont you can use 1.19 multi node by disabling ha-cluster. Using the command
microk8s disable ha-clusterbefore joining the nodes. This will behave like 1.18, where etcd and flannel is used instead of dqlite and calico, ofcourse minus the high availability.
@balchua
node1:~$ microk8s disable ha-cluster
Addon ha-cluster is already disabled.
ubuntu@node1:~$ microk8s stop
Stopped.
ubuntu@node1:~$ microk8s start
Started.
ubuntu@node1:~$ microk8s status
microk8s is not running. Use microk8s inspect for a deeper inspection.
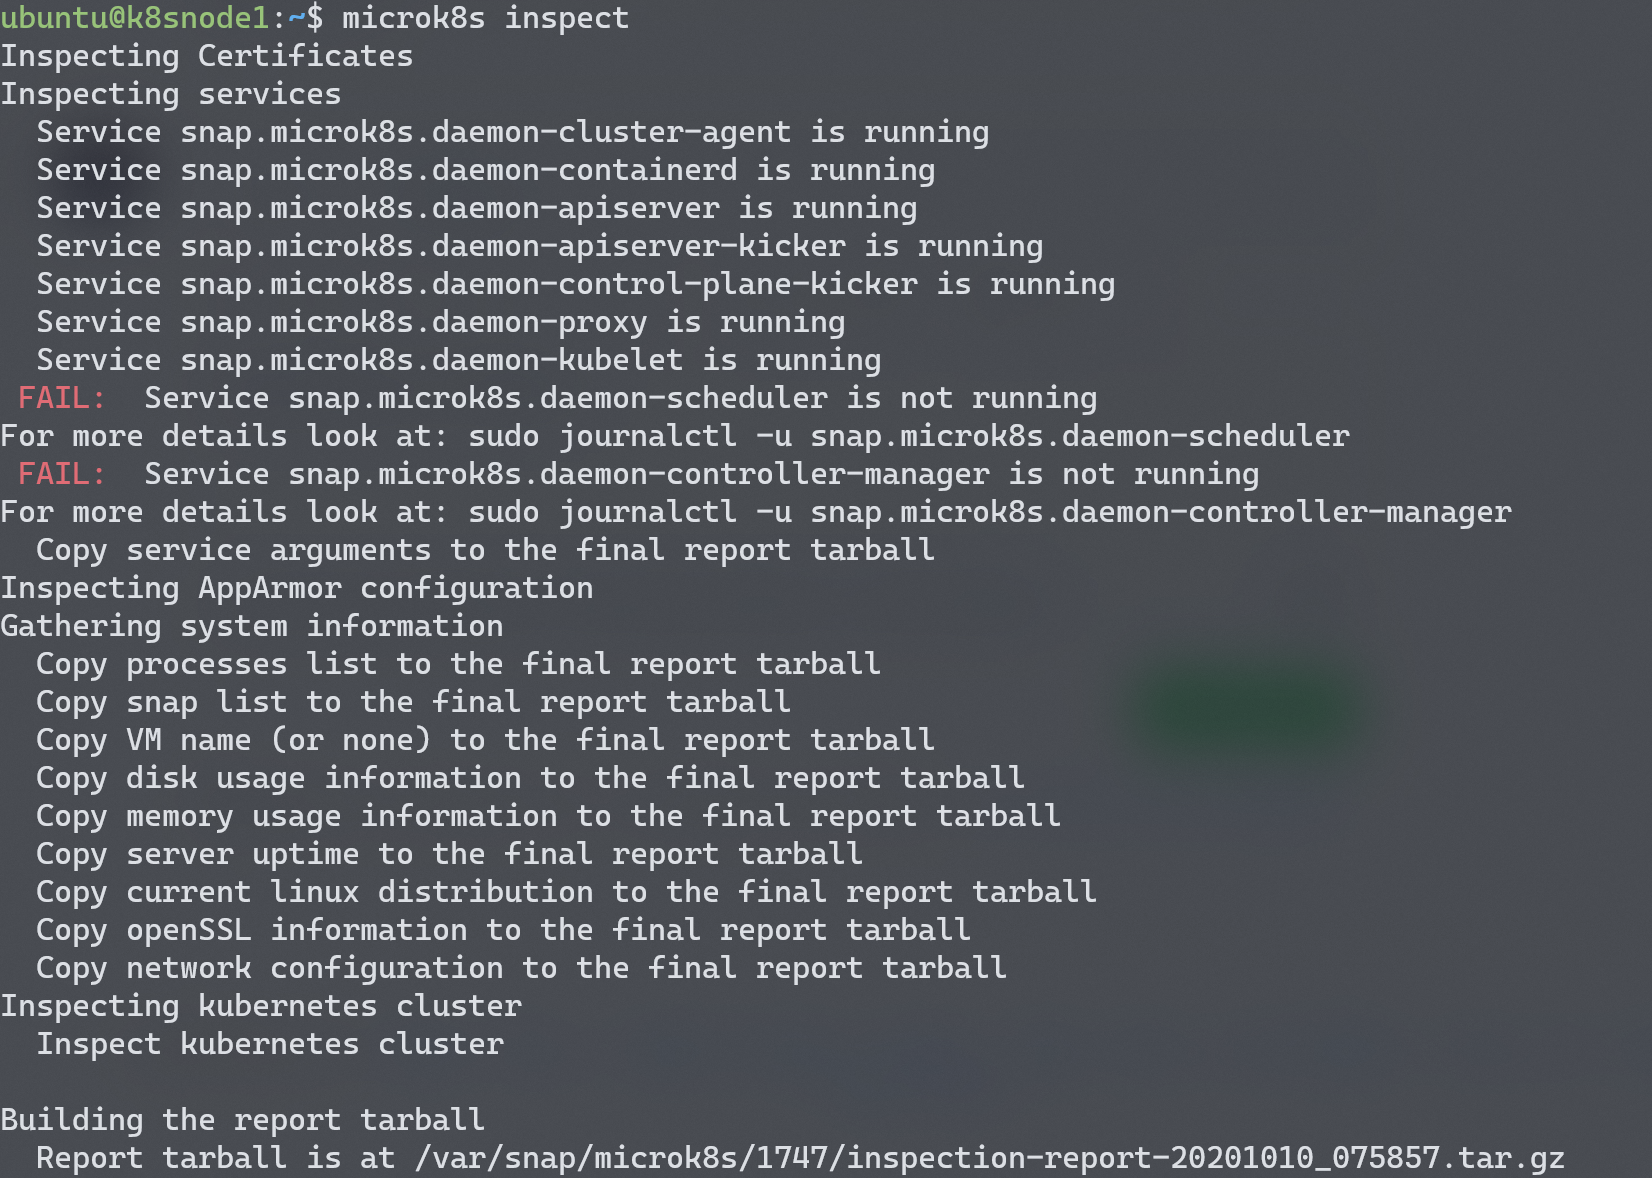
ubuntu@node1:~$ microk8s inspect
Inspecting Certificates
Inspecting services
Service snap.microk8s.daemon-cluster-agent is running
Service snap.microk8s.daemon-containerd is running
FAIL: Service snap.microk8s.daemon-apiserver is not running
For more details look at: sudo journalctl -u snap.microk8s.daemon-apiserver
Service snap.microk8s.daemon-apiserver-kicker is running
Service snap.microk8s.daemon-control-plane-kicker is running
Service snap.microk8s.daemon-proxy is running
Service snap.microk8s.daemon-kubelet is running
Service snap.microk8s.daemon-scheduler is running
Service snap.microk8s.daemon-controller-manager is running
Copy service arguments to the final report tarball
Inspecting AppArmor configuration
Gathering system information
Copy processes list to the final report tarball
Copy snap list to the final report tarball
Copy VM name (or none) to the final report tarball
Copy disk usage information to the final report tarball
Copy memory usage information to the final report tarball
Copy server uptime to the final report tarball
Copy current linux distribution to the final report tarball
Copy openSSL information to the final report tarball
Copy network configuration to the final report tarball
Inspecting kubernetes cluster
Inspect kubernetes cluster
Building the report tarball
Report tarball is at /var/snap/microk8s/1719/inspection-report-20200927_095354.tar.gz
@raohammad im sorry about this one. The apiserver is still failing.
balchua
on 27 Sep 2020
@raohammad, @bclermont, @VaticanUK we are actively working on the issue. Here is a summary of what we have done so far.
- Improvements and fixes in dqlite consistency
[1] https://github.com/canonical/dqlite/pull/269
[2] https://github.com/canonical/dqlite/pull/270 - Enable debug logging to libraft and libdqlite
[3] https://github.com/ubuntu/microk8s/pull/1600 - Recovery documentation of a failing node in a cluster. This is more of a mitigation.
[4] https://discuss.kubernetes.io/t/recovery-of-ha-microk8s-clusters/12931
Thank you @balchua, @freeekanayaka, @devec0 for your efforts.
The above fixes/enhancements are available from the latest/edge and 1.19/edge channels. Any feedback you could give us on those channels would be much appreciated.
 ktsakalozos
on 28 Sep 2020
ktsakalozos
on 28 Sep 2020
Updated to latest/edge and will monitor. The refresh went well. My cluster had fallen apart again over the weekend on 1724, I've now refreshed all nodes to 1730 and will be sure to provide any feedback here and on #1578 - thanks again @freeekanayaka and @ktsakalozos for all of your hard work on this, dqlite is a great alternative to etcd (especially on smaller systems) and I can see the stability of the technology growing before my eyes :)
 devec0
on 28 Sep 2020
devec0
on 28 Sep 2020
Looking good so far!

Thanks all, i'll update with any further issues if they happen!
 VaticanUK
on 28 Sep 2020
VaticanUK
on 28 Sep 2020
inspection-report-20200928_185745.tar.gz
I've got a 4 node cluster that was running 1710 revision that has triggered this on 2 of the nodes. I've attached an inspection report.
I've tried to refresh to 1.19/edge, which fails with the following.
# snap refresh microk8s --channel=1.19/edge
error: cannot perform the following tasks:
- Run configure hook of "microk8s" snap if present (run hook "configure":
-----
++ date +%s
+ start_timer=1601322854
+ timeout=120
+ KUBECTL='/snap/microk8s/1732/kubectl --kubeconfig=/var/snap/microk8s/1732/credentials/client.config'
+ sleep 5
++ date +%s
+ now=1601322866
+ [[ 1601322866 > 1601322974 ]]
+ sleep 5
++ date +%s
+ now=1601322871
+ [[ 1601322871 > 1601322974 ]]
+ sleep 5
++ date +%s
+ now=1601322876
+ [[ 1601322876 > 1601322974 ]]
+ sleep 5
++ date +%s
+ now=1601322881
+ [[ 1601322881 > 1601322974 ]]
+ sleep 5
++ date +%s
+ now=1601322886
+ [[ 1601322886 > 1601322974 ]]
+ sleep 5
++ date +%s
+ now=1601322892
+ [[ 1601322892 > 1601322974 ]]
+ sleep 5
++ date +%s
+ now=1601322897
+ [[ 1601322897 > 1601322974 ]]
+ sleep 5
++ date +%s
+ now=1601322902
+ [[ 1601322902 > 1601322974 ]]
+ sleep 5
++ date +%s
+ now=1601322907
+ [[ 1601322907 > 1601322974 ]]
+ sleep 5
++ date +%s
+ now=1601322912
+ [[ 1601322912 > 1601322974 ]]
+ sleep 5
++ date +%s
+ now=1601322917
+ [[ 1601322917 > 1601322974 ]]
+ sleep 5
++ date +%s
+ now=1601322922
+ [[ 1601322922 > 1601322974 ]]
+ sleep 5
++ date +%s
+ now=1601322927
+ [[ 1601322927 > 1601322974 ]]
+ sleep 5
++ date +%s
+ now=1601322932
+ [[ 1601322932 > 1601322974 ]]
+ sleep 5
++ date +%s
+ now=1601322937
+ [[ 1601322937 > 1601322974 ]]
+ sleep 5
++ date +%s
+ now=1601322943
+ [[ 1601322943 > 1601322974 ]]
+ sleep 5
++ date +%s
+ now=1601322948
+ [[ 1601322948 > 1601322974 ]]
+ sleep 5
++ date +%s
+ now=1601322953
+ [[ 1601322953 > 1601322974 ]]
+ sleep 5
++ date +%s
+ now=1601322958
+ [[ 1601322958 > 1601322974 ]]
+ sleep 5
++ date +%s
+ now=1601322963
+ [[ 1601322963 > 1601322974 ]]
+ sleep 5
++ date +%s
+ now=1601322968
+ [[ 1601322968 > 1601322974 ]]
+ sleep 5
++ date +%s
+ now=1601322973
+ [[ 1601322973 > 1601322974 ]]
+ sleep 5
++ date +%s
+ now=1601322978
+ [[ 1601322978 > 1601322974 ]]
+ break
+ /snap/microk8s/1732/kubectl --kubeconfig=/var/snap/microk8s/1732/credentials/client.config apply -f /var/snap/microk8s/1732/args/cni-network/cni.yaml
The connection to the server 127.0.0.1:16443 was refused - did you specify the right host or port?
-----)
I'm considering kicking the nodes out of the cluster and re-joining at this point, but I'd like to see if there's anything else I can do while I'm in this state. Maybe I'll try to get one node re-joined and leave the other broken for further troubleshooting.
 chris-sanders
on 28 Sep 2020
chris-sanders
on 28 Sep 2020
You might want to check out your dqlite data first, and see if you can restore it to a running state before refreshing. In the past I've also found you can't jump too many revisions forward without triggering that behaviour. When I originally switched from 1.19 to latest, I had to re-bootstrap after a microk8s reset, but that was also before I worked out how to fix up the dqlite data in #1578 - so you could give the linked docs a try, including some of @freeekanayaka's advice as well, and see if that gets your cluster running again before trying to refresh. IIRC, 16443 is the apiserver port and won't come up until the datastore (dqlite in our case) is running.
devec0
on 28 Sep 2020
So far I have:
- Removed a suspiciously small file from /backend: no change
- Removed the whole backend folder and replaced with contents from a node that's healthy: no change
- Tried a snap refresh to 1.19/edge: Same error as above
- Removed mount points for rbd volues that remained: No change, but this allowed me to reschedule pods on another node (after a force delete of the pod)
- I removed all of the data except the cert.* files from the /backend folder and tried to refresh which hangs with a similar error as before
At this point inspect is not reporting the api server is down, however I'm still on the 1710 revision, and the node doesn't actually come online.
I have a copy of the bad /backend folder, but I've kind of run out of ideas at this point. If there's more I can do point me in the right direction. I'm willing to leave this node down/out for a little while to see if we can trace down what's going on.
chris-sanders
on 29 Sep 2020
It was pointed out that I didn't stop the 'good' node before making the backend backup. I repeated the backend backup after draining the node. I also added -v 50 (larger is more verbose?) to the api-server args.
After the restore, microk8s status still isn't happy, and I now get more logging. Here's the microk8s.daemon-apiserver log. https://pastebin.ubuntu.com/p/Zf3xSKk359/
That seems to be repeating and I expect it will eventually just stop retrying and fail.
chris-sanders
on 29 Sep 2020
@raohammad, @bclermont, @VaticanUK we are actively working on the issue. Here is a summary of what we have done so far.
- Improvements and fixes in dqlite consistency
[1] [canonical/dqlite#269](https://github.com/canonical/dqlite/pull/269)
[2] [canonical/dqlite#270](https://github.com/canonical/dqlite/pull/270)- Enable debug logging to libraft and libdqlite
[3] #1600- Recovery documentation of a failing node in a cluster. This is more of a mitigation.
[4] https://discuss.kubernetes.io/t/recovery-of-ha-microk8s-clusters/12931Thank you @balchua, @freeekanayaka, @devec0 for your efforts.
The above fixes/enhancements are available from the
latest/edgeand1.19/edgechannels. Any feedback you could give us on those channels would be much appreciated.
I have upgrade the cluster with latest/edge v1.19.2-34+340f0ec18a2657 so far so good. Normally it would happen in 2 to 3 days. Hopefully we can be certain by end of this week
raohammad
on 29 Sep 2020
I'm not sure there's much more I'm getting out of the node I have crashing right now. I'm going to proceed to wipe it and re-add it to the cluster. I'll roll the cluster and move to /edge to see if I get a reproducer. I got it on 2 nodes at the same time but didn't see this for ~20 days so I'm fairly sure it's due to an unplanned power outage and hard reboot, although the machine is running on a NVME with guaranteed write protection and only K8s seems to have noticed.
chris-sanders
on 29 Sep 2020
I just had a node break and go unavailable again, but it came back up.
I noticed it went down so I drained it to try and get my pods to reschedule on a different node, but then as soon as it was drained it came back to ready, so I uncordened it and it's all happy again!
logs etc attached:
inspection-report-20200930_200024.tar.gz
VaticanUK
on 30 Sep 2020
Same issues and steps as Chris. But as VaticanUK has done, I was able to drain the offending node and re-join it with success (so far). The node was up for about 13 days, and may have become an issue when the host went down for maintenance. This is one node in a four-node cluster on v1.19.2-34+1b3fa60b402c1c.
 mfpnca
on 2 Oct 2020
mfpnca
on 2 Oct 2020
In case you follow the latest/edge channel you may observe service restarts as a result of code changes in the master branch of this repository (reflected in snap refreshes). These restarts should not take longer than a few minutes. If a node does not recover from such a restart we will need to look into it. Also, if you believe that these restarts affect the "experiment" we conduct here, I can create a channel branch we could follow.
ktsakalozos
on 2 Oct 2020
@ktsakalozos that could be it in my case, but i only noticed it on one node? Maybe it happened on the other nodes when I wasn't watching?
VaticanUK
on 2 Oct 2020
it is probably good practice, especially for systems which need to be more reliable, to modify the snap automatic refresh e.g.:
sudo snap set system refresh.timer=sun,00:00~01:00
 Aaron-Ritter
on 2 Oct 2020
Aaron-Ritter
on 2 Oct 2020
I'll do that now, should at least prevent confusion in the future! :)
VaticanUK
on 2 Oct 2020
This evening I noticed that my cluster is totally unreachable by the k8s API. Logged into my first node and ran microk8s status. The response took quite a long time and came back:
microk8s is not running. Use microk8s inspect for a deeper inspection.
microk8s inspect took an absolute age to complete. Nothing obviously wrong with the output to console (though status would suggest otherwise!) and the tarball is attached:
inspection-report-20201003_213248.tar.gz
microk8s inspect for my 4th node (hot backup, but never seems to have been brought in to play...) completed fairly quickly:
inspection-report-20201003_215022.tar.gz
the inspect command on my other two nodes is still running (it must have been running for about 30 mins now...)
One very odd thing which I did notice, ssh'ing into my nodes caused a ssh host key validation failure for all 4 nodes. I'm _fairly_ certain that I've ssh'd into them from the laptop i'm using to write this since I set up them up, but I can't think of any reason why the host key on all 4 nodes would have changed? Could be totally unrelated, but figured it may be worth mentioning.
Also worth mentioning that although kubectl can't talk to the cluster, and I can't access some services, some other services do still seem to be running - I have mosquitto running on there and node-red, and although I can't access mosquitto, some of my node-red flows which act upon topics in mosquitto seem to be running correctly...
I'll comment again later (or tomorrow!) with the logs from the other two nodes
VaticanUK
on 4 Oct 2020
Here is the tarball from my second name - looks like it took about 2.5 hours to complete:
inspection-report-20201004_004907.tar.gz
the command still hasn't completed on my third node so i've kicked it off again
VaticanUK
on 4 Oct 2020
Thanks @VaticanUK for providing valuable info , i did a quick check on this inspection-report-20201003_215022.tar.gz, i noticed that it doesn't have the same specs as the other 2. The memory seems to be around 1G.
While the last one inspection-report-20201004_004907.tar.gz available memory is almost used up.
It could be just the effects of whats happenning.
balchua
on 4 Oct 2020
hmm memory usage is quite high on some nodes:
1:

2:

3:

4:

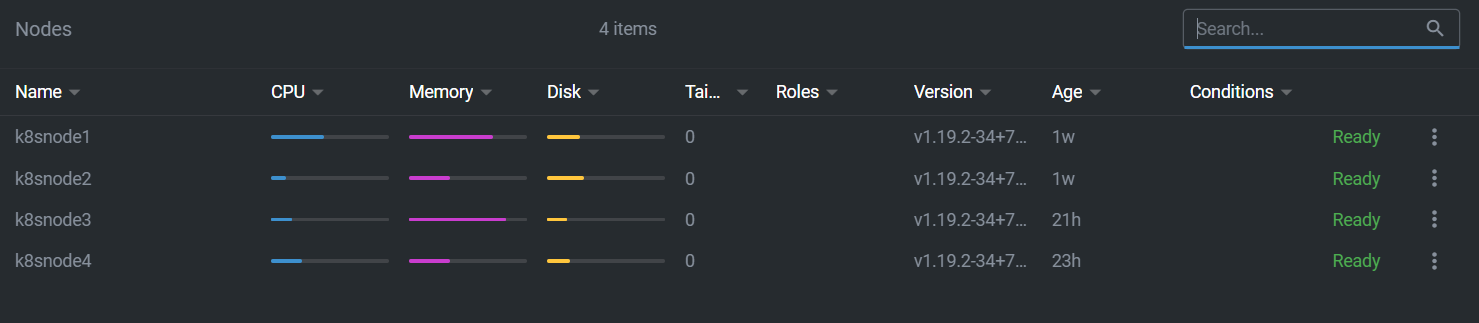
and yes, i have 2 nodes with 4GB, plus 1 node and my hot backup have 2GB. I thought K8s could handle this and would take memory pressure into account when scheduling pods?
Given at least one of the nodes (node 2) memory usage is only around 50%, if there was an issue with memory usage on node 1 which would cause problems with it being the master, I would expect the HA aspect to move master to node 2? Is that not the case? Does the node have to be totally offline for this to happen?
VaticanUK
on 4 Oct 2020
I don't know if the HA control plane components are cpu or memory aware and smart enough to take decisions which one will be made part of the voting nodes.
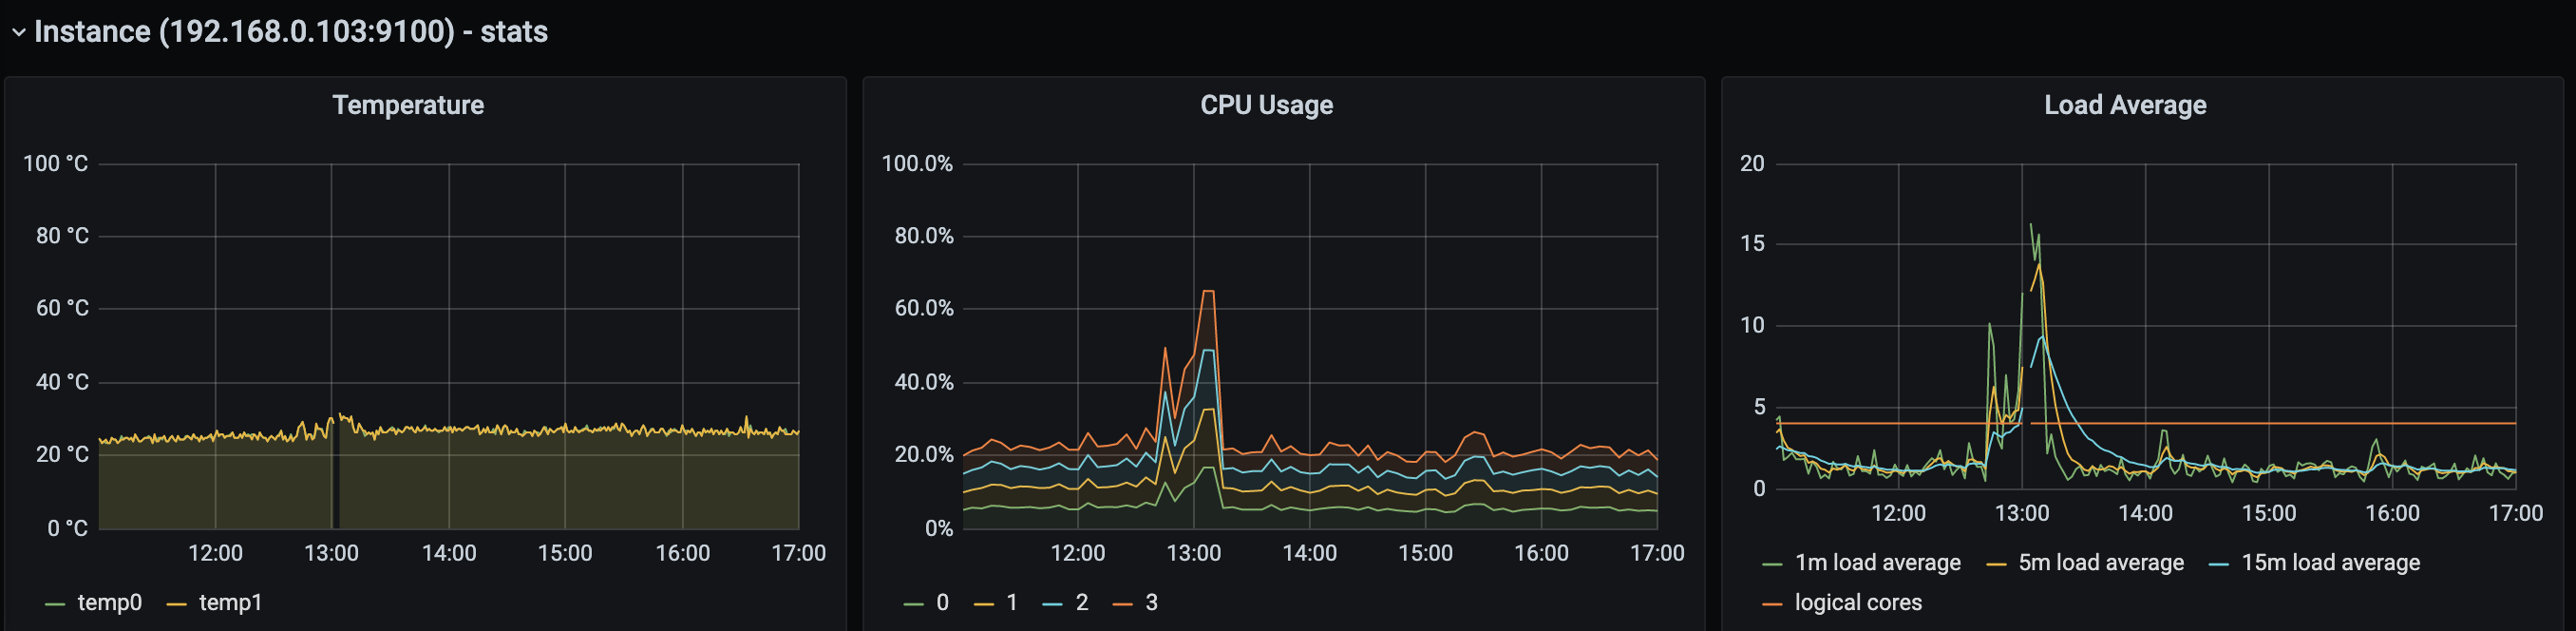
Looking at the screenshot you provided, the load average of node 1 and 3 is extremely high too. Do you know which process is using up most of the cpu and memory?
Thanks again!
balchua
on 4 Oct 2020
node1 - seems to be kube-apiserver for both :

node2 - the same:

node3 - memory is kube-apiserver, cpu is kubelet:

I won't bother posting node4 since it's not really doing anything (being a hot backup)
VaticanUK
on 4 Oct 2020
To update a bit further on this, I rebooted nodes 1 and 2 (which took far longer than I expected!) and when they both came back up everything came back up fine
VaticanUK
on 5 Oct 2020
@VaticanUK @freeekanayaka node 4 seems to be failing to start its apiserver and dqlite with an error in starting raft:
Oct 02 11:29:54 k8snode4 microk8s.daemon-apiserver[3603097]: W1002 11:29:54.429640 3603097 authentication.go:484] AnonymousAuth is not allowed with the AlwaysAllow authorizer. Resetting AnonymousAuth to false. You should use a different authorizer
Oct 02 11:29:54 k8snode4 microk8s.daemon-apiserver[3603097]: Error: start node: raft_start(): io: load closed segment 0000000000003726-0000000000003822: found 96 entries (expected 97)
Oct 02 11:29:54 k8snode4 systemd[1]: snap.microk8s.daemon-apiserver.service: Main process exited, code=exited, status=1/FAILURE
@freeekanayaka is there a a way to fix this (eg drop some of the corrupted segments) or should we do a reinstall of that node (microk8s leave and microk8s remove node)?
ktsakalozos
on 5 Oct 2020
@VaticanUK @freeekanayaka node 4 seems to be failing to start its apiserver and dqlite with an error in starting raft:
Oct 02 11:29:54 k8snode4 microk8s.daemon-apiserver[3603097]: W1002 11:29:54.429640 3603097 authentication.go:484] AnonymousAuth is not allowed with the AlwaysAllow authorizer. Resetting AnonymousAuth to false. You should use a different authorizer
Oct 02 11:29:54 k8snode4 microk8s.daemon-apiserver[3603097]: Error: start node: raft_start(): io: load closed segment 0000000000003726-0000000000003822: found 96 entries (expected 97)
Oct 02 11:29:54 k8snode4 systemd[1]: snap.microk8s.daemon-apiserver.service: Main process exited, code=exited, status=1/FAILURE
@freeekanayaka is there a a way to fix this (eg drop some of the corrupted segments) or should we do a reinstall of that node (microk8s leave and microk8s remove node)?
Yes, for this particular bug, you should be able to fix it by deleting the offended segment file 0000000000003726-0000000000003822 and all the ones that follow (i.e. the ones that have greater numbers).
freeekanayaka
on 5 Oct 2020
thanks @freeekanayaka - where do I find those files please?
VaticanUK
on 5 Oct 2020
nm, found them :)
VaticanUK
on 5 Oct 2020
Should be /var/snap/microk8s/current/var/kubernetes/backend for reference.
freeekanayaka
on 5 Oct 2020
That work thanks @freeekanayaka - left me with nodes 1, 2 and 4 working (node 3 hasn't been ready since the problems I had over the weekend).
So this afternoon I tried getting node 3 back up.
First I removed it from the cluster, then added it again, and it stayed unhappy. Next I removed it from the cluster, uninstalled microk8s, cleared down journalctl to make it easier to see issues, installed microk8s and added back to the cluster.
That seemed to work, but then the apiserver and kubectl started taking a _long_ time to respond to anything, node 3 never came ready, node 4 became non-ready.
So I kicked off microk8s inspect on each node.
Inspect took a while on node 1 (below), but a few hours later it's not yet completed on any other node.
node 1 - inspection-report-20201005_141401.tar.gz
At some point during the time inspect was running on node 1, node 1 totally stopped responding via the API and kubectl (which I _think_ uses the API anyway?), so I kicked off another inspect in case the first one missed that last bit:
node 1 - inspection-report-20201005_142630.tar.gz
My guess is that if I reboot the nodes, they'll (mostly!) come back up fine, but I'll wait until inspect has finished on all 4 nodes so that I can upload them here (just in case there is something useful there!)
VaticanUK
on 5 Oct 2020
inspect has finished on nodes 2 and 3, but 4 is still going...
node 2 - inspection-report-20201005_170456.tar.gz
node 3 - inspection-report-20201005_162436.tar.gz
VaticanUK
on 6 Oct 2020
Rebooted the nodes, they _didn't_ come back up.
microk8s status said microk8s wasnt' running
microk8s inspect said everything looked fine
looking in the logs there wasn't really anything to see except:
Oct 05 22:12:16 k8snode1 microk8s.daemon-apiserver[2336]: I1005 22:12:16.964595    2336 server.go:647] external host was not specified, using 192.168.8.8
Oct 05 22:13:52 k8snode1 microk8s.daemon-apiserver[2336]: Error: context deadline exceeded
Oct 05 22:13:52 k8snode1 systemd[1]: snap.microk8s.daemon-apiserver.service: Main process exited, code=exited, status=1/FAILURE
Left it overnight, thinking I'd probably need to rebuild it today, but this morning it seems _almost_ happy.
ubuntu@k8snode1:~$ microk8s kubectl get node
NAME       STATUS     ROLES    AGE     VERSION
k8snode4   NotReady   <none>   20h     v1.19.2-34+867242ed63887f
k8snode3   Ready      <none>   18h     v1.19.2-34+a6fde53360a5d7
k8snode1   Ready      <none>   7d17h   v1.19.2-34+a6fde53360a5d7
k8snode2   Ready      <none>   7d17h   v1.19.2-34+a6fde53360a5d7
@VaticanUK the node2 and node3 logs attached above show the apiserver not so healthy. @freeekanayaka there are a few stack traces you may want to look. However what I think is happening is your setup is running out of memory and the OS is killing processes. Would you be interested in adding some swap so the OS can offload unused pages? Normally you do not add swap in k8s nodes because it "confuses" pod scheduling.
ktsakalozos
on 6 Oct 2020
sure, I thought k8s wouldn't work with swap enabled, but maybe it's just not recommended from what you say? Is there anything special I need to do, or just re-enable it?
I'm not so convinced it is running out of memory. I may have previously but after the previous discussion around memory I added resource limits to all of my deployment, with the total maximum being 3.6Gi (so it _should_ fit on either node 1 or 2 on their own, overheads aside!). I haven't added resource limits to the deployments which are created by microk8s but I was keeping an eye on things yesterday the memory usage never looked too high.
This is what it looks like now:

and it never strayed very far from that yesterday. Even when I noticed things were starting to look unhealthy yesterday, the memory usage looked not far off that. You could still be right though so happy to try and investigate that possibility further :)
VaticanUK
on 6 Oct 2020
thinking further, it's also interesting to note that things started going screwy yesterday when I was trying to get node3 back in the cluster. I'm going to try and get node4 happy again later so I'll see if something similar happens when I do that
VaticanUK
on 6 Oct 2020
The symptoms I have seen are from leaving the cluster running for 2 + days(no reboots or OS updates/upgrades)
Thanks @bclermont I already tore down my setup, Currently, I am running 1.19 latest on a single node seems to work well when I don't add nodes. I didn't want to downgrade because I am exploring ambassador and other addons in 1.19
last I traced this down to Journalctl on the apiserver service where there was a signal to terminate and fast 5 attempts to restart which failed with the same error.
I tried : swap off swap on, restarting services, setting permissions on snap packages
My hunch was that one of the addons was causing it (I was using dns dashboard rbac ingress storage ha) so I disabled all and retained dns, ingress and storage on the single node I have now that is working with same 1.19 latest release, hope that helps
I wrote a bash script to up service, add nodes, install addons and deployments and restore for pgsql i am running. if anyone interested.
shadowmodder
on 6 Oct 2020
Here is the syslog from one of the nodes that was in the failed setup (Tuesday is my hostname and username):
Oct 6 08:57:23 tuesday microk8s.daemon-containerd[81301]: time="2020-10-06T08:57:23.419511640Z" level=error msg="Failed to load cni configuration" error="cni config load failed: no network config found in /etc/cni/net.d: cni plugin not initialized: failed to load cni config"
Oct 6 08:57:23 tuesday microk8s.daemon-kubelet[81329]: E1006 08:57:23.419616 81329 kubelet.go:2190] Container runtime network not ready: NetworkReady=false reason:NetworkPluginNotReady message:Network plugin returns error: cni plugin not initialized
Oct 6 08:57:23 tuesday microk8s.daemon-kubelet[81329]: E1006 08:57:23.479633 81329 kubelet.go:2270] node "tuesday" not found
Oct 6 08:57:23 tuesday microk8s.daemon-kubelet[81329]: E1006 08:57:23.579958 81329 kubelet.go:2270] node "tuesday" not found
Oct 6 08:57:23 tuesday microk8s.daemon-kubelet[81329]: E1006 08:57:23.680297 81329 kubelet.go:2270] node "tuesday" not found
Oct 6 08:57:23 tuesday microk8s.daemon-kubelet[81329]: E1006 08:57:23.780605 81329 kubelet.go:2270] node "tuesday" not found
Oct 6 08:57:23 tuesday microk8s.daemon-kubelet[81329]: E1006 08:57:23.881062 81329 kubelet.go:2270] node "tuesday" not found
Oct 6 08:57:23 tuesday microk8s.daemon-kubelet[81329]: E1006 08:57:23.981405 81329 kubelet.go:2270] node "tuesday" not found
Oct 6 08:57:24 tuesday microk8s.daemon-kubelet[81329]: E1006 08:57:24.081711 81329 kubelet.go:2270] node "tuesday" not found
Oct 6 08:57:24 tuesday microk8s.daemon-kubelet[81329]: E1006 08:57:24.182158 81329 kubelet.go:2270] node "tuesday" not found
Oct 6 08:57:24 tuesday microk8s.daemon-kubelet[81329]: E1006 08:57:24.282455 81329 kubelet.go:2270] node "tuesday" not found
Oct 6 08:57:24 tuesday microk8s.daemon-kubelet[81329]: I1006 08:57:24.381812 81329 kubelet_node_status.go:294] Setting node annotation to enable volume controller attach/detach
Oct 6 08:57:24 tuesday microk8s.daemon-kubelet[81329]: E1006 08:57:24.382711 81329 kubelet.go:2270] node "tuesday" not found
Oct 6 08:57:24 tuesday microk8s.daemon-kubelet[81329]: I1006 08:57:24.417513 81329 kubelet_node_status.go:70] Attempting to register node tuesday
Oct 6 08:57:24 tuesday microk8s.daemon-kubelet[81329]: E1006 08:57:24.417901 81329 kubelet_node_status.go:92] Unable to register node "tuesday" with API server: Post https://127.0.0.1:16443/api/v1/nodes: dial tcp 127.0.0.1:16443: connect: connection refused
Oct 6 08:57:24 tuesday microk8s.daemon-kubelet[81329]: E1006 08:57:24.483049 81329 kubelet.go:2270] node "tuesday" not found
Oct 6 08:57:24 tuesday microk8s.daemon-controller-manager[81217]: E1006 08:57:24.532553 81217 leaderelection.go:320] error retrieving resource lock kube-system/kube-controller-manager: Get https://127.0.0.1:16443/api/v1/namespaces/kube-system/endpoints/kube-controller-manager?timeout=10s: dial tcp 127.0.0.1:16443: connect: connection refused
Oct 6 08:57:24 tuesday microk8s.daemon-kubelet[81329]: E1006 08:57:24.583338 81329 kubelet.go:2270] node "tuesday" not found
Oct 6 08:57:24 tuesday microk8s.daemon-kubelet[81329]: E1006 08:57:24.683691 81329 kubelet.go:2270] node "tuesday" not found
Oct 6 08:57:24 tuesday microk8s.daemon-kubelet[81329]: E1006 08:57:24.784015 81329 kubelet.go:2270] node "tuesday" not found
Oct 6 08:57:24 tuesday microk8s.daemon-kubelet[81329]: E1006 08:57:24.884349 81329 kubelet.go:2270] node "tuesday" not found
Oct 6 08:57:24 tuesday microk8s.daemon-kubelet[81329]: E1006 08:57:24.984671 81329 kubelet.go:2270] node "tuesday" not found
Oct 6 08:57:25 tuesday microk8s.daemon-kubelet[81329]: E1006 08:57:25.084984 81329 kubelet.go:2270] node "tuesday" not found
Oct 6 08:57:25 tuesday microk8s.daemon-kubelet[81329]: E1006 08:57:25.185285 81329 kubelet.go:2270] node "tuesday" not found
Oct 6 08:57:25 tuesday microk8s.daemon-kubelet[81329]: E1006 08:57:25.285751 81329 kubelet.go:2270] node "tuesday" not found
Oct 6 08:57:25 tuesday microk8s.daemon-kubelet[81329]: E1006 08:57:25.386054 81329 kubelet.go:2270] node "tuesday" not found
Oct 6 08:57:25 tuesday microk8s.daemon-kubelet[81329]: E1006 08:57:25.486397 81329 kubelet.go:2270] node "tuesday" not found
Oct 6 08:57:25 tuesday microk8s.daemon-kubelet[81329]: E1006 08:57:25.586733 81329 kubelet.go:2270] node "tuesday" not found
Oct 6 08:57:25 tuesday microk8s.daemon-kubelet[81329]: E1006 08:57:25.687020 81329 kubelet.go:2270] node "tuesday" not found
Oct 6 08:57:25 tuesday microk8s.daemon-kubelet[81329]: E1006 08:57:25.787334 81329 kubelet.go:2270] node "tuesday" not found
Oct 6 08:57:25 tuesday microk8s.daemon-kubelet[81329]: E1006 08:57:25.887688 81329 kubelet.go:2270] node "tuesday" not found
Oct 6 08:57:25 tuesday microk8s.daemon-kubelet[81329]: E1006 08:57:25.894913 81329 reflector.go:178] k8s.io/kubernetes/pkg/kubelet/kubelet.go:517: Failed to list *v1.Service: Get https://127.0.0.1:16443/api/v1/services?limit=500&resourceVersion=0: dial tcp 127.0.0.1:16443: connect: connection refused
shadowmodder
on 6 Oct 2020
@VaticanUK yes, normally you do not have swap and k8s will try to maximize resource utilization on all nodes. However, I would like to remove this potential OOM instability factor so we focus on the DB stability.
Also please refresh to the latest snap revision (sudo snap refresh microk8s --channel=latest/edge) we pushed some more fixes yesterday. Thank you.
ktsakalozos
on 6 Oct 2020
Rather than changing multiple things at once, I'll upgrade today, then turn swap on tomorrow or Thurs (depending on how things go :))
VaticanUK
on 6 Oct 2020
@bclermont is it possible the nodes hostname is "Tuesday" with a capital "T"? Hostnames are normalized when a node is registers so "Tuesday" becomes "tuesday". This becomes a problem when RBAC is enabled.
ktsakalozos
on 6 Oct 2020
atleast not in my case, I made sure everything is lower case - tuesday@tuesday:~$ hostname
tuesday
I also tested with no rbac addon - that dint help.
shadowmodder
on 6 Oct 2020
the latest revision is definitely progress, I think this is the first time I've been in this situation:
VaticanUK
on 6 Oct 2020
Here is the syslog from one of the nodes that was in the failed setup (Tuesday is my hostname and username):
Oct 6 08:57:23 tuesday microk8s.daemon-containerd[81301]: time="2020-10-06T08:57:23.419511640Z" level=error msg="Failed to load cni configuration" error="cni config load failed: no network config found in /etc/cni/net.d: cni plugin not initialized: failed to load cni config"
Oct 6 08:57:23 tuesday microk8s.daemon-kubelet[81329]: E1006 08:57:23.419616 81329 kubelet.go:2190] Container runtime network not ready: NetworkReady=false reason:NetworkPluginNotReady message:Network plugin returns error: cni plugin not initialized
Oct 6 08:57:23 tuesday microk8s.daemon-kubelet[81329]: E1006 08:57:23.479633 81329 kubelet.go:2270] node "tuesday" not found
Oct 6 08:57:23 tuesday microk8s.daemon-kubelet[81329]: E1006 08:57:23.579958 81329 kubelet.go:2270] node "tuesday" not found
Oct 6 08:57:23 tuesday microk8s.daemon-kubelet[81329]: E1006 08:57:23.680297 81329 kubelet.go:2270] node "tuesday" not found
Oct 6 08:57:23 tuesday microk8s.daemon-kubelet[81329]: E1006 08:57:23.780605 81329 kubelet.go:2270] node "tuesday" not found
Oct 6 08:57:23 tuesday microk8s.daemon-kubelet[81329]: E1006 08:57:23.881062 81329 kubelet.go:2270] node "tuesday" not found
Oct 6 08:57:23 tuesday microk8s.daemon-kubelet[81329]: E1006 08:57:23.981405 81329 kubelet.go:2270] node "tuesday" not found
Oct 6 08:57:24 tuesday microk8s.daemon-kubelet[81329]: E1006 08:57:24.081711 81329 kubelet.go:2270] node "tuesday" not found
Oct 6 08:57:24 tuesday microk8s.daemon-kubelet[81329]: E1006 08:57:24.182158 81329 kubelet.go:2270] node "tuesday" not found
Oct 6 08:57:24 tuesday microk8s.daemon-kubelet[81329]: E1006 08:57:24.282455 81329 kubelet.go:2270] node "tuesday" not found
Oct 6 08:57:24 tuesday microk8s.daemon-kubelet[81329]: I1006 08:57:24.381812 81329 kubelet_node_status.go:294] Setting node annotation to enable volume controller attach/detach
Oct 6 08:57:24 tuesday microk8s.daemon-kubelet[81329]: E1006 08:57:24.382711 81329 kubelet.go:2270] node "tuesday" not found
Oct 6 08:57:24 tuesday microk8s.daemon-kubelet[81329]: I1006 08:57:24.417513 81329 kubelet_node_status.go:70] Attempting to register node tuesday
Oct 6 08:57:24 tuesday microk8s.daemon-kubelet[81329]: E1006 08:57:24.417901 81329 kubelet_node_status.go:92] Unable to register node "tuesday" with API server: Post https://127.0.0.1:16443/api/v1/nodes: dial tcp 127.0.0.1:16443: connect: connection refused
Oct 6 08:57:24 tuesday microk8s.daemon-kubelet[81329]: E1006 08:57:24.483049 81329 kubelet.go:2270] node "tuesday" not found
Oct 6 08:57:24 tuesday microk8s.daemon-controller-manager[81217]: E1006 08:57:24.532553 81217 leaderelection.go:320] error retrieving resource lock kube-system/kube-controller-manager: Get https://127.0.0.1:16443/api/v1/namespaces/kube-system/endpoints/kube-controller-manager?timeout=10s: dial tcp 127.0.0.1:16443: connect: connection refused
Oct 6 08:57:24 tuesday microk8s.daemon-kubelet[81329]: E1006 08:57:24.583338 81329 kubelet.go:2270] node "tuesday" not found
Oct 6 08:57:24 tuesday microk8s.daemon-kubelet[81329]: E1006 08:57:24.683691 81329 kubelet.go:2270] node "tuesday" not foundOct 6 08:57:24 tuesday microk8s.daemon-kubelet[81329]: E1006 08:57:24.784015 81329 kubelet.go:2270] node "tuesday" not found
Oct 6 08:57:24 tuesday microk8s.daemon-kubelet[81329]: E1006 08:57:24.884349 81329 kubelet.go:2270] node "tuesday" not found
Oct 6 08:57:24 tuesday microk8s.daemon-kubelet[81329]: E1006 08:57:24.984671 81329 kubelet.go:2270] node "tuesday" not found
Oct 6 08:57:25 tuesday microk8s.daemon-kubelet[81329]: E1006 08:57:25.084984 81329 kubelet.go:2270] node "tuesday" not found
Oct 6 08:57:25 tuesday microk8s.daemon-kubelet[81329]: E1006 08:57:25.185285 81329 kubelet.go:2270] node "tuesday" not found
Oct 6 08:57:25 tuesday microk8s.daemon-kubelet[81329]: E1006 08:57:25.285751 81329 kubelet.go:2270] node "tuesday" not found
Oct 6 08:57:25 tuesday microk8s.daemon-kubelet[81329]: E1006 08:57:25.386054 81329 kubelet.go:2270] node "tuesday" not found
Oct 6 08:57:25 tuesday microk8s.daemon-kubelet[81329]: E1006 08:57:25.486397 81329 kubelet.go:2270] node "tuesday" not found
Oct 6 08:57:25 tuesday microk8s.daemon-kubelet[81329]: E1006 08:57:25.586733 81329 kubelet.go:2270] node "tuesday" not found
Oct 6 08:57:25 tuesday microk8s.daemon-kubelet[81329]: E1006 08:57:25.687020 81329 kubelet.go:2270] node "tuesday" not found
Oct 6 08:57:25 tuesday microk8s.daemon-kubelet[81329]: E1006 08:57:25.787334 81329 kubelet.go:2270] node "tuesday" not found
Oct 6 08:57:25 tuesday microk8s.daemon-kubelet[81329]: E1006 08:57:25.887688 81329 kubelet.go:2270] node "tuesday" not found
Oct 6 08:57:25 tuesday microk8s.daemon-kubelet[81329]: E1006 08:57:25.894913 81329 reflector.go:178] k8s.io/kubernetes/pkg/kubelet/kubelet.go:517: Failed to list *v1.Service: Get https://127.0.0.1:16443/api/v1/services?limit=500&resourceVersion=0: dial tcp 127.0.0.1:16443: connect: connection refused
that looks very familiar
VaticanUK
on 6 Oct 2020
@ktsakalozos @freeekanayaka Hi I am new to microk8s..facing the same issue from morning which mention above i have attached my tarball
microk8s inspect
Inspecting Certificates
Inspecting services
  Service snap.microk8s.daemon-cluster-agent is running
  Service snap.microk8s.daemon-containerd is running
 FAIL:  Service snap.microk8s.daemon-apiserver is not running
For more details look at: sudo journalctl -u snap.microk8s.daemon-apiserver
  Service snap.microk8s.daemon-apiserver-kicker is running
  Service snap.microk8s.daemon-proxy is running
  Service snap.microk8s.daemon-kubelet is running
  Service snap.microk8s.daemon-scheduler is running
  Service snap.microk8s.daemon-controller-manager is running
  Copy service arguments to the final report tarball
Inspecting AppArmor configuration
Gathering system information
  Copy processes list to the final report tarball
  Copy snap list to the final report tarball
  Copy VM name (or none) to the final report tarball
  Copy disk usage information to the final report tarball
  Copy memory usage information to the final report tarball
  Copy server uptime to the final report tarball
  Copy current linux distribution to the final report tarball
  Copy openSSL information to the final report tarball
  Copy network configuration to the final report tarball
Inspecting kubernetes cluster
  Inspect kubernetes cluster

Building the report tarball
  Report tarball is at /var/snap/microk8s/1710/inspection-report-20201006_105830.tar.gz
from master:
ubuntu@ip-xxxx:~/s2Shape_Stacks/engine-2.0$ microk8s kubectl get nodes
The connection to the server 127.0.0.1:16443 was refused - did you specify the right host or port?
from node :
kubectl get node
NAME               STATUS     ROLES    AGE    VERSION
ip-x-x-x-x      NotReady   <none>   11d    v1.19.2-34+1b3fa60b402c1c
ip-x-x-x-x   Ready      <none>   9d     [v1.19.2-34+1b3fa60b402c1c
ip-x-x-x-x    Ready      <none>   5d6h   v1.19.2-34+1b3fa60b402c1c
 rasoolasik
on 6 Oct 2020
rasoolasik
on 6 Oct 2020
@shadowmodder just for your info when you disable ha-cluster you are basically using etcd and flannel and not dqlite and calico. That's fine too. 😊
balchua
on 6 Oct 2020
I lost node 3 last night (one of the 2GB Pi4s). Draining the node, rebooting and then un-cordoning brought it back.
So I then enabled 1GB swap on both of my 2GB nodes.
@ktsakalozos so you think it's worth enabling some swap on all nodes, or just the lower mem ones? Either way I'll report back with any updates
VaticanUK
on 7 Oct 2020
We want to avoid cases where the node runs out of memory and the kernel is forced to kill processes. Adding swap is not recommended, but if the served workloads bring the nodes close to the limit you would better have some swap to handle instability. More information on this is here https://discuss.kubernetes.io/t/swap-off-why-is-it-necessary/6879
ktsakalozos
on 7 Oct 2020
Just read that, and the entire associated issue in the kuberentes repo. Urgh is all I can say!
I've noticed that some of the addons available as part of microk8s do not set requests.memory or limits.memory which could be contributing to the instability (at least on my cluster!) as the scheduler wouldn't be able to work out the best place to schedule pods based on the potential usage of other pods (or I could be going way off base here, so if so please do just tell me - I'm pretty confident with docker but fairly new to k8s so impact of k8s not supporting swap was a big learn for me!)
In particular (of those I have enabled), these do not have them:
- metrics-server deployment
- dashboard-metrics-scraper deployment
- calico-kube-controllers deployment
- kubernetes-dashboard deployment
- nginx-ingress-microk8s-controller daemonset
those that do have them are:
- coredns deployment (partially - seems to have requests.memory but no limits.memory)
- metallb controller deployment
- calico-node daemonset (partially - seems to have requests.memory but no limits.memory)
- metallb speaker daemonset
I'm not entirely sure where these all come from? Are they held within the microk8s repo (if they have customisations from their project repos?) or pulled directly from the various projects?
If they're local, I'd be happy to try and work out some sensible values based on what I can see from my local cluster and submit a PR. Otherwise I could submit a PR to the project repos for each, but I'm not sure how keen those projects would be if they don't already have resource requests and limits...
VaticanUK
on 7 Oct 2020
I think i've found the addons here:
https://github.com/ubuntu/microk8s/tree/master/microk8s-resources/actions
would such a PR be useful? Or are they currently lacking resource requests and limits for a reason? Could having those cause other unintended problems?
VaticanUK
on 7 Oct 2020
The addons are largely a snapshot of the manifests the upstream projects release. It would be best if the upstream projects validate the limits you would propose. I do not think we, in MicroK8s, have the expertise to verify (and maintain) the resource limits of each addon.
would such a PR be useful?
Yes, such PRs against each addon project makes total sence.
are they currently lacking resource requests and limits for a reason? Could having those cause other unintended problems?
This is something only each upstream project can answer.
ktsakalozos
on 7 Oct 2020
were these memory limits being set - different between 1.18 and 1.19
shadowmodder
on 7 Oct 2020
I setup kube-prometheus-stack recently and it looks like the api-server with HA enabled has a memory leak. See attached image showing api server memory usage over the last 2 days. One node which is not participating in HA has high but steady memory usage. The other three continue to grow, so far without bound.
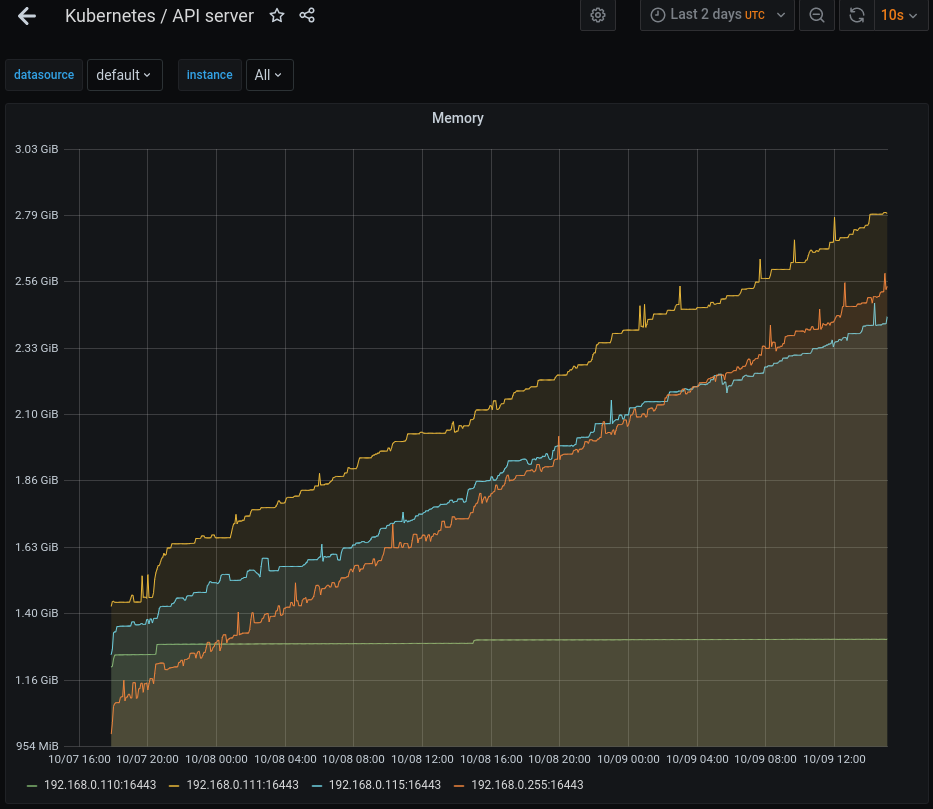
These machines have a good bit of ram, but this still looks suspicious to me. On an embedded system this could certainly be contributing to the corruption and crashes.
Edit:
For clarity I'm still on 1.19/edge, it's auto-updating so the version has changed a few times but it is currently on v1.19.2-34+8e49217fa67454 for all nodes
chris-sanders
on 9 Oct 2020
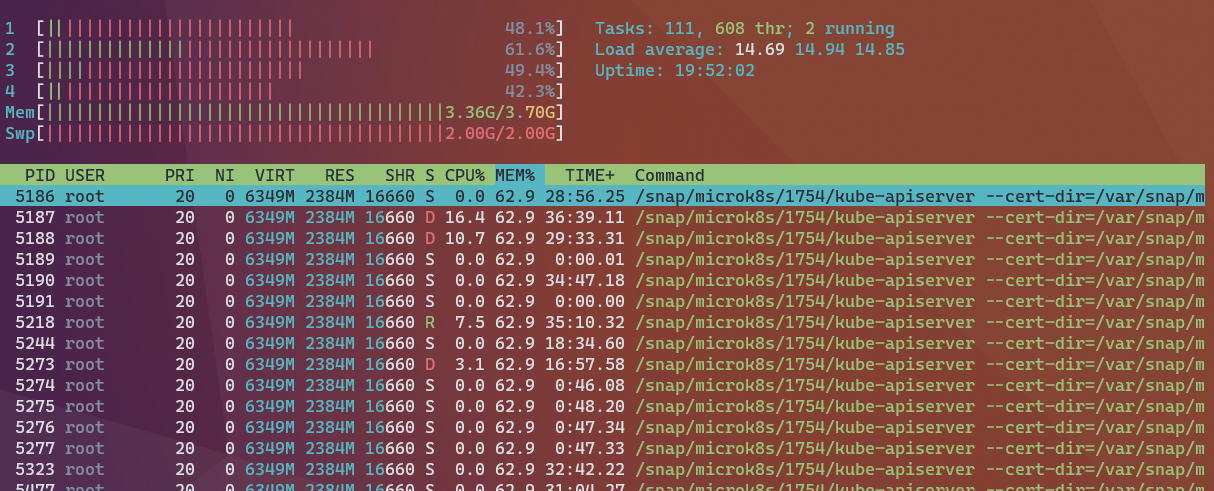
I've been wondering if there is a memory leak for the past few days. Pretty much every time I've had a "failing" node, the kube-apiserver has been using a crazy amount of RAM on that node. Today my cluster has gone down again and this is the output of htop sorted by memory usage on node 1:
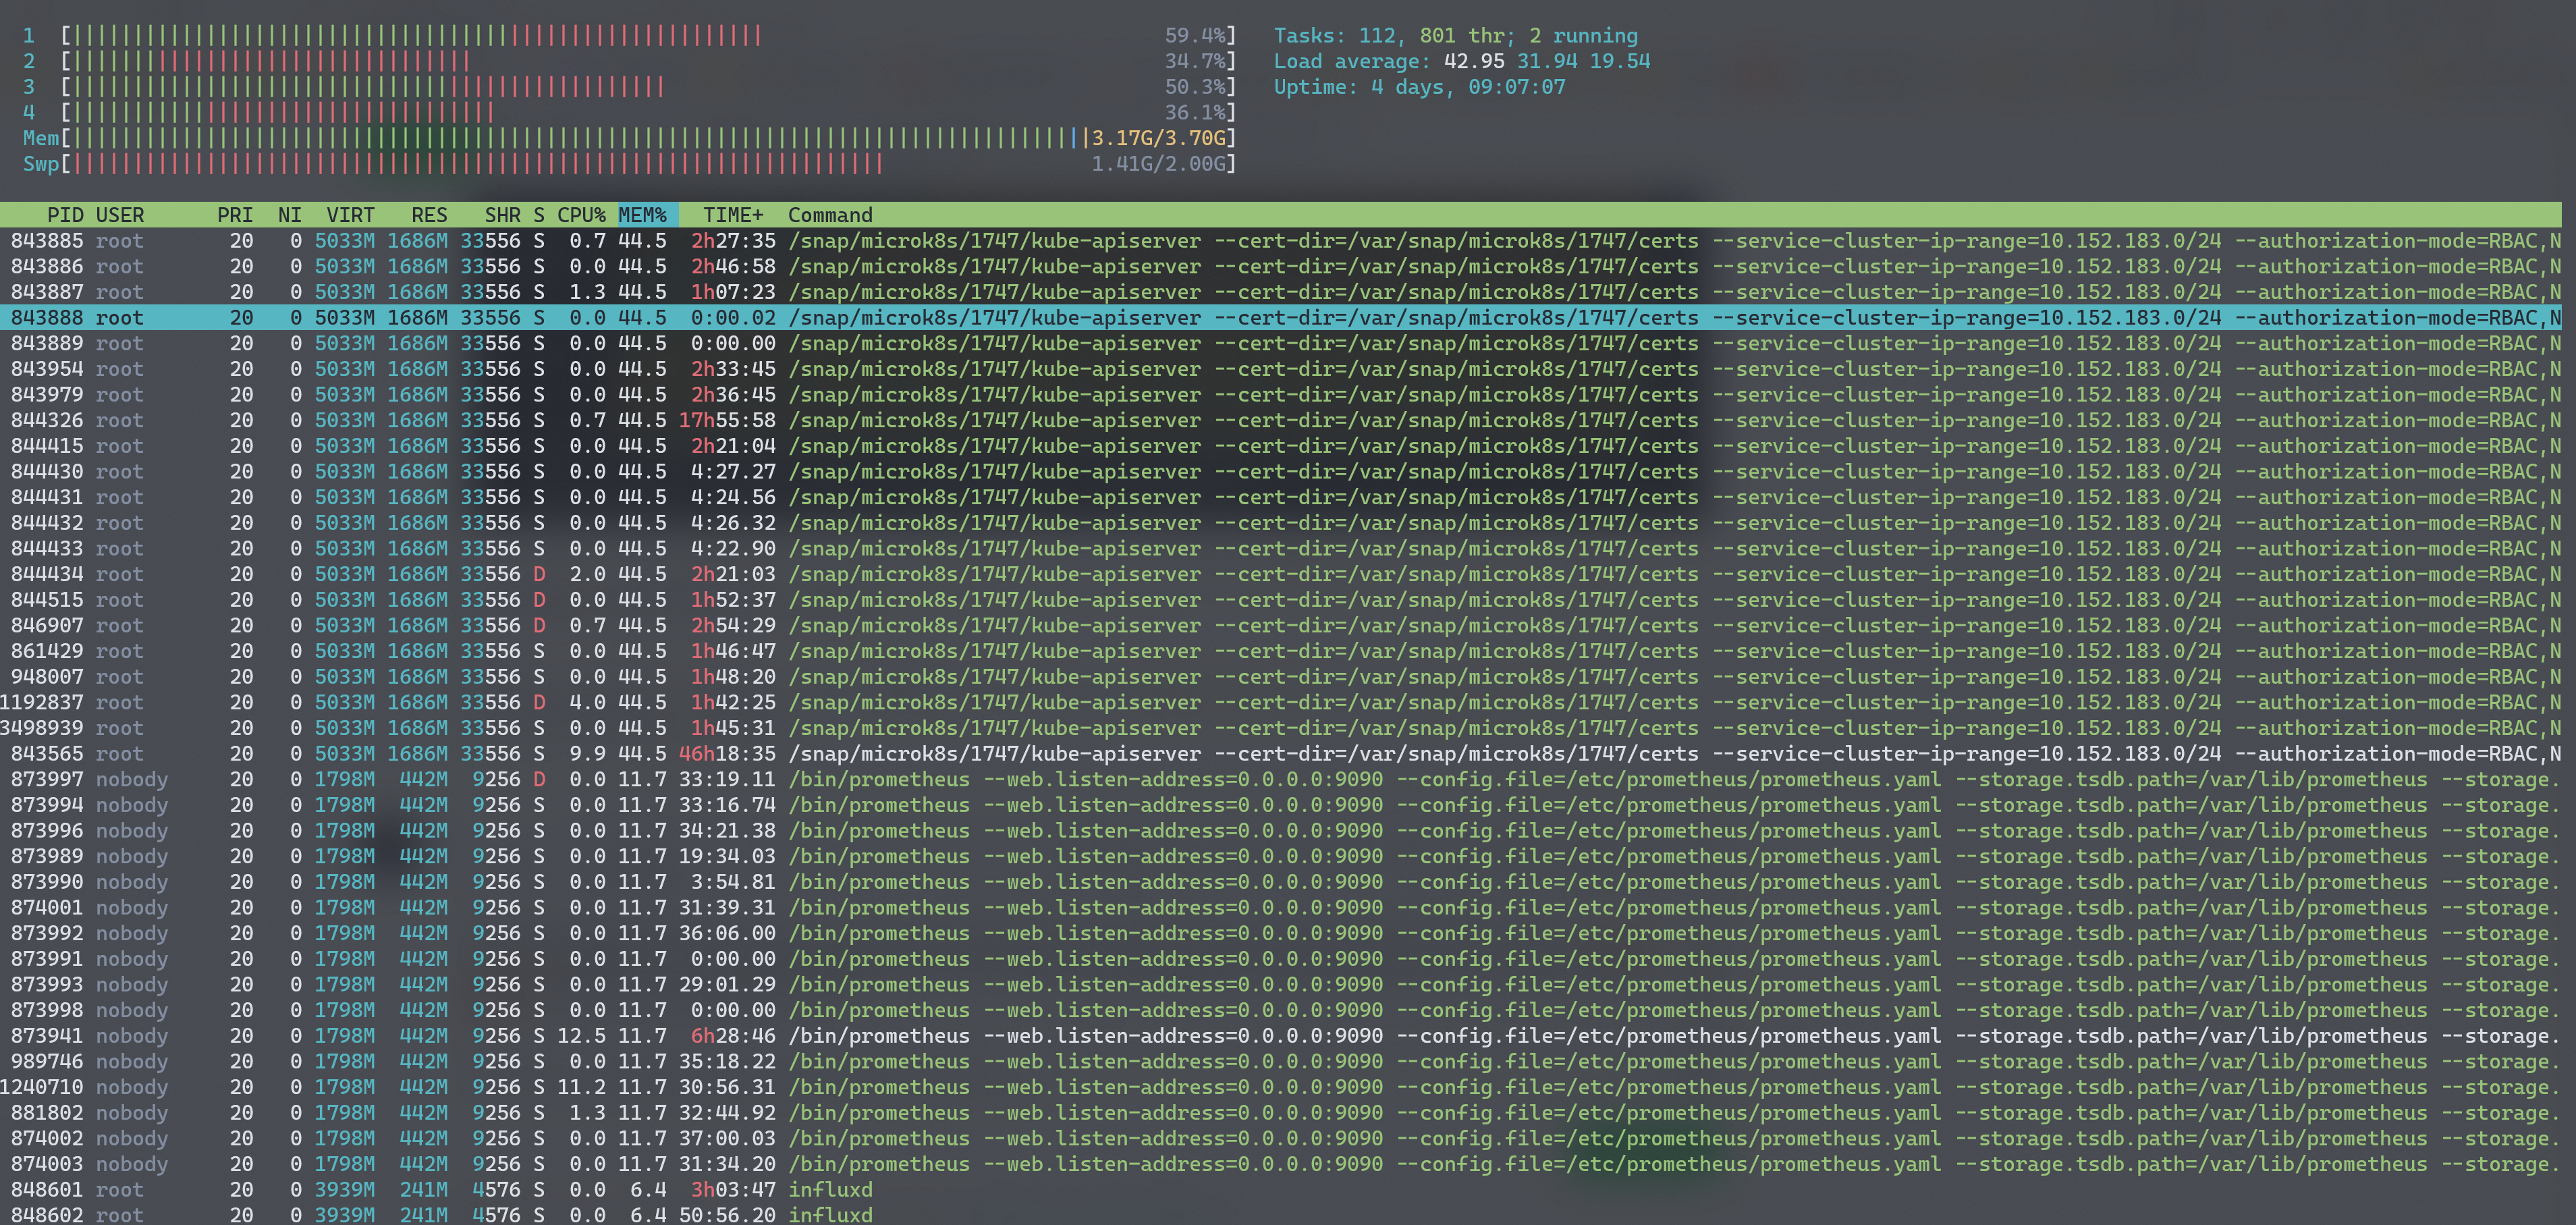
so apiserver is using 45% of 4GB and next biggest is prometheus at 12%.
The other nodes look much better, but since the master node election stuff is not memory usage aware, I believe node 1 is still my master, and it basically become unusable due to high memory usage.
@ktsakalozos this is with 1GB of swap enabled on each 2GB node, and 2GB on each 4GB node. I just rebooted node 1 but forgot to run microk8s inspect first (though given how long it took just to execute htop, I could have been here in a few days waiting for it to complete!). I'll run inspect once it's up again which (i think!?) should at least give you the logs.
Reboot completed and api-server on node1 is now using 65% of RAM! So maybe the RAM usage is legitimate? Seems a crazy amount though - 2.6GB in this instance!
VaticanUK
on 10 Oct 2020
ok, inspect run on node 1:
VaticanUK
on 10 Oct 2020
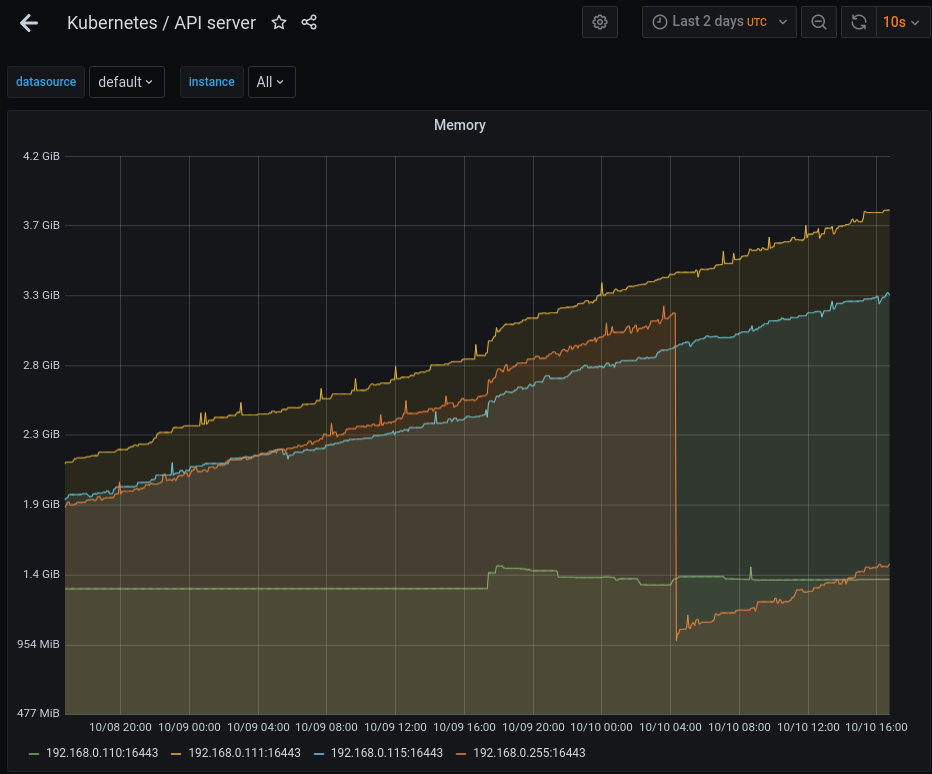
I've let it run, after restarting microk8s you can see the node that was reset on the chart while the other 2 continue to increase in memory consumption. As the running api-servers are starting to surpass 4G of memory usage I'd say it's pretty definitive that it's leaking memory and pretty quickly at that.
chris-sanders
on 10 Oct 2020
@chris-sanders would it be possible to attach the inspection report from one of the nodes showing increasing memory usage? Thank you.
ktsakalozos
on 13 Oct 2020
inspection-report-20201013_053559.tar.gz
@ktsakalozos attached
chris-sanders
on 13 Oct 2020
Another update on this, my cluster has become "unavailable" over the network again. Checking htop on node 1 and the apiserver is using 63% of RAM:
Running inspect atm and i'll attach the tarball when it's completed
VaticanUK
on 16 Oct 2020
VaticanUK
on 16 Oct 2020
@VaticanUK just an FYI the team is looking at this. I'm running a development branch right now on my cluster and have given access to a couple of the devs to one of the machines to see it. No root cause yet, but wanted to let you know it's under investigation.
chris-sanders
on 16 Oct 2020
@chris-sanders thanks, good to know :) Hopefully this will all be sorted soon then :)
VaticanUK
on 16 Oct 2020
hey all, just thought i'd check in and see how you're getting on with this?
VaticanUK
on 22 Oct 2020
Hey, I just enabled helm and I think it was after that when my cluster went down. What are the fixing steps if there are any?
 danielo515
on 26 Oct 2020
danielo515
on 26 Oct 2020
@VaticanUK we are still working on this. We should have news soon.
@danielo515 can you please share your microk8s inspect tarball so we know this is the issue?
ktsakalozos
on 26 Oct 2020
@VaticanUK we are still working on this. We should have news soon.
@danielo515 can you please share your
microk8s inspecttarball so we know this is the issue?
Sure. Can I assume that such tar does not include any sensitive information right?
danielo515
on 26 Oct 2020
Can I assume that such tar does not include any sensitive information right?
@danielo515 please do not assume that. It has service logs, IPs, machine state etc. Please review the tarball before attaching it.
ktsakalozos
on 26 Oct 2020
Ok, here it is
inspection-report-20201026_154806.tar.gz
danielo515
on 26 Oct 2020
@danielo515 we are in the process of evaluating and fixing issues like the one you are seeing in you deployment. The fixes are in the 1.19/edge channel so it would be great if you would snap install microk8s --classic --channel=1.19/edge and provide feedback on the fixes we have in-flight. If you need to recover the deployment you already have you could look at https://discuss.kubernetes.io/t/recovery-of-ha-microk8s-clusters/12931 but know that the recovery process may be more involving than a clean install.
ktsakalozos
on 27 Oct 2020
@ktsakalozos: for us this problem appeared repeatedly with both snap revisions 1710 and 1750 (which is the current 1.19/edge). With microk8s disable ha-cluster everything is running fine.
Maybe you could advise which version it makes sense for us to try next?
- revision
1769(v1.19.2and current1.19/stable- this is probably the same as 1750?) - revision
1770(v1.19.3from channellatest/edge- any changes in here that might help?) - or maybe even revision
1668(v1.19.0 from channellatest/stable)
Thank you for your help and all your efforts towards fixing this!
 jonascyprotect
on 27 Oct 2020
jonascyprotect
on 27 Oct 2020
I've been a little late to weigh in on this one, given I have been seeing similar issues for quite some time, and failures similar to this were what caused my cluster to fail to the point where not functional members were remaining, leading me to have to manually recover the members, in #1578.
I can reliably take a fresh microk8s cluster deployed (in my most recent test) on 1764 (latest/edge) and within 24-48 hours the whole cluster will self-implode due to the apiserver no longer being able to interact with dqlite. I think this fits the pattern people are seeing on 1.19 onward, where using the ha-cluster addon can lead to member servers dropping out of the cluster, and in my case, that continues to happen until there are not enough members for dqlite to happily continue. I've found that even losing one dqlite member in my 3 node cluster will often be enough to get the apiserver to start failing, with numerous context cancelled timeouts, and the entire control plane becomes unresponsive as a result.
I have been monitoring apiserver metrics and will often see the apiserver stop returning metrics as soon as I start seeing the timeouts appear in the logs, and this is normally directly following a message such as failed to create dqlite connection: no available dqlite leader server found. The majority of these messages refer to the 10s timeout for many operations, I'm not sure if this is related to the raft channel used to propagate dqlite messages, but generally 10s seems to be the magic number in a lot of places in the code, and I often see specific calls like APIServiceRegistrationController, and autoregister - but the specific call doesn't seem to matter, mostly that the call touches the datastore, which is backed by dqlite, so I suspect these timeouts are more of a symptom rather than a cause.
Work queue latency is the source of this information in the following Grafana snapshot. These metrics are scraped directly from /metrics on the API server port from each microk8s cluster member, using the bearer token for the admin account.
https://snapshot.raintank.io/dashboard/snapshot/MJ5Y4mBkMHcTVB9YPOwwDjwh8MToNUbC
From my continued observations and monitoring, it seems that the dqlite cluster membership fails, and that then leads to the kubernetes control plane cluster failing as the timeouts writing to the data store seem to not cause a full failure of the apiserver. This then, in many cases, leads to some kind of memory leak, with memory steadily growing if this is left in a failed state for long enough - so could also explain the memory usage folks have been seeing with the ha-cluster addon when they've had a node go sideways.
I've attached an inspection report from a node that failed under similar circumstances just now on latest/edge. I hope it's useful.
inspection-report-20201027_121843.tar.gz
I'd love to see a good way to query dqlite health directly so I could add it to prometheus - if there is an endpoint somehwere I could query information about dqlite cluster membership and transactions I'd be happy to share that data over time, as well.
devec0
on 27 Oct 2020
@danielo515 we are in the process of evaluating and fixing issues like the one you are seeing in you deployment. The fixes are in the
1.19/edgechannel so it would be great if you wouldsnap install microk8s --classic --channel=1.19/edgeand provide feedback on the fixes we have in-flight. If you need to recover the deployment you already have you could look at https://discuss.kubernetes.io/t/recovery-of-ha-microk8s-clusters/12931 but know that the recovery process may be more involving than a clean install.
@ktsakalozos no problem, I am just toying around with it for now, in fact this morning I revert my 3 VMs to original state and run the ansible setup again: Two of them worked, the third is not. I can check this for sure. can I just do snap refresh with the edge channel? Or do I need to uninstall it and then install it "fresh"?
danielo515
on 27 Oct 2020
I have the same problem after trying trying to join another microk8s server.
root@kube2:~# microk8s join ip_addr:25000/f1c30509d4ee04de6f77b9a3edb64aac
Contacting cluster at ip_addr
Waiting for this node to finish joining the cluster. .. .. .. .. .. .. .. .. .. ..
root@kube2:~# microk8s.status
microk8s is not running. Use microk8s inspect for a deeper inspection.
root@kube2:~# microk8s.inspect
Inspecting Certificates
Inspecting services
  Service snap.microk8s.daemon-cluster-agent is running
  Service snap.microk8s.daemon-containerd is running
 FAIL:  Service snap.microk8s.daemon-apiserver is not running
For more details look at: sudo journalctl -u snap.microk8s.daemon-apiserver
  Service snap.microk8s.daemon-apiserver-kicker is running
  Service snap.microk8s.daemon-proxy is running
  Service snap.microk8s.daemon-kubelet is running
  Service snap.microk8s.daemon-scheduler is running
  Service snap.microk8s.daemon-controller-manager is running
  Copy service arguments to the final report tarball
Inspecting AppArmor configuration
Gathering system information
  Copy processes list to the final report tarball
  Copy snap list to the final report tarball
  Copy VM name (or none) to the final report tarball
  Copy disk usage information to the final report tarball
  Copy memory usage information to the final report tarball
  Copy server uptime to the final report tarball
  Copy current linux distribution to the final report tarball
  Copy openSSL information to the final report tarball
  Copy network configuration to the final report tarball
Inspecting kubernetes cluster
  Inspect kubernetes cluster

Building the report tarball
  Report tarball is at /var/snap/microk8s/1769/inspection-report-20201027_155204.tar.gz
My microk8s version is from the stable channel.
root@kube2:~# snap list
Name      Version    Rev    Tracking       Publisher   Notes
core      16-2.47.1  10185  latest/stable  canonical✓  core
microk8s  v1.19.2    1769   1.19/stable    canonical✓  classic
 CodeSmolder
on 27 Oct 2020
CodeSmolder
on 27 Oct 2020
I figured out, that if I disable ha_cluster, joining is possible again:
root@kube2:~# snap remove microk8s --purge
microk8s removed

root@kube2:~# snap install microk8s --classic
microk8s (1.19/stable) v1.19.2 from Canonical✓ installed

root@kube2:~# microk8s disable ha-cluster
Reverting to a non-HA setup
Generating new cluster certificates.
Waiting for node to start.
Enabling flanneld and etcd
HA disabled

root@kube2:~# microk8s join ip_addr:25000/4ad0be3beb9526a437eca263e7f12aed
root@kube2:~# microk8s kubectl get no
This MicroK8s deployment is acting as a node in a cluster. Please use the microk8s kubectl on the master.
root@kube2:~#
I followed above instructions and, removing it and re-installing it makes run as a single-node cluster.
If I disable ha-cluster then I can not join the cluster.
If I enable the ha-cluster again and join the cluster, it joins but then the service stops working with the usual message
danielo515
on 27 Oct 2020
Not totally related to the above, but close enough that I didn't want to create a new issue (please tell me if I should do that instead!).
Had two nodes fully die (not due to memory this time), to the point where I can't get them back to a healthy state, one of them being my primary node which is frustrating (Please correct me here if I'm wrong, but I think even with HA-Cluster, you end up with a primary node? The node which you use as the IP address to join other nodes to? Or can you join a node to any existing node?).
My guess is that the distributed database has somehow got out of sync on two nodes? But I'm not sure how to verify that, or how to work out which files need to be copied across from a good node? (probably a question for @freeekanayaka ?)
Inspection reports from node 1 (dead):
inspection-report-20201029_100858.tar.gz
Inspection reports from node 3 (also dead):
inspection-report-20201029_104940.tar.gz
VaticanUK
on 29 Oct 2020
Hi all, coming in from #1693 and wondering if I should upgrade all of my nodes to 1.19/candidate after removing a failing node forcefully? Also, is the procedure simply to remove-node, uninstall, install, add-node?
 doodlemania2
on 29 Oct 2020
doodlemania2
on 29 Oct 2020
I'm also having this issue. Was working fine for a few days but now the apiserver is down and I can't get it started again.
 sstubbs
on 31 Oct 2020
sstubbs
on 31 Oct 2020
I don't understand. K3s gave up on dqlite for exactly these reasons. Do you have any hope of making this work? If yes, why?
Can I do HA with etcd instead of dqlite?
Can I use an external SQL database (eg RDS)?
 almson
on 5 Nov 2020
almson
on 5 Nov 2020
I'm also having this issue. Was working fine for a few days but now the apiserver is down and I can't get it started again.
Hey, I'm not sure we are experiencing the same issue as I ended up for an every so slightly different issue (but possibly the same coz I'm running on raspberry pi and root cause could be teh same but effect could be different.).
When one of my nodes was unresponsive I ssh-ed on the node and noticed the kube-apiserver cpu usage skyrocketed, and because it is a daemon I thought to just kill it and hope for the best. So I ran kill -15 <pid> but nothing happened, and then I wen kill -9. The cluster didn't go down and the api-server restarted no problem. See screenshot.
 nemo83
on 5 Nov 2020
nemo83
on 5 Nov 2020
Hi @nemo83 - I'm also running my cluster on arm64 - I have found that generally the class of your SD card (I'm actually using a SSD) will make a huge difference running k8s on ARM SoCs either way - but are you using the ha-cluster addon? If so, you might also want to point your metrics (prometheus) at the /metrics endpoint on port 16443 (this is the apiserver) as it produces many useful internal k8s metrics which are useful for tracking down the remaining issues. You'll need to get a token as this endpoint requires auth, but there's plenty of guides online for getting the admin's default bearer token.
You can then add a job such as the one below -
 - job_name: apiserver
    scheme: https
    bearer_token: 'redacted, replace with your token'
    tls_config:
      insecure_skip_verify: true
    static_configs:
      - targets: ['host1:16443', 'host2:16443', 'host3:16443']
Thanks for the tips. My PIs are all running the OS on MicroSD, they do have SSD but only mounted on the StorageClass default path. Good to hear that the already good performances on my PIs can get even better w/ SSD.
WRT ha-mode, yeah I'm running w/ ha turned on. In fairness, I really don't need it, specially if it makes my cluster to crash. I'll turn it off.
I didn't know about the apiserver metrics available there. As soon as I have some time I'll sort that out too.
Thank you v.much for the interesting insight. /bow
nemo83
on 6 Nov 2020
Honestly, it's been a disaster for me. I'm using v1.19 which defaults to HA with 3 nodes. After usually a day, at least one node is dead and can't be restarted, with the usual message "FAIL: Service snap.microk8s.daemon-apiserver is not running". I've tried trashing the VM (Ubuntu 20.04.1 running on ESXi 7), recreating it, rejoining it to the cluster. It will work for another day at most. I went through these steps more times than I can count. Tonight, I notice that the 3 nodes are all dead with the same error. I will go back to kubespray. It was not "Zero-ops high availability" but this mess isn't either. I really hope you can figure it out, because right now, it's unusable, even in a homelab context.
 partialblueshift
on 7 Nov 2020
partialblueshift
on 7 Nov 2020
I've been having issues w/ my 6 node cluster the past few days but have been too busy to look into it.
Fortunately, it's never been a _majority_ of the nodes in the cluster, so my 'recovery' has been:
run
kubectl get noon each node in the cluster. the 4 or 5 nodes that quickly return results are alwaysreadyand the 1 or 2 nodes that either hang forever or immediately return aThe connection to the server $local-ipv4:16443 was refused - did you specify the right host or port?error are the ones that are listed asnot ready.On the node(s) that are not healthy, i run
microk8s stop; microk8s reset; rebootwhile I runmicrok8s remove-node --forceon a healthy node.Take a moment to delete any pods that have failed / were on an unhealthy node.
try to
microk8s join...on the newly rebooted nodes.
If that fails, then i'll do the snap remove --purge route. That has worked in the remainder of the times.
I'm more than happy to help out in debugging this, just give me instructions. Are we still hoping that 1.19/edge has the fix or is there something new?
I went out to get food and came back to a cluster that had failed. I did a quick google and found this thread and here's some initial data:
You can see that node02 and node06 are the most recently failed nodes (i re-added them to the cluster about 20h ago) while the nodes that have just now failed are the 'oldest' nodes in the cluster!
Just to test that the remaining cluster is healthy, I ran microk8s status on a 'master' node and kubectl get no on a standby node
Note: the line that reads datastore standby nodes has two entries... one is the actual hostname node02 and the other is the IPv4 that is assigned to node02
root@node01:/home/karl# microk8s status
microk8s is running
high-availability: yes
  datastore master nodes: IPv4ofNode01:19001 IPv4ofNode05:19001 IPv4ofNode06:19001
  datastore standby nodes: node02:19001 IPv4ofNode02:19001

root@node02:/home/karl# kubectl get no
NAME     STATUS     ROLES    AGE   VERSION
node02   Ready      <none>   18h   v1.19.2-34+1b3fa60b402c1c
node06   Ready      <none>   19h   v1.19.2-34+1b3fa60b402c1c
node05   Ready      <none>   13d   v1.19.2-34+1b3fa60b402c1c
node01   Ready      <none>   14d   v1.19.2-34+1b3fa60b402c1c
node04   NotReady   <none>   14d   v1.19.2-34+1b3fa60b402c1c
node03   NotReady   <none>   14d   v1.19.2-34+1b3fa60b402c1c
In both cases, a journalctl -xfeu snap.microk8s.daemon-apiserver shows: a loop that looks like this:
HOWEVER, only node04 has the _insanely high_ restart count (996+). On node03, the counter is only at 308 before systemd
disables it: 'Start request repeated too quickly.'
Nov 07 22:14:44 node04 systemd[1]: snap.microk8s.daemon-apiserver.service: Main process exited, code=killed, status=11/SEGV
-- Subject: Unit process exited
-- Defined-By: systemd
-- Support: http://www.ubuntu.com/support
--
-- An ExecStart= process belonging to unit snap.microk8s.daemon-apiserver.service has exited.
--
-- The process' exit code is 'killed' and its exit status is 11.
Nov 07 22:14:44 node04 systemd[1]: snap.microk8s.daemon-apiserver.service: Failed with result 'signal'.
-- Subject: Unit failed
-- Defined-By: systemd
-- Support: http://www.ubuntu.com/support
--
-- The unit snap.microk8s.daemon-apiserver.service has entered the 'failed' state with result 'signal'.
Nov 07 22:14:44 node04 systemd[1]: snap.microk8s.daemon-apiserver.service: Scheduled restart job, restart counter is at 996.
-- Subject: Automatic restarting of a unit has been scheduled
-- Defined-By: systemd
-- Support: http://www.ubuntu.com/support
--
-- Automatic restarting of the unit snap.microk8s.daemon-apiserver.service has been scheduled, as the result for
-- the configured Restart= setting for the unit.
Nov 07 22:14:44 node04 systemd[1]: Stopped Service for snap application microk8s.daemon-apiserver.
-- Subject: A stop job for unit snap.microk8s.daemon-apiserver.service has finished
-- Defined-By: systemd
-- Support: http://www.ubuntu.com/support
--
-- A stop job for unit snap.microk8s.daemon-apiserver.service has finished.
--
-- The job identifier is 120224 and the job result is done.
Nov 07 22:14:44 node04 systemd[1]: Started Service for snap application microk8s.daemon-apiserver.
-- Subject: A start job for unit snap.microk8s.daemon-apiserver.service has finished successfully
-- Defined-By: systemd
-- Support: http://www.ubuntu.com/support
--
-- A start job for unit snap.microk8s.daemon-apiserver.service has finished successfully.
--
-- The job identifier is 120224.
Nov 07 22:14:44 node04 microk8s.daemon-apiserver[1316816]: + export PATH=/snap/microk8s/1769/usr/sbin:/snap/microk8s/1769/usr/bin:/snap/microk8s/1769/sbin:/snap/microk8s/1769/bin:/usr/local/sbin:/usr/local/bin:/usr/sbin:/usr/bin:/sbin:/bin:/usr/games:/usr/local/games:/snap/bin
Nov 07 22:14:44 node04 microk8s.daemon-apiserver[1316816]: + PATH=/snap/microk8s/1769/usr/sbin:/snap/microk8s/1769/usr/bin:/snap/microk8s/1769/sbin:/snap/microk8s/1769/bin:/usr/local/sbin:/usr/local/bin:/usr/sbin:/usr/bin:/sbin:/bin:/usr/games:/usr/local/games:/snap/bin
Nov 07 22:14:44 node04 microk8s.daemon-apiserver[1316832]: ++ /snap/microk8s/1769/bin/uname -m
Nov 07 22:14:44 node04 microk8s.daemon-apiserver[1316816]: + ARCH=x86_64
Nov 07 22:14:44 node04 microk8s.daemon-apiserver[1316816]: + export LD_LIBRARY_PATH=:/snap/microk8s/1769/lib:/snap/microk8s/1769/usr/lib:/snap/microk8s/1769/lib/x86_64-linux-gnu:/snap/microk8s/1769/usr/lib/x86_64-linux-gnu
Nov 07 22:14:44 node04 microk8s.daemon-apiserver[1316816]: + LD_LIBRARY_PATH=:/snap/microk8s/1769/lib:/snap/microk8s/1769/usr/lib:/snap/microk8s/1769/lib/x86_64-linux-gnu:/snap/microk8s/1769/usr/lib/x86_64-linux-gnu
Nov 07 22:14:44 node04 microk8s.daemon-apiserver[1316816]: + export LD_LIBRARY_PATH=/var/lib/snapd/lib/gl:/var/lib/snapd/lib/gl32:/var/lib/snapd/void::/snap/microk8s/1769/lib:/snap/microk8s/1769/usr/lib:/snap/microk8s/1769/lib/x86_64-linux-gnu:/snap/microk8s/1769/usr/lib/x86_64-linux-gnu
Nov 07 22:14:44 node04 microk8s.daemon-apiserver[1316816]: + LD_LIBRARY_PATH=/var/lib/snapd/lib/gl:/var/lib/snapd/lib/gl32:/var/lib/snapd/void::/snap/microk8s/1769/lib:/snap/microk8s/1769/usr/lib:/snap/microk8s/1769/lib/x86_64-linux-gnu:/snap/microk8s/1769/usr/lib/x86_64-linux-gnu
Nov 07 22:14:44 node04 microk8s.daemon-apiserver[1316816]: + source /snap/microk8s/1769/actions/common/utils.sh
Nov 07 22:14:44 node04 microk8s.daemon-apiserver[1316816]: + app=kube-apiserver
Nov 07 22:14:44 node04 microk8s.daemon-apiserver[1316816]: + '[' -e /var/snap/microk8s/1769/var/lock/clustered.lock ']'
Nov 07 22:14:44 node04 microk8s.daemon-apiserver[1316816]: + '[' kube-apiserver = kubelet ']'
Nov 07 22:14:44 node04 microk8s.daemon-apiserver[1316816]: + '[' kube-apiserver = kube-apiserver ']'
Nov 07 22:14:44 node04 microk8s.daemon-apiserver[1316816]: + grep -E '(--advertise-address|--bind-address)' /var/snap/microk8s/1769/args/kube-apiserver
Nov 07 22:14:44 node04 microk8s.daemon-apiserver[1316816]: + rm -f /var/snap/microk8s/1769/external_ip.txt
Nov 07 22:14:44 node04 microk8s.daemon-apiserver[1316816]: + n=0
Nov 07 22:14:44 node04 microk8s.daemon-apiserver[1316816]: + '[' 0 -ge 20 ']'
Nov 07 22:14:44 node04 microk8s.daemon-apiserver[1316835]: + ip route
Nov 07 22:14:44 node04 microk8s.daemon-apiserver[1316836]: + grep default
Nov 07 22:14:44 node04 microk8s.daemon-apiserver[1316816]: + break
Nov 07 22:14:44 node04 microk8s.daemon-apiserver[1316816]: + '[' -e /var/snap/microk8s/1769/var/lock/stopped.lock ']'
Nov 07 22:14:44 node04 microk8s.daemon-apiserver[1316816]: + '[' -e /var/snap/microk8s/1769/args/cni-network/cni.yaml ']'
Nov 07 22:14:44 node04 microk8s.daemon-apiserver[1316816]: + ipvs='ipv4 ipv6'
Nov 07 22:14:44 node04 microk8s.daemon-apiserver[1316816]: + for ipv in $ipvs
Nov 07 22:14:44 node04 microk8s.daemon-apiserver[1316816]: + '[' -e /proc/sys/net/ipv4/conf/all/forwarding ']'
Nov 07 22:14:44 node04 microk8s.daemon-apiserver[1316816]: + grep -e 1 /proc/sys/net/ipv4/conf/all/forwarding
Nov 07 22:14:44 node04 microk8s.daemon-apiserver[1316837]: 1
Nov 07 22:14:44 node04 microk8s.daemon-apiserver[1316816]: + for ipv in $ipvs
Nov 07 22:14:44 node04 microk8s.daemon-apiserver[1316816]: + '[' -e /proc/sys/net/ipv6/conf/all/forwarding ']'
Nov 07 22:14:44 node04 microk8s.daemon-apiserver[1316816]: + grep -e 1 /proc/sys/net/ipv6/conf/all/forwarding
Nov 07 22:14:44 node04 microk8s.daemon-apiserver[1316838]: 1
Nov 07 22:14:44 node04 microk8s.daemon-apiserver[1316816]: + '[' kube-apiserver = kube-proxy ']'
Nov 07 22:14:44 node04 microk8s.daemon-apiserver[1316816]: + '[' kube-apiserver = kube-proxy ']'
Nov 07 22:14:44 node04 microk8s.daemon-apiserver[1316816]: + '[' kube-apiserver = kube-proxy ']'
Nov 07 22:14:44 node04 microk8s.daemon-apiserver[1316839]: ++ cat /var/snap/microk8s/1769/args/kube-apiserver
Nov 07 22:14:44 node04 microk8s.daemon-apiserver[1316816]: + declare -a 'args=(--cert-dir=${SNAP_DATA}/certs
Nov 07 22:14:44 node04 microk8s.daemon-apiserver[1316816]: --service-cluster-ip-range=10.152.183.0/24
Nov 07 22:14:44 node04 microk8s.daemon-apiserver[1316816]: --authorization-mode=RBAC,Node
Nov 07 22:14:44 node04 microk8s.daemon-apiserver[1316816]: --service-account-key-file=${SNAP_DATA}/certs/serviceaccount.key
Nov 07 22:14:44 node04 microk8s.daemon-apiserver[1316816]: --client-ca-file=${SNAP_DATA}/certs/ca.crt
Nov 07 22:14:44 node04 microk8s.daemon-apiserver[1316816]: --tls-cert-file=${SNAP_DATA}/certs/server.crt
Nov 07 22:14:44 node04 microk8s.daemon-apiserver[1316816]: --tls-private-key-file=${SNAP_DATA}/certs/server.key
Nov 07 22:14:44 node04 microk8s.daemon-apiserver[1316816]: --kubelet-client-certificate=${SNAP_DATA}/certs/server.crt
Nov 07 22:14:44 node04 microk8s.daemon-apiserver[1316816]: --kubelet-client-key=${SNAP_DATA}/certs/server.key
Nov 07 22:14:44 node04 microk8s.daemon-apiserver[1316816]: --secure-port=16443
Nov 07 22:14:44 node04 microk8s.daemon-apiserver[1316816]: --token-auth-file=${SNAP_DATA}/credentials/known_tokens.csv
Nov 07 22:14:44 node04 microk8s.daemon-apiserver[1316816]: --insecure-port=0
Nov 07 22:14:44 node04 microk8s.daemon-apiserver[1316816]: --storage-backend=dqlite
Nov 07 22:14:44 node04 microk8s.daemon-apiserver[1316816]: --storage-dir=${SNAP_DATA}/var/kubernetes/backend/
Nov 07 22:14:44 node04 microk8s.daemon-apiserver[1316816]: --allow-privileged=true
Nov 07 22:14:44 node04 microk8s.daemon-apiserver[1316816]: # Enable the aggregation layer
Nov 07 22:14:44 node04 microk8s.daemon-apiserver[1316816]: --requestheader-client-ca-file=${SNAP_DATA}/certs/front-proxy-ca.crt
Nov 07 22:14:44 node04 microk8s.daemon-apiserver[1316816]: --requestheader-allowed-names=front-proxy-client
Nov 07 22:14:44 node04 microk8s.daemon-apiserver[1316816]: --requestheader-extra-headers-prefix=X-Remote-Extra-
Nov 07 22:14:44 node04 microk8s.daemon-apiserver[1316816]: --requestheader-group-headers=X-Remote-Group
Nov 07 22:14:44 node04 microk8s.daemon-apiserver[1316816]: --requestheader-username-headers=X-Remote-User
Nov 07 22:14:44 node04 microk8s.daemon-apiserver[1316816]: --proxy-client-cert-file=${SNAP_DATA}/certs/front-proxy-client.crt
Nov 07 22:14:44 node04 microk8s.daemon-apiserver[1316816]: --proxy-client-key-file=${SNAP_DATA}/certs/front-proxy-client.key
Nov 07 22:14:44 node04 microk8s.daemon-apiserver[1316816]: #~Enable the aggregation layer)'
Nov 07 22:14:44 node04 microk8s.daemon-apiserver[1316816]: + '[' -f /snap/microk8s/1769/kube-apiserver ']'
Nov 07 22:14:44 node04 microk8s.daemon-apiserver[1316816]: + exec /snap/microk8s/1769/kube-apiserver --cert-dir=/var/snap/microk8s/1769/certs --service-cluster-ip-range=10.152.183.0/24 --authorization-mode=RBAC,Node --service-account-key-file=/var/snap/microk8s/1769/certs/serviceaccount.key --client-ca-file=/var/snap/microk8s/1769/certs/ca.crt --tls-cert-file=/var/snap/microk8s/1769/certs/server.crt --tls-private-key-file=/var/snap/microk8s/1769/certs/server.key --kubelet-client-certificate=/var/snap/microk8s/1769/certs/server.crt --kubelet-client-key=/var/snap/microk8s/1769/certs/server.key --secure-port=16443 --token-auth-file=/var/snap/microk8s/1769/credentials/known_tokens.csv --insecure-port=0 --storage-backend=dqlite --storage-dir=/var/snap/microk8s/1769/var/kubernetes/backend/ --allow-privileged=true --requestheader-client-ca-file=/var/snap/microk8s/1769/certs/front-proxy-ca.crt --requestheader-allowed-names=front-proxy-client --requestheader-extra-headers-prefix=X-Remote-Extra- --requestheader-group-headers=X-Remote-Group --requestheader-username-headers=X-Remote-User --proxy-client-cert-file=/var/snap/microk8s/1769/certs/front-proxy-client.crt --proxy-client-key-file=/var/snap/microk8s/1769/certs/front-proxy-client.key
Nov 07 22:14:45 node04 microk8s.daemon-apiserver[1316816]: Flag --insecure-port has been deprecated, This flag will be removed in a future version.
Nov 07 22:14:45 node04 microk8s.daemon-apiserver[1316816]: I1107 22:14:45.057313 1316816 server.go:647] external host was not specified, using IPv4ofNode04
Nov 07 22:14:48 node04 systemd[1]: snap.microk8s.daemon-apiserver.service: Main process exited, code=killed, status=11/SEGV
Other thing to note, the status=11/SEGV is _not_ mentioned in this thread, so it may be that I'm dealing with a different issue that presents with nearly identical symptoms?
 kquinsland
on 7 Nov 2020
kquinsland
on 7 Nov 2020
@partialblueshift @kquinsland , sorry to hear you guys are going so much trouble. Have you tried to _just_ kill -9 the pid of the kube-apiserver ? I noticed it fixed things for me instantly w/o letting the node to go down.
Also, I've done what @devec0 suggested and disabled HA (please note that doing so, at least in my case, wiped the cluster blank). No issues since, and, I'm sorry to say, the CPU usage of my PIs has reducted A LOT. See screenshot:
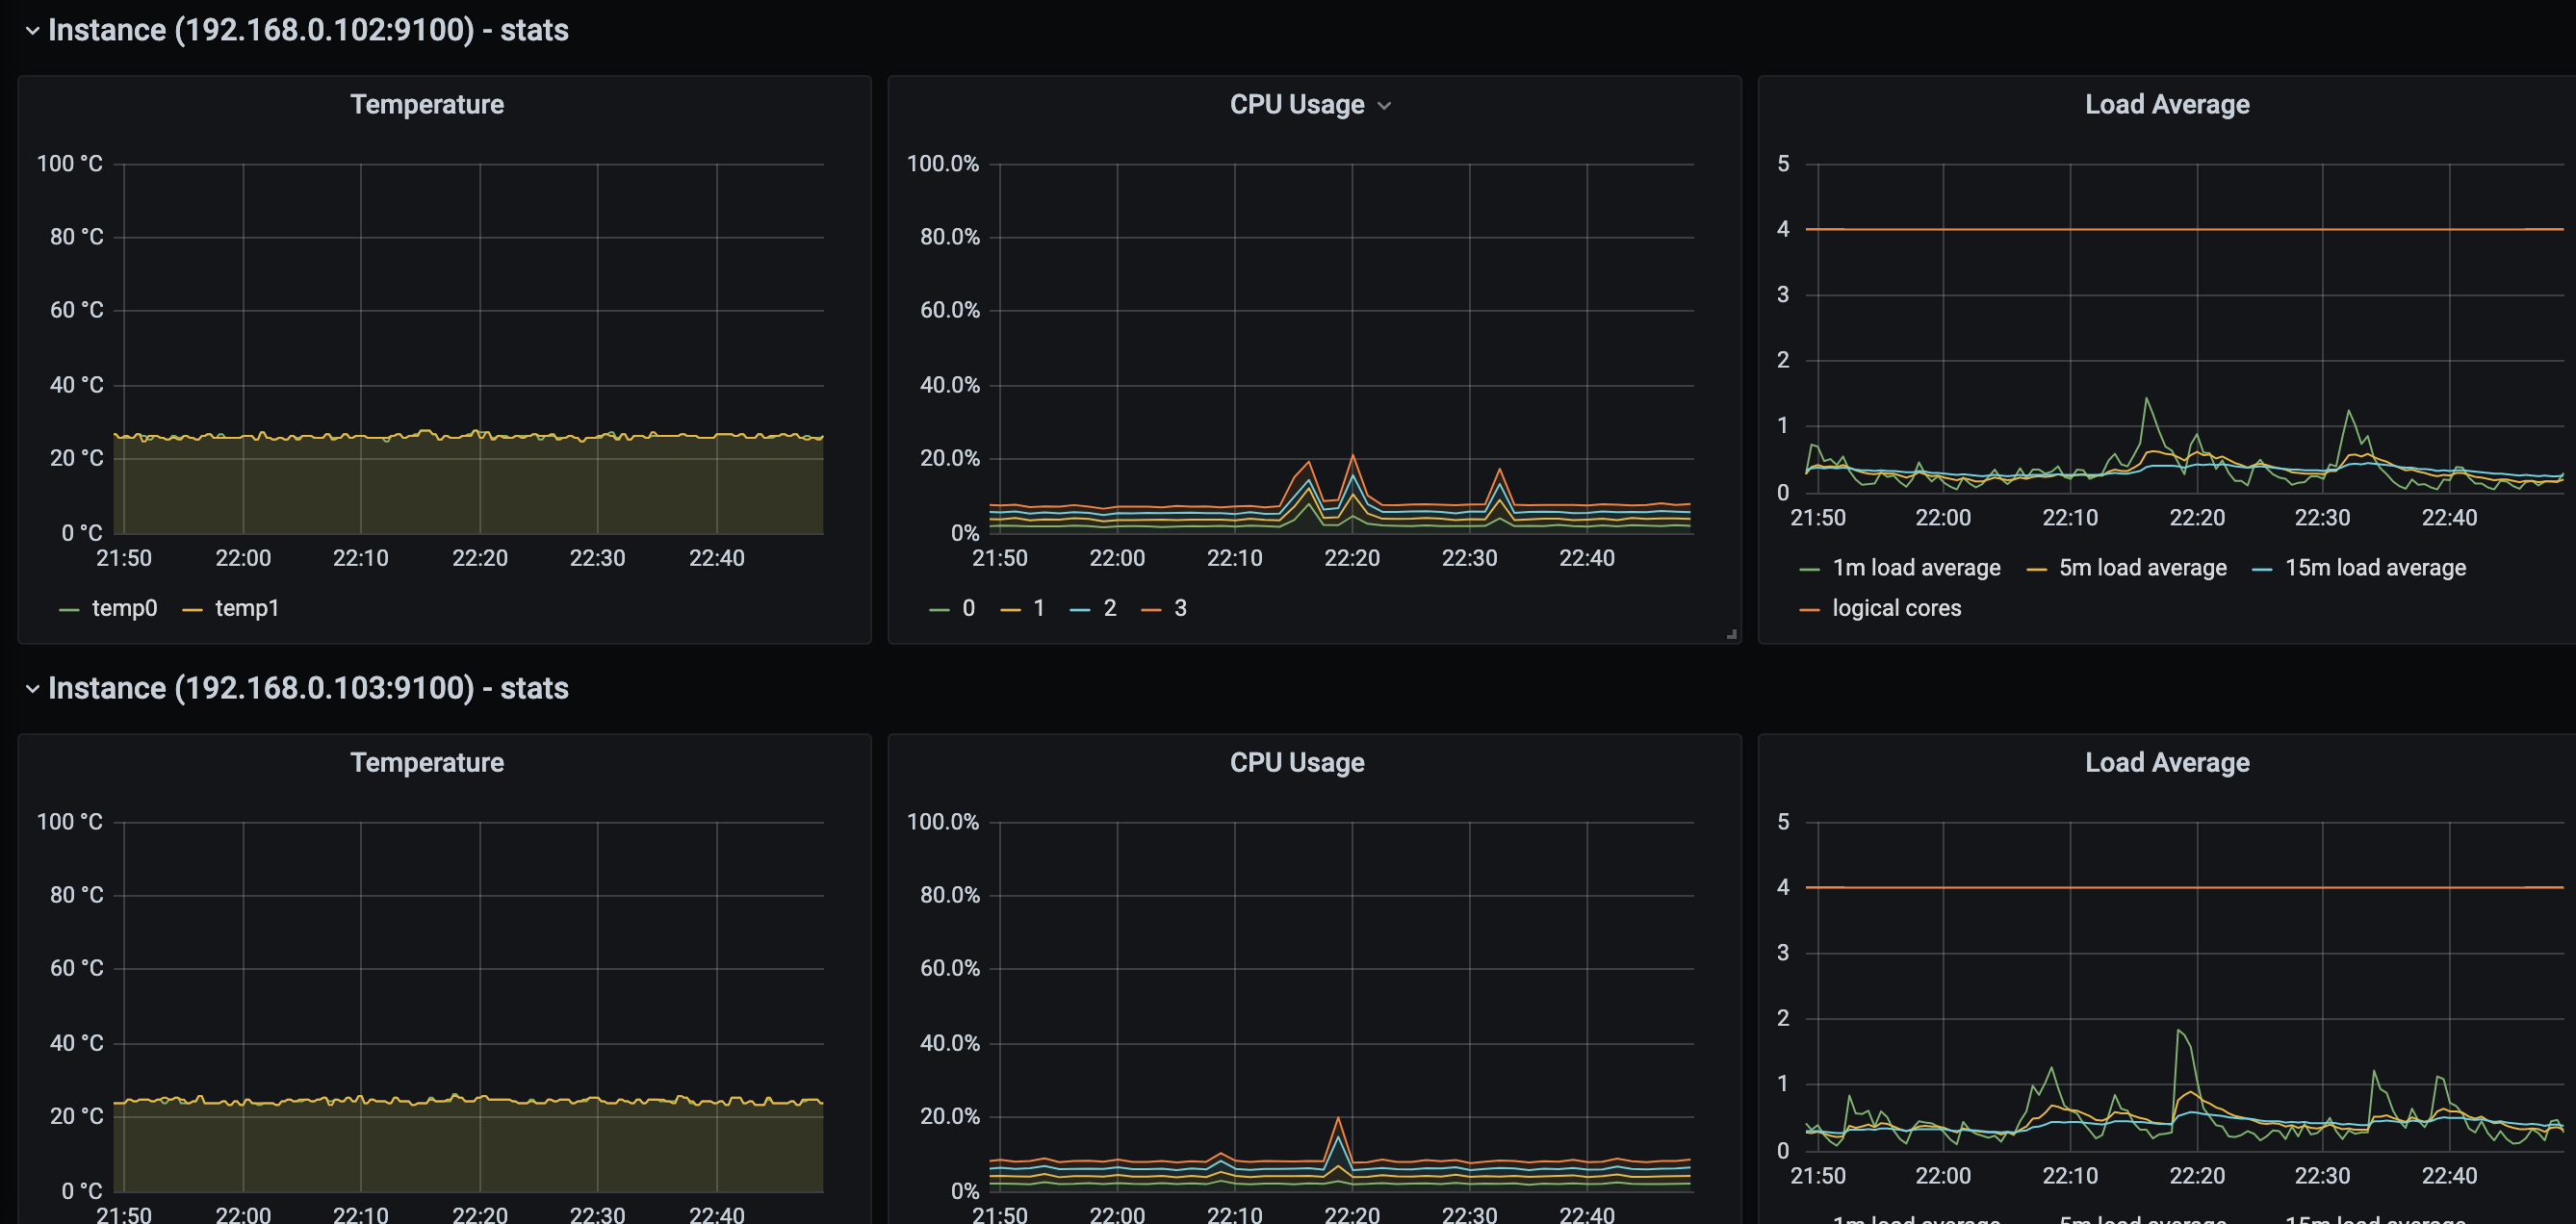
And compare to the one in my previous reply (of course ignoring the spike). W/o HA CPUs are at 10% or less, with HA cpu were at 20%. And the cluster is running exaclty the same amount of pods as before
nemo83
on 7 Nov 2020
@nemo83 Thanks for the super quick reply! I will consider turning HA off, but ultimately i'd like to get this _fixed_ and since this is a home lab, it's disruptive (lots of home/personal automation) but not critical.
After i posted above, I tried the recovery steps outlined here: https://discuss.kubernetes.io/t/recovery-of-ha-microk8s-clusters/12931
But the /backend folder of _each node_ had different content. That is, _each_ of the primary nodes had a different number of snapshot-* files and the sequence numbers didnt match on any node; all of the healthy nodes had a slightly diifferent sequence number, but they had all been written @ about the same time. The two unhealthy nodes both had radically 'outdated' sequence numbers.
I picked one of the backup nodes to restore from and... apparently that was a bad choice! One of my nodes (node03) still won't come up _at all_ (same issue, Main process exited, code=killed, status=11/SEGV) and the other 5 came up and i was eventually able to access my dashboard after a ton of log-spew that has a lot of transaction related logging in it.
After a reboot, i was able to get that node03 back up, but it remains in the NotReady state. If it does not join back up by the time i finish my tea, i'll microk8s remove --force and snap remove microk8s --purge.
The next time that this happens, I'll give kill -9 a shot and wait for some additional guidance as to which version i should move to ( /edge or /latest).
EDIT:
I was forced to remove-node --force and microk8s reset to get node03 back in the cluster.
As soon as i run microk8s join ... on node03 i run kubectl get no on my desktop and see that node05 is now in the same restart loop. journalctl shows:
Nov 07 23:44:53 node05 microk8s.daemon-apiserver[244631]: W1107 23:44:53.901816  244631 authentication.go:484] AnonymousAuth is not allowed with the AlwaysAllow authorizer. Resetting AnonymousAuth to false. You should use a different authorizer
Nov 07 23:44:56 node05 systemd[1]: snap.microk8s.daemon-apiserver.service: Main process exited, code=killed, status=11/SEGV
Sending pkill -9 didn't do much to the apiserrver as it's _already_ flapping:
kill -9 $(ps aux | grep '/snap/microk8s/1769/kube-apiserve' | awk '{print $2}')
Hi,
Yesterday i gave the latest/edge channel a go. The setup is:
- 3 node cluster
- CPU: 2
- Memory: 4GB
- Addons enabled are:
- prometheus
- metrics-server
- dns
- storage
- dashboard
- ha-cluster
- Installed Linkerd edge version
- Installed keda
24 hours later, this the memory usage.
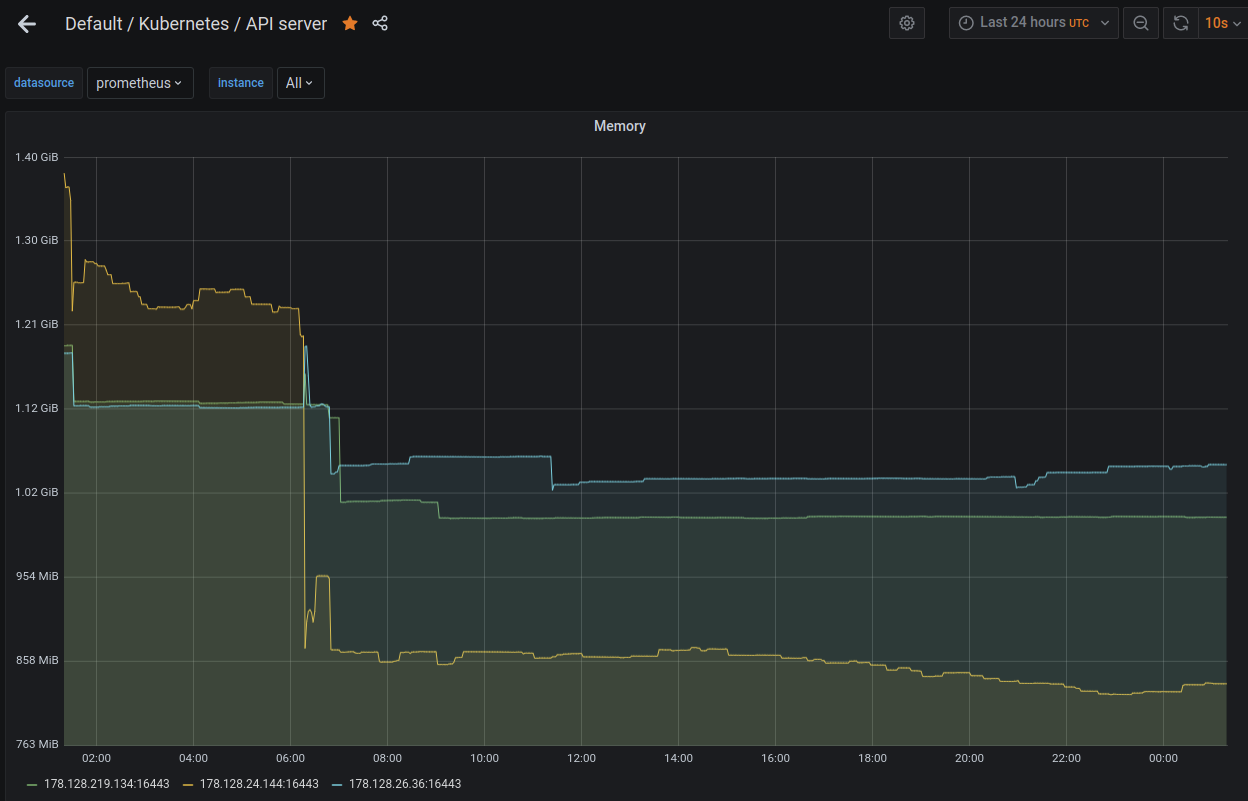
This is the cpu usage
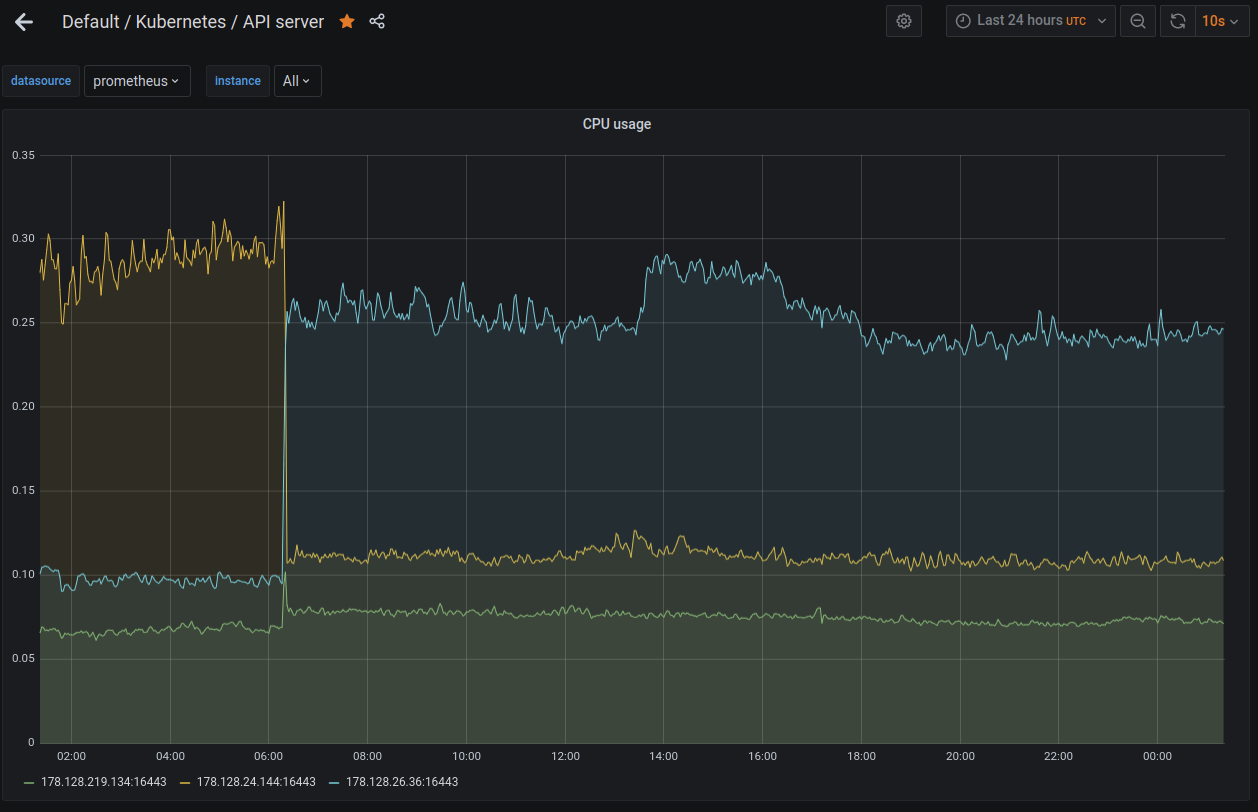
You can see that the memory after the 0600 time, the memory utilization remains constant.
I purposely set the MemoryMax in the systemd apiservice. Like this:
sudo systemctl set-property snap.microk8s.daemon-apiserver MemoryMax=1.2G
You will also notice prior to 0600 the utilization of the node 178.128.24.144 (the yellow or orange) is around the 1.2G high mark. The apiserver on the node 178.128.24.144 (the yellow or orange) was killed by the kernel at around 0616, probably due to OOM. After this time, i think the node 178.128.26.36 (the blue coloe) took over as the leader.
I checked the apiserver logs in the node 178.128.24.144 and noticed that at the time im setting the MemoryMax property it complained that it was not able to set the property because it was busy.
Perhaps I should have restarted MicroK8s after setting the memory property. The cluster is still responsive, none of the pods were evicted or restarted. My guess is that Go is being more aggressive in garbage collecting the memory. But I am in no way an expert in Go. :)
So far I have not seen the cluster using memory hovering around 1.1G. From the looks of it, it does seem stable. The last time i tested it (i.e. without the MemoryMax property set), the memory is growing beyond 1.2G. The workqueue latency is swinging wildly beyond 1sec sometimes up to 10sec.
These are the pods running in the cluster, not too much.
microk8s kubectl get pods -A
NAMESPACE      NAME                                         READY   STATUS    RESTARTS   AGE
cert-manager   cert-manager-6d87886d5c-98lq5                1/1     Running   0          25h
cert-manager   cert-manager-cainjector-55db655cd8-g8thp     1/1     Running   0          25h
kube-system    calico-kube-controllers-847c8c99d-4f42h      1/1     Running   0          25h
kube-system    calico-node-jrmm6                            1/1     Running   0          25h
ingress        nginx-ingress-microk8s-controller-r9slw      1/1     Running   0          25h
kube-system    calico-node-6rjrn                            1/1     Running   0          25h
ingress        nginx-ingress-microk8s-controller-wnxkn      1/1     Running   0          25h
kube-system    coredns-86f78bb79c-ghjvr                     1/1     Running   0          25h
ingress        nginx-ingress-microk8s-controller-4zfpw      1/1     Running   0          25h
monitoring     prometheus-operator-5b7946f4d6-5m9h8         2/2     Running   0          25h
monitoring     node-exporter-z4wrf                          2/2     Running   0          25h
monitoring     kube-state-metrics-66b65b78bc-bjbzn          3/3     Running   0          25h
monitoring     node-exporter-lfsvb                          2/2     Running   0          25h
monitoring     prometheus-adapter-557648f58c-xgw66          1/1     Running   0          25h
monitoring     grafana-7c9bc466d8-257qd                     1/1     Running   0          25h
monitoring     node-exporter-ccc48                          2/2     Running   0          25h
monitoring     prometheus-k8s-0                             3/3     Running   1          25h
cert-manager   cert-manager-webhook-6846f844ff-mzjpd        1/1     Running   0          25h
kube-system    calico-node-7pcmd                            1/1     Running   0          25h
kube-system    metrics-server-8bbfb4bdb-zc4xn               1/1     Running   0          25h
monitoring     alertmanager-main-0                          2/2     Running   0          25h
kube-system    dashboard-metrics-scraper-6c4568dc68-ts8mq   1/1     Running   0          25h
kube-system    kubernetes-dashboard-7ffd448895-g48fh        1/1     Running   0          25h
linkerd        linkerd-identity-6fd9d8c77c-fw66p            2/2     Running   0          25h
linkerd        linkerd-proxy-injector-54d967fc56-6cxfs      2/2     Running   0          25h
linkerd        linkerd-sp-validator-7645b85467-2mdh7        2/2     Running   0          25h
linkerd        linkerd-grafana-57466cdfdf-kflph             2/2     Running   0          25h
linkerd        linkerd-web-78c596bd94-kwzf8                 2/2     Running   0          25h
linkerd        linkerd-controller-6d7cf7684f-6zkhd          2/2     Running   0          25h
linkerd        linkerd-tap-78c65fb678-lpp4p                 2/2     Running   0          25h
linkerd        linkerd-destination-59956b4f98-rzcps         2/2     Running   0          25h
linkerd        linkerd-prometheus-7659fc5b-w2qsf            2/2     Running   0          25h
keda           keda-metrics-apiserver-7976569458-zj5pn      1/1     Running   0          24h
keda           keda-operator-84f7687cfc-5pbbq               1/1     Running   0          24h
kube-system    hostpath-provisioner-5c65fbdb4f-w5lgm        1/1     Running   0          24h
Perhaps its still too early to tell. I will continue to keep an eye on the cluster. For those who may way to try this one out. Set the MemoryMax property in apiservice service like this sudo systemctl set-property snap.microk8s.daemon-apiserver MemoryMax=1.2G and restart the apiservice.
Please note that this is done on a fresh cluster.
balchua
on 8 Nov 2020
Hi balchua,
Is this issue fixed in sudo snap install microk8s --classic --channel=1.19/edge?
I have set it to sudo systemctl set-property snap.microk8s.daemon-apiserver MemoryMax=2.0G
By when, we can expect the stable release?
Regards,
sans
 sansindia85
on 9 Nov 2020
sansindia85
on 9 Nov 2020
@nemo83 I can't kill the process because it's already dead at that point. Rebooting will not restart it, neither a "microk8s stop; microk8s start"
Here is my journalctl, if that helps. The interesting bit is at the end: "Main process exited, code=killed, status=11/SEGV"
Nov 09 20:15:32 uk8s1 systemd[1]: Started Service for snap application microk8s.daemon-apiserver.
Nov 09 20:15:32 uk8s1 microk8s.daemon-apiserver[2738943]: + export PATH=/snap/microk8s/1769/usr/sbin:/snap/microk8s/1769/usr/bin:/snap/microk8s/1769/sbin:/snap/microk8s/1769/bin:/usr/local/sbin:/usr/local/bin:/usr/sbin:/usr/bin:/sbin:/b>
Nov 09 20:15:32 uk8s1 microk8s.daemon-apiserver[2738943]: + PATH=/snap/microk8s/1769/usr/sbin:/snap/microk8s/1769/usr/bin:/snap/microk8s/1769/sbin:/snap/microk8s/1769/bin:/usr/local/sbin:/usr/local/bin:/usr/sbin:/usr/bin:/sbin:/bin:/usr>
Nov 09 20:15:32 uk8s1 microk8s.daemon-apiserver[2738956]: ++ /snap/microk8s/1769/bin/uname -m
Nov 09 20:15:32 uk8s1 microk8s.daemon-apiserver[2738943]: + ARCH=x86_64
Nov 09 20:15:32 uk8s1 microk8s.daemon-apiserver[2738943]: + export LD_LIBRARY_PATH=:/snap/microk8s/1769/lib:/snap/microk8s/1769/usr/lib:/snap/microk8s/1769/lib/x86_64-linux-gnu:/snap/microk8s/1769/usr/lib/x86_64-linux-gnu
Nov 09 20:15:32 uk8s1 microk8s.daemon-apiserver[2738943]: + LD_LIBRARY_PATH=:/snap/microk8s/1769/lib:/snap/microk8s/1769/usr/lib:/snap/microk8s/1769/lib/x86_64-linux-gnu:/snap/microk8s/1769/usr/lib/x86_64-linux-gnu
Nov 09 20:15:32 uk8s1 microk8s.daemon-apiserver[2738943]: + export LD_LIBRARY_PATH=/var/lib/snapd/lib/gl:/var/lib/snapd/lib/gl32:/var/lib/snapd/void::/snap/microk8s/1769/lib:/snap/microk8s/1769/usr/lib:/snap/microk8s/1769/lib/x86_64-lin>
Nov 09 20:15:32 uk8s1 microk8s.daemon-apiserver[2738943]: + LD_LIBRARY_PATH=/var/lib/snapd/lib/gl:/var/lib/snapd/lib/gl32:/var/lib/snapd/void::/snap/microk8s/1769/lib:/snap/microk8s/1769/usr/lib:/snap/microk8s/1769/lib/x86_64-linux-gnu:>
Nov 09 20:15:32 uk8s1 microk8s.daemon-apiserver[2738943]: + source /snap/microk8s/1769/actions/common/utils.sh
Nov 09 20:15:32 uk8s1 microk8s.daemon-apiserver[2738943]: + app=kube-apiserver
Nov 09 20:15:32 uk8s1 microk8s.daemon-apiserver[2738943]: + '[' -e /var/snap/microk8s/1769/var/lock/clustered.lock ']'
Nov 09 20:15:32 uk8s1 microk8s.daemon-apiserver[2738943]: + '[' kube-apiserver = kubelet ']'
Nov 09 20:15:32 uk8s1 microk8s.daemon-apiserver[2738943]: + '[' kube-apiserver = kube-apiserver ']'
Nov 09 20:15:32 uk8s1 microk8s.daemon-apiserver[2738943]: + grep -E '(--advertise-address|--bind-address)' /var/snap/microk8s/1769/args/kube-apiserver
Nov 09 20:15:32 uk8s1 microk8s.daemon-apiserver[2738943]: + rm -f /var/snap/microk8s/1769/external_ip.txt
Nov 09 20:15:32 uk8s1 microk8s.daemon-apiserver[2738943]: + n=0
Nov 09 20:15:32 uk8s1 microk8s.daemon-apiserver[2738943]: + '[' 0 -ge 20 ']'
Nov 09 20:15:32 uk8s1 microk8s.daemon-apiserver[2738960]: + grep default
Nov 09 20:15:32 uk8s1 microk8s.daemon-apiserver[2738959]: + ip route
Nov 09 20:15:32 uk8s1 microk8s.daemon-apiserver[2738943]: + break
Nov 09 20:15:32 uk8s1 microk8s.daemon-apiserver[2738943]: + '[' -e /var/snap/microk8s/1769/var/lock/stopped.lock ']'
Nov 09 20:15:32 uk8s1 microk8s.daemon-apiserver[2738943]: + '[' -e /var/snap/microk8s/1769/args/cni-network/cni.yaml ']'
Nov 09 20:15:32 uk8s1 microk8s.daemon-apiserver[2738943]: + ipvs='ipv4 ipv6'
Nov 09 20:15:32 uk8s1 microk8s.daemon-apiserver[2738943]: + for ipv in $ipvs
Nov 09 20:15:32 uk8s1 microk8s.daemon-apiserver[2738943]: + '[' -e /proc/sys/net/ipv4/conf/all/forwarding ']'
Nov 09 20:15:32 uk8s1 microk8s.daemon-apiserver[2738943]: + grep -e 1 /proc/sys/net/ipv4/conf/all/forwarding
Nov 09 20:15:32 uk8s1 microk8s.daemon-apiserver[2738961]: 1
Nov 09 20:15:32 uk8s1 microk8s.daemon-apiserver[2738943]: + for ipv in $ipvs
Nov 09 20:15:32 uk8s1 microk8s.daemon-apiserver[2738943]: + '[' -e /proc/sys/net/ipv6/conf/all/forwarding ']'
Nov 09 20:15:32 uk8s1 microk8s.daemon-apiserver[2738943]: + grep -e 1 /proc/sys/net/ipv6/conf/all/forwarding
Nov 09 20:15:32 uk8s1 microk8s.daemon-apiserver[2738962]: 1
Nov 09 20:15:32 uk8s1 microk8s.daemon-apiserver[2738943]: + '[' kube-apiserver = kube-proxy ']'
Nov 09 20:15:32 uk8s1 microk8s.daemon-apiserver[2738943]: + '[' kube-apiserver = kube-proxy ']'
Nov 09 20:15:32 uk8s1 microk8s.daemon-apiserver[2738943]: + '[' kube-apiserver = kube-proxy ']'
Nov 09 20:15:32 uk8s1 microk8s.daemon-apiserver[2738963]: ++ cat /var/snap/microk8s/1769/args/kube-apiserver
Nov 09 20:15:32 uk8s1 microk8s.daemon-apiserver[2738943]: + declare -a 'args=(--cert-dir=${SNAP_DATA}/certs
Nov 09 20:15:32 uk8s1 microk8s.daemon-apiserver[2738943]: --service-cluster-ip-range=10.152.183.0/24
Nov 09 20:15:32 uk8s1 microk8s.daemon-apiserver[2738943]: --authorization-mode=AlwaysAllow
Nov 09 20:15:32 uk8s1 microk8s.daemon-apiserver[2738943]: --service-account-key-file=${SNAP_DATA}/certs/serviceaccount.key
Nov 09 20:15:32 uk8s1 microk8s.daemon-apiserver[2738943]: --client-ca-file=${SNAP_DATA}/certs/ca.crt
Nov 09 20:15:32 uk8s1 microk8s.daemon-apiserver[2738943]: --tls-cert-file=${SNAP_DATA}/certs/server.crt
Nov 09 20:15:32 uk8s1 microk8s.daemon-apiserver[2738943]: --tls-private-key-file=${SNAP_DATA}/certs/server.key
Nov 09 20:15:32 uk8s1 microk8s.daemon-apiserver[2738943]: --kubelet-client-certificate=${SNAP_DATA}/certs/server.crt
Nov 09 20:15:32 uk8s1 microk8s.daemon-apiserver[2738943]: --kubelet-client-key=${SNAP_DATA}/certs/server.key
Nov 09 20:15:32 uk8s1 microk8s.daemon-apiserver[2738943]: --secure-port=16443
Nov 09 20:15:32 uk8s1 microk8s.daemon-apiserver[2738943]: --token-auth-file=${SNAP_DATA}/credentials/known_tokens.csv
Nov 09 20:15:32 uk8s1 microk8s.daemon-apiserver[2738943]: --insecure-port=0
Nov 09 20:15:32 uk8s1 microk8s.daemon-apiserver[2738943]: --storage-backend=dqlite
Nov 09 20:15:32 uk8s1 microk8s.daemon-apiserver[2738943]: --storage-dir=${SNAP_DATA}/var/kubernetes/backend/
Nov 09 20:15:32 uk8s1 microk8s.daemon-apiserver[2738943]: --allow-privileged=true
Nov 09 20:15:32 uk8s1 microk8s.daemon-apiserver[2738943]: # Enable the aggregation layer
Nov 09 20:15:32 uk8s1 microk8s.daemon-apiserver[2738943]: --requestheader-client-ca-file=${SNAP_DATA}/certs/front-proxy-ca.crt
Nov 09 20:15:32 uk8s1 microk8s.daemon-apiserver[2738943]: --requestheader-allowed-names=front-proxy-client
Nov 09 20:15:32 uk8s1 microk8s.daemon-apiserver[2738943]: --requestheader-extra-headers-prefix=X-Remote-Extra-
Nov 09 20:15:32 uk8s1 microk8s.daemon-apiserver[2738943]: --requestheader-group-headers=X-Remote-Group
Nov 09 20:15:32 uk8s1 microk8s.daemon-apiserver[2738943]: --requestheader-username-headers=X-Remote-User
Nov 09 20:15:32 uk8s1 microk8s.daemon-apiserver[2738943]: --proxy-client-cert-file=${SNAP_DATA}/certs/front-proxy-client.crt
Nov 09 20:15:32 uk8s1 microk8s.daemon-apiserver[2738943]: --proxy-client-key-file=${SNAP_DATA}/certs/front-proxy-client.key
Nov 09 20:15:32 uk8s1 microk8s.daemon-apiserver[2738943]: #~Enable the aggregation layer)'
Nov 09 20:15:32 uk8s1 microk8s.daemon-apiserver[2738943]: + '[' -f /snap/microk8s/1769/kube-apiserver ']'
Nov 09 20:15:32 uk8s1 microk8s.daemon-apiserver[2738943]: + exec /snap/microk8s/1769/kube-apiserver --cert-dir=/var/snap/microk8s/1769/certs --service-cluster-ip-range=10.152.183.0/24 --authorization-mode=AlwaysAllow --service-account-k>
Nov 09 20:15:32 uk8s1 microk8s.daemon-apiserver[2738943]: Flag --insecure-port has been deprecated, This flag will be removed in a future version.
Nov 09 20:15:32 uk8s1 microk8s.daemon-apiserver[2738943]: I1109 20:15:32.781336 2738943 server.go:647] external host was not specified, using 192.168.11.190
Nov 09 20:15:32 uk8s1 microk8s.daemon-apiserver[2738943]: W1109 20:15:32.781376 2738943 authentication.go:484] AnonymousAuth is not allowed with the AlwaysAllow authorizer. Resetting AnonymousAuth to false. You should use a different au>
Nov 09 20:15:33 uk8s1 systemd[1]: snap.microk8s.daemon-apiserver.service: Main process exited, code=killed, status=11/SEGV
Nov 09 20:15:33 uk8s1 systemd[1]: snap.microk8s.daemon-apiserver.service: Failed with result 'signal'.
Nov 09 20:15:34 uk8s1 systemd[1]: snap.microk8s.daemon-apiserver.service: Scheduled restart job, restart counter is at 5.
Nov 09 20:15:34 uk8s1 systemd[1]: Stopped Service for snap application microk8s.daemon-apiserver.
Nov 09 20:15:34 uk8s1 systemd[1]: snap.microk8s.daemon-apiserver.service: Start request repeated too quickly.
Nov 09 20:15:34 uk8s1 systemd[1]: snap.microk8s.daemon-apiserver.service: Failed with result 'signal'.
Nov 09 20:15:34 uk8s1 systemd[1]: Failed to start Service for snap application microk8s.daemon-apiserver.
What I understand, is whenever the kube-apiserver goes down and will not restart, it is because it segfaults during the initialization. At this point, the only remedy I found is to scrap the VM and start again from scratch.
EDIT: I forgot to mention, this is pure vanilla cluster. I installed the latest Ubuntu server on 3 VM (2 vCPU, 4GB RAM, 16GB HDD) in ESXi. Then I installed Microk8s 1.19 (sudo snap install microk8s --classic --channel=1.19) on the 3 servers, joined them in a cluster and didn't deploy anything to them or enabled any add-ons. At first, they were all reporting ready, but less than 48 hours later, all nodes are dead and none will restart.
partialblueshift
on 9 Nov 2020
@sansindia85 thanks for testing this out. With regards to when the fixes will be available to the stable channel, i heard it will be soon. @ktsakalozos @chris-sanders maybe able to give more details about this.
The details i gave here https://github.com/ubuntu/microk8s/issues/1598#issuecomment-723519500 is my own experimentation.
Fyi, its been 3 days and my cluster seems to be holding up. Memory usage hovers around 1GB and 1.1GB. it does spike up, but eventually goes down. No OOM nor apiserver restarts since then.
if you or anyone can give this a try, that will be great. Compare it with your previous setup by running the same workload on it. Once again, im not a go expert in anyway. 😁
balchua
on 9 Nov 2020
@partialblueshift if you are still up to it, perhaps trying out the steps i made here https://github.com/ubuntu/microk8s/issues/1598#issuecomment-723519500. Since you can consistently bring down you cluster, it maybe interesting to know if the steps holds up in your case. 😊
Fyi, i am using the latest/edge channel.
balchua
on 9 Nov 2020
I've got a single instance running on 1.19/candidate which has been running for 7 days without any problems. 1.19/stable seemed to last for about 3 days before apiserver would crash and not start again.
sstubbs
on 10 Nov 2020
Been away most of today, so not sure when this happened:
$ kubectl get no
NAME     STATUS     ROLES    AGE     VERSION
node03   NotReady   <none>   2d2h    v1.19.2-34+1b3fa60b402c1c
node06   NotReady   <none>   2d23h   v1.19.2-34+1b3fa60b402c1c
node02   NotReady   <none>   2d23h   v1.19.2-34+1b3fa60b402c1c
node05   NotReady   <none>   2d2h    v1.19.2-34+1b3fa60b402c1c
node01   Ready      <none>   17d     v1.19.2-34+1b3fa60b402c1c
node04   Ready      <none>   17d     v1.19.2-34+1b3fa60b402c1c
I don't have any graphs because the pods that run prometheus failed and i don't yet have persistent storage set up for them.
I really want to know what makes node01 and node04 so special; they are the only 'surviving' nodes from the orig cluster. Every other node has been leave --force and reset :/.
I'll stay on stable for now, @balchua, but I will apply the MemoryMax tweak and monitor.
kquinsland
on 10 Nov 2020
@kquinsland what about 1.19/candidate @sstubbs experience with it is that it is more stable than 1.19/stable.
You have enabled HA right?
balchua
on 10 Nov 2020
I was not able to recover my cluster. I identified node04 as having the most recent data, i cleared followed the recovery procedure here: https://discuss.kubernetes.io/t/recovery-of-ha-microk8s-clusters/12931 and as I was trying to bring nodes back, each failed with microk8s.daemon-apiserver[20680]: Error: context deadline exceeded in snap.microk8s.daemon-apiserver logs.
Since the cluster is now a loss, i will revert the MemoryMax tweak on all nodes and move to 1.19/candidate.
You have enabled HA right?
It's enabled by default. I have not disabled it.
kquinsland
on 10 Nov 2020
Hi all,
We will be doing a release to the stable channels (latest/stable and 1.19/stable) this week.
This release will be addressing the segmentation faults and data corruption issues.
We are still investigating the memory leak.
Thank you for your patience.
ktsakalozos
on 10 Nov 2020
@ktsakalozos will there be any recommendation how to change from 1.19/edge back to stable?
Aaron-Ritter
on 10 Nov 2020
When it's released stable will be what was previously edge. The question of switching back is really at that point based on what versions you want to auto-update to.
We are still investigating the memory leak and I suspect you'll see edge branches roll out to help instrument and investigate that. If you want to follow that work, stay on edge. If you just want the recent round of fixes for corruption you should switch back to stable to avoid the edge work.
chris-sanders
on 10 Nov 2020
In the future (December 2020) and my assumption, the latest/stable will come with Kubernetes V1.20.
I think the 1.19/stable will be released with Kubernetes V1.19.4. It may be expected by this Friday.
Can we change from 1.19/edge to 1.19/stable and vice versa smoothly on 5 node cluster using refresh feature of MicroK8s?
Regarding memory leak, what exactly is the impact?
sansindia85
on 12 Nov 2020
@sansindia85 regarding memory leak, what i noticed so far is that the apiserver will be oom killed by the kernel once it reaches the MemoryMax. Systemd will then start it backup.
I have seen my apiserver crashed 2x, but the cluster is still functional. The pods remain operational.
Also need to know that im just leaving it running. Occasionally access the cluster. But thats about it. You can observe your cluster.
Another observation is when you query lots of things from apiserver, like events etc... Many times in succession. You will see that the memory starts to grow. Sometimes it comes back down and sometimes it stays that way.
balchua
on 12 Nov 2020
@balchua : Thanks for your reply.
For a while, I will not set any memory limit of 2.0G and change it to default (infinity) :
sudo systemctl set-property snap.microk8s.daemon-apiserver MemoryMax=infinity
Also, i refreshed from 1.19/stable to 1.19/edge for one cluster, it went smoothly:
sudo snap refresh microk8s --channel=1.19/edge
sansindia85
on 12 Nov 2020
It looks like the new 1.19.3 release to stable channel has improved things, but we're not out of the woods, yet.
I started from scratch and sometime after 36h+ of up time, only one node had become wedged. The pod scheduled on that node has become unresponsive and it took about 45 seconds for htop to render. The existing SSH session i had locked up shortly after this screenshot was taken and I could not establish another. The only 'exit' was to hold the power button down for 5s to immediately power down. The disk activity light never stopped blinking the whole time. Text book swap/thrash :(.
The last time this happened (prior to me finding this issue), the cluster was not able to re-form after the affected nodes rebooted due to corrupt data. This time, a reboot was all that was needed to get back on my feet.
I am more than happy to jump to the edge channel if I can get a bit of guidance on which metrics / logs to keep an eye on as to validate the work being done on edge.
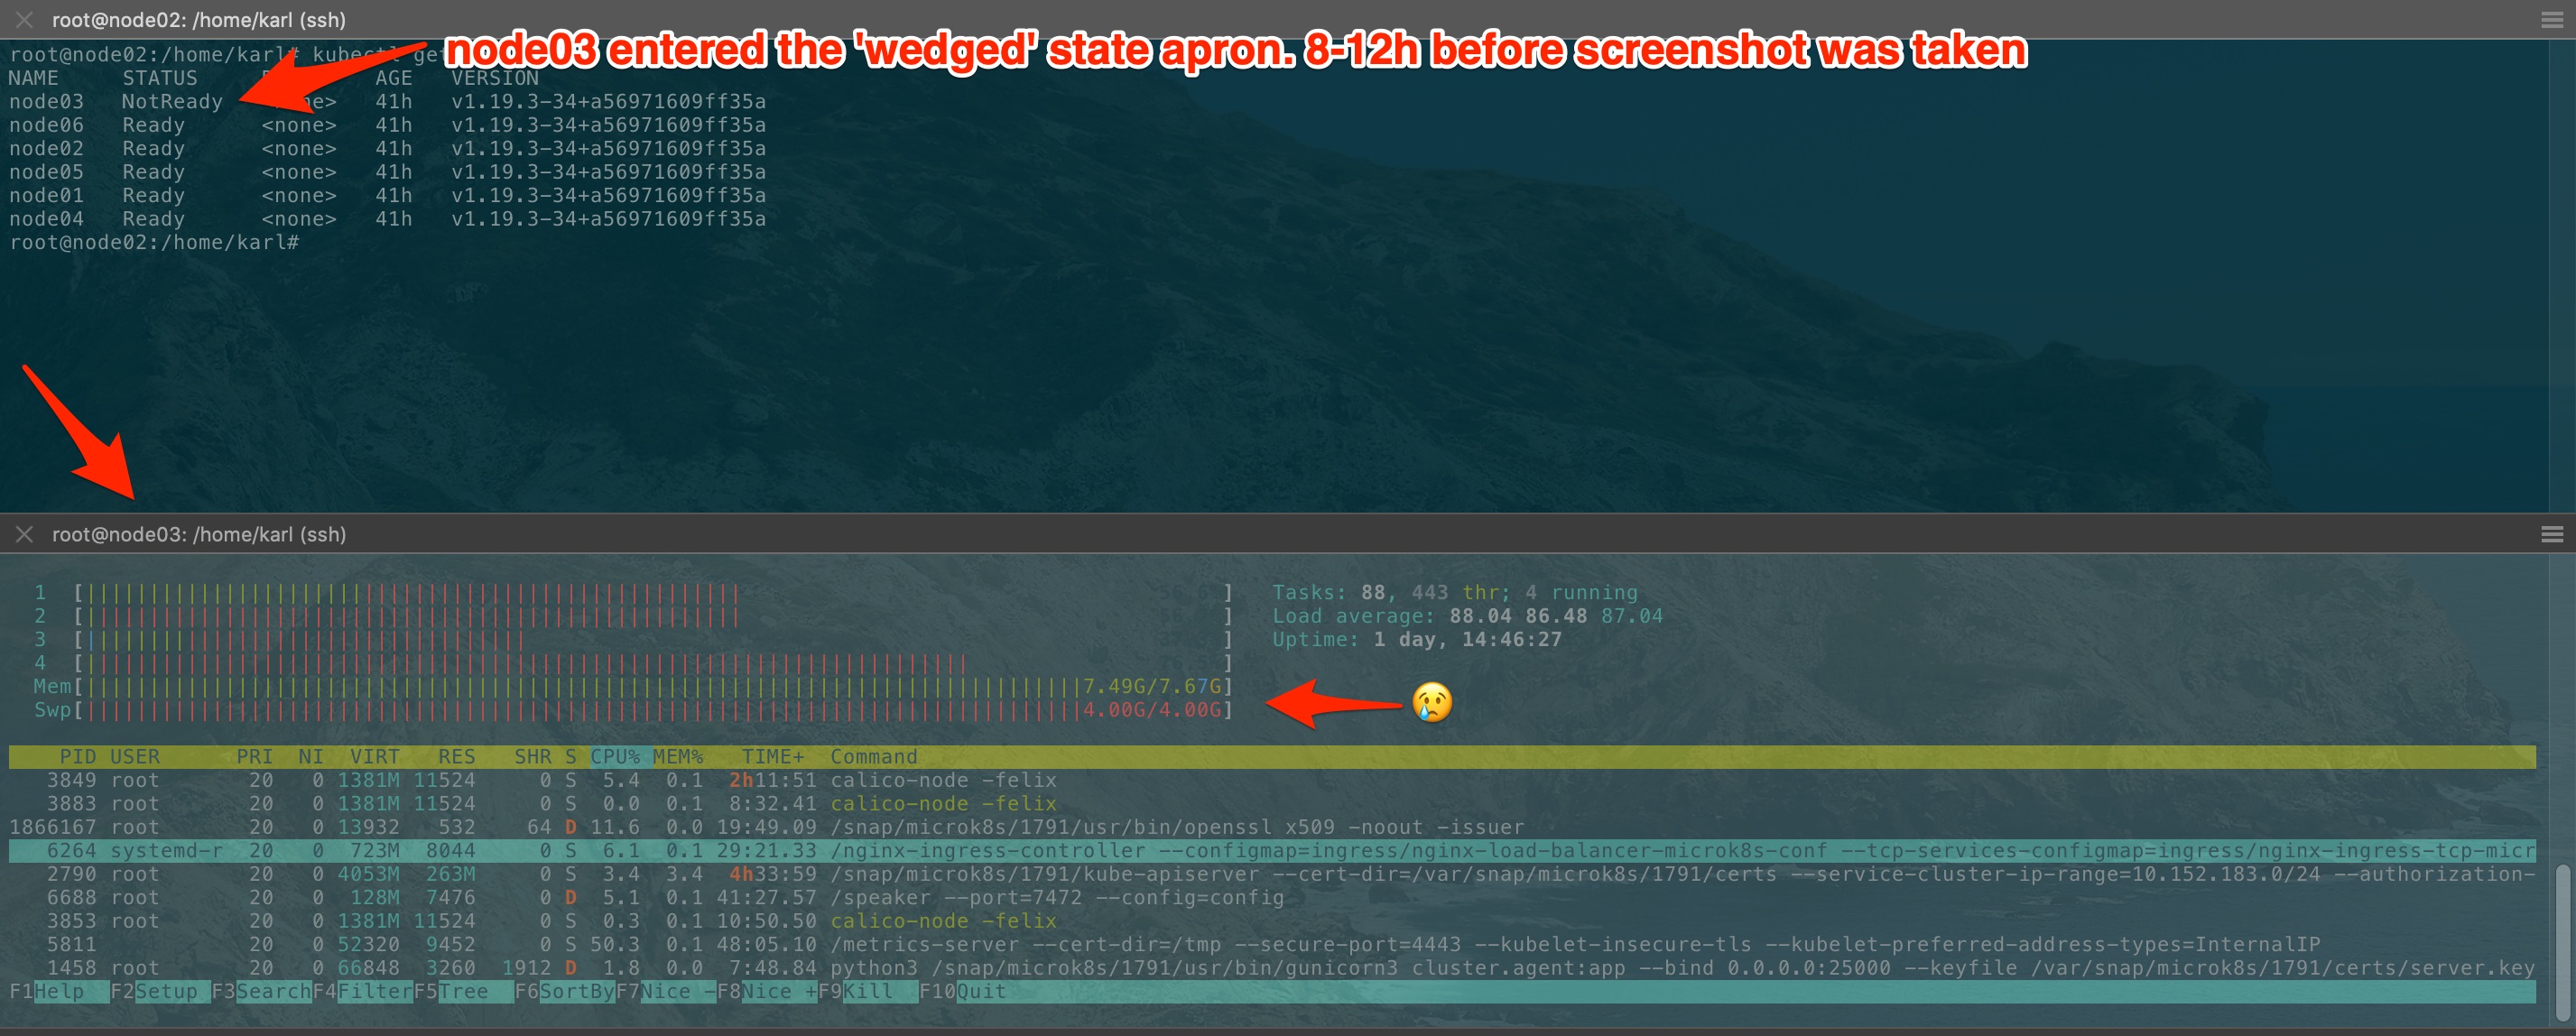
Typo in screenshot apron should be aprox. I noticed the failed state yesterday evening and wanted to wait until sat AM to see if it would resolve.
kquinsland
on 14 Nov 2020
Hello this bug still occurs.
If we have 6 node cluster. than add 7th node.
And after we install juju microk8s controller -> then calico and kube-apiserver fails to start and communicate and 7th node fails to start/reinstall.
 daydrim
on 22 Nov 2020
daydrim
on 22 Nov 2020
Hi all, it's been a while since the last update here, how are things progressing with fixing this?
Thanks
VaticanUK
on 6 Dec 2020
I'm using microk8s on 5 node cluster. I'm using 16GB RAM per node.
The version is mentioned below :
1.19/stable: v1.19.3 2020-11-12 (1791) 214MB classic
I'm running it since 26 days continuously. Things improved better compared to previous version. Thanks to Canonical team. It helped me.
Today, I observed that snap.microk8s.deamon-apiserver consumed up to 5.6GB memory. If they give update on memory leak then it would be great. Temporary workaround is to observe the nodes using "microk8s kubectl top nodes". Restart the node which consumed lot of memory to reclaim the memory.
What should be the ideal memory consumption of this service?
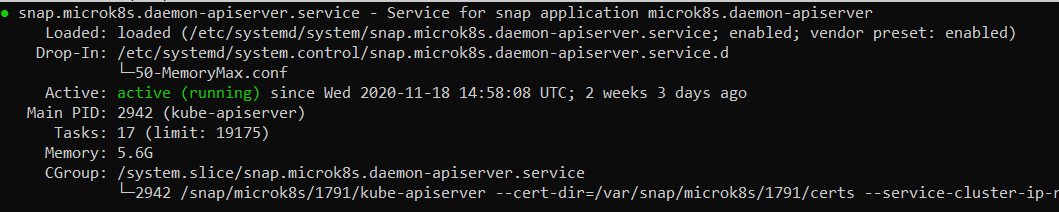
sansindia85
on 6 Dec 2020
@sansindia85 do you have plenty of pods running? I noticed that when i was running a CronJob and then i query the kubernetes Events the memory seems to spike up.
But since i capped the memory, it never reaches that size.
Im also running on a 4GB RAM VM.
balchua
on 7 Dec 2020
@balchua : At present, I have close to 60 pods running.
Is api server using 5.6GB of memory is normal?
Mine is a 5 node cluster with 16GB RAM each.
sansindia85
on 7 Dec 2020
@sansindia85 i dont know if 5.6GB is normal. But we also need to remember that it runs dqlite in replacement to etcd. So it's tough to compare.
balchua
on 7 Dec 2020
I'm still hitting the segfaulting issue (and memory leaking) on a regular basis (at least once a week) on 1.19/edge. It's usually a single node that starts segfaulting, and needs recovery using the process described in https://discuss.kubernetes.io/t/recovery-of-ha-microk8s-clusters/12931.
 mjm
on 18 Dec 2020
mjm
on 18 Dec 2020
I'm experiencing the same problem as described above. This is on 1.20/stable channel (1866).
I can post the .zip from the inspect command if it would be helpful, but seems like there's enough reports/info to go on.
 chrisromano
on 20 Dec 2020
chrisromano
on 20 Dec 2020
It is easy to reproduce (on my RaspberryPi 4 nodes). For me it looks like it has something to do with the number and speed of calls against the api-server. I removed Prometheus from my installation and the load went down from around 4 to 3. I restarted Microk8s on my nodes and had around 1GB memory consumption on the api-server processes. Then I reinstalled Prometheus again and the api-server process on one of my nodes immediately started to consume memory again:
2559882 root 20 0 4267808 2.1g 74768 S 38.0 27.8 279:27.78 kube-apiserver
I am using 1.20/edge
 tbrandstetter
on 20 Dec 2020
tbrandstetter
on 20 Dec 2020
Related issues
 singram
·
4Comments
singram
·
4Comments
 toxsick
·
4Comments
toxsick
·
4Comments
 qbx2
·
4Comments
qbx2
·
4Comments
 carmine
·
4Comments
carmine
·
4Comments
 termie
·
5Comments
termie
·
5Comments
Most helpful comment
Hi all,
We will be doing a release to the stable channels (latest/stable and 1.19/stable) this week.
This release will be addressing the segmentation faults and data corruption issues.
We are still investigating the memory leak.
Thank you for your patience.