Microk8s: Prometheus - 401 Unauthorized / Empty Dashboards
I have a clean install of microk8s 1.17 on Ubuntu 18.04.
The following listing shows, which addins I have enabled:
dannyyy@k8s:~$ sudo microk8s.status
microk8s is running
addons:
cilium: disabled
dashboard: disabled
dns: enabled
fluentd: disabled
gpu: disabled
helm: disabled
ingress: disabled
istio: disabled
jaeger: disabled
juju: disabled
knative: disabled
kubeflow: disabled
linkerd: disabled
metallb: disabled
metrics-server: enabled
prometheus: enabled
rbac: enabled
registry: disabled
storage: enabled
I'm facing different issues regarding prometheus:
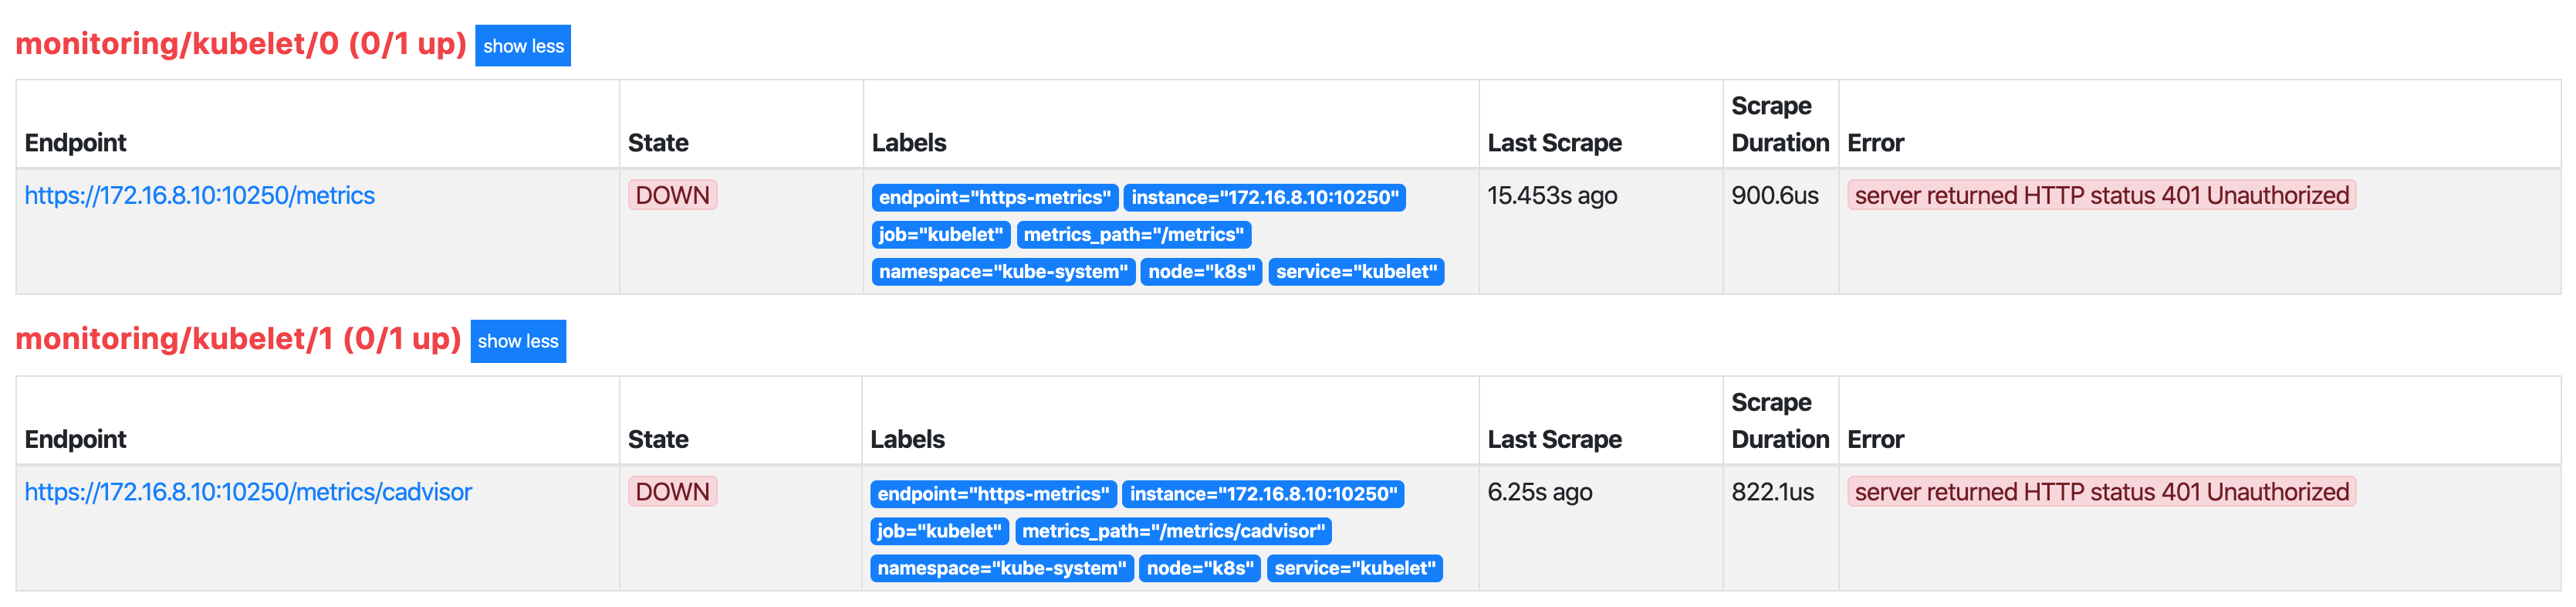
- Prometheus is not able to get the metrics from the kubelets:
401 Unauthorized
It's independent of having ´RBAC´ enabled or not.
- Different kind of RBAC issue.
e.g. Podprometheus-k8s-0is not able to scrape other namespaces because the appropriate right is missing. As an example the Helm chart of ´vernemq´ could be used:
# Default values for vernemq.
# This is a YAML-formatted file.
# Declare variables to be passed into your templates.

replicaCount: 1

image:
  repository: vernemq/vernemq
  tag: 1.10.1
  pullPolicy: IfNotPresent

nameOverride: ""
fullnameOverride: ""

serviceMonitor:
  create: true

service:
  # NodePort - Listen to a port on nodes and forward to the service.
  # ClusterIP - Listen on the service internal to the cluster only.
  # LoadBalancer - Create a LoadBalancer in the cloud provider and forward to the service.
  type: ClusterIP
#  clusterIP: 10.1.2.4
#  externalIPs: []
#  loadBalancerIP: 10.1.2.4
#  loadBalancerSourceRanges: []
  mqtt:
    enabled: true
    port: 1883
    # This is the port used by nodes to expose the service
    nodePort: 1883
  mqtts:
    enabled: false
    port: 8883
    # This is the port used by nodes to expose the service
    nodePort: 8883
  ws:
    enabled: false
    port: 8080
    # This is the port used by nodes to expose the service
    nodePort: 8080
  annotations: {}
  labels: {}

## VerneMQ resources requests and limits
## Ref: http://kubernetes.io/docs/user-guide/compute-resources
resources: {}
  ## We usually recommend not to specify default resources and to leave this as a conscious
  ## choice for the user. This also increases chances charts run on environments with little
  ## resources, such as Minikube. If you do want to specify resources, uncomment the following
  ## lines, adjust them as necessary, and remove the curly braces after 'resources:'.
#  limits:
#    cpu: 500m
#    memory: 128Mi
#  requests:
#    cpu: 200m
#    memory: 64Mi

## Node labels for pod assignment
## Ref: https://kubernetes.io/docs/concepts/configuration/assign-pod-node/#nodeselector
nodeSelector: {}

## Node tolerations for pod assignment
## Ref: https://kubernetes.io/docs/concepts/configuration/assign-pod-node/#taints-and-tolerations-beta-feature
tolerations: []

## Pod affinity
## Ref: https://kubernetes.io/docs/concepts/configuration/assign-pod-node/#affinity-and-anti-affinity
podAntiAffinity: soft

securityContext:
  runAsUser: 10000
  runAsGroup: 10000
  fsGroup: 10000

## If RBAC is enabled on the cluster,VerneMQ needs a service account
## with permissisions sufficient to list pods
rbac:
  create: true
  serviceAccount:
    create: true
    ## Service account name to be used.
    ## If not set and serviceAccount.create is true a name is generated using the fullname template.
#    name:

persistentVolume:
  ## If true, VerneMQ will create/use a Persistent Volume Claim
  ## If false, use local directory
  enabled: enable

  ## VerneMQ data Persistent Volume access modes
  ## Must match those of existing PV or dynamic provisioner
  ## Ref: http://kubernetes.io/docs/user-guide/persistent-volumes/
  accessModes:
    - ReadWriteOnce

  ## VerneMQ data Persistent Volume size
  size: 1Gi

  ## VerneMQ data Persistent Volume Storage Class
  ## If defined, storageClassName: <storageClass>
  ## If set to "-", storageClassName: "", which disables dynamic provisioning
  ## If undefined (the default) or set to null, no storageClassName spec is
  ##   set, choosing the default provisioner.  (gp2 on AWS, standard on
  ##   GKE, AWS & OpenStack)
#  storageClass: ""

  ## Annotations for Persistent Volume Claim
  annotations: {}

# A list of secrets and their paths to mount inside the pod
# This is useful for mounting certificates for security (tls)
secretMounts: []
#  - name: vernemq-certificates
#    secretName: vernemq-certificates-secret
#    path: /etc/ssl/vernemq

statefulset:
  ## Start and stop pods in Parallel or OrderedReady (one-by-one.)  Note - Can not change after first release.
  ## Ref: https://kubernetes.io/docs/tutorials/stateful-application/basic-stateful-set/#pod-management-policy
  podManagementPolicy: OrderedReady
  ## Statefulsets rolling update update strategy
  ## Ref: https://kubernetes.io/docs/tutorials/stateful-application/basic-stateful-set/#rolling-update
  updateStrategy: RollingUpdate
  ## Configure how much time VerneMQ takes to move offline queues to other nodes
  ## Ref: https://vernemq.com/docs/clustering/#detailed-cluster-leave-case-a-make-a-live-node-leave
  terminationGracePeriodSeconds: 60
  ## Liveness and Readiness probe values
  ## Ref: https://kubernetes.io/docs/tasks/configure-pod-container/configure-liveness-readiness-probes
  livenessProbe:
    initialDelaySeconds: 90
    periodSeconds: 10
    timeoutSeconds: 5
    successThreshold: 1
    failureThreshold: 3
  readinessProbe:
    initialDelaySeconds: 90
    periodSeconds: 10
    timeoutSeconds: 5
    successThreshold: 1
    failureThreshold: 3
  podAnnotations:
    prometheus.io/scrape: "true"
    prometheus.io/port: "8888"
  annotations: {}
  labels: {}

## VerneMQ settings

additionalEnv:
  - name: DOCKER_VERNEMQ_ALLOW_REGISTER_DURING_NETSPLIT
    value: "on"
  - name: DOCKER_VERNEMQ_ALLOW_PUBLISH_DURING_NETSPLIT
    value: "on"
  - name: DOCKER_VERNEMQ_ALLOW_SUBSCRIBE_DURING_NETSPLIT
    value: "on"
  - name: DOCKER_VERNEMQ_ALLOW_UNSUBSCRIBE_DURING_NETSPLIT
    value: "on"
  - name: DOCKER_VERNEMQ_ACCEPT_EULA
    value: "yes"
  - name: DOCKER_VERNEMQ_ALLOW_ANONYMOUS
    value: "on"
#  - name: DOCKER_VERNEMQ_MAX_CLIENT_ID_SIZE
#    value: "100"
#  - name: DOCKER_VERNEMQ_MAX_ONLINE_MESSAGES
#    value: "10000"
#  - name: DOCKER_VERNEMQ_MAX_OFFLINE_MESSAGES
#    value: "-1"
#  - name: DOCKER_VERNEMQ_LISTENER__SSL__CAFILE
#    value: "/etc/ssl/vernemq/tls.crt"
#  - name: DOCKER_VERNEMQ_LISTENER__SSL__CERTFILE
#    value: "/etc/ssl/vernemq/tls.crt"
#  - name: DOCKER_VERNEMQ_LISTENER__SSL__KEYFILE
#    value: "/etc/ssl/vernemq/tls.key"
- Most of the default Kubernetes dashboards are empty. Especially the ones which should contain pod metrics as well as all of the charts with network metrics.
Haven't tried what happen if I install the metrics-server and prometheus (operator) by my self.
 dannyyy
All 8 comments
Hi @dannyyy
I don't know if that will resolve your problem but I thought I will let you know what worked for me. I just installed snap of microk8s on my laptop running 18.04. Grafana dashboard is populating OK, I enabled the following addons:
$ microk8s.status | grep enabled
dashboard: enabled
dns: enabled
metrics-server: enabled
prometheus: enabled
storage: enabled
Hope this will help you.
 kowalczykb
on 9 Jan 2020
kowalczykb
on 9 Jan 2020
I noticed the same issue. For me the workaround was to change the kubelet servicemonitor to use http instead of https.
kubectl edit servicemonitor kubelet -n monitoring
  endpoints:
  - bearerTokenFile: /var/run/secrets/kubernetes.io/serviceaccount/token
    honorLabels: true
    interval: 30s
    port: http-metrics
    scheme: http
    tlsConfig:
      insecureSkipVerify: true
  - bearerTokenFile: /var/run/secrets/kubernetes.io/serviceaccount/token
    honorLabels: true
    interval: 30s
    path: /metrics/cadvisor
    port: http-metrics
    scheme: http
    tlsConfig:
      insecureSkipVerify: true
 acondrat
on 13 Jan 2020
acondrat
on 13 Jan 2020
I have run into this using Splunk to scrape the kubelet port on MicroK8s 1.17.
I Can confirm switch to scraping the http/unauth http port 10255 works.
Can see the kubelet has both open on my Ubuntu node:
netstat -tulpn
tcp6       0      0 :::10250                :::*                    LISTEN      -
tcp6       0      0 :::10255                :::*                    LISTEN      -
It's similar to an issue we see on AKS, described in this thread:
https://github.com/coreos/prometheus-operator/issues/926
I tried adding the workaround described with enabling webhook token auth in /var/snap/microk8s/current/args/, but it broke my Mirok8s node pretty bad, so I can settle for http, for now.
Is there a config that would allow us to use the https auth port and disable the http one altogether?
 matthewmodestino
on 16 Jan 2020
matthewmodestino
on 16 Jan 2020
@matthewmodestino would this help https://microk8s.io/docs/ports#auth ?
 ktsakalozos
on 22 Jan 2020
ktsakalozos
on 22 Jan 2020
the way I am understanding, my options are add my tokens to static file, or configure webook auth?
matthewmodestino
on 23 Jan 2020
@ktsakalozos https://microk8s.io/docs/ports#auth mentions that an "X509 client certificate is required" for port 10250 and gives the path to a CA file but I think we need a Client Cert + Key to pass to the prometheus servicemonitor tlsConfig certFile and keyFile (https://coreos.com/operators/prometheus/docs/latest/api.html#tlsconfig)? So it seems like microk8s should be generating a new client cert?
 eug48
on 12 Feb 2020
eug48
on 12 Feb 2020
@eug48 could you elaborate more on your suggestion? I am not using prometheus so please be as descriptive as possible. What needs to be created, which configuration should be changed etc. Many thanks.
ktsakalozos
on 12 Feb 2020
@ktsakalozos Sure, although I haven't tested this my theory is that Prometheus is trying to connect to the kubelet https port (10250) which requires client certificate authentication as stated in microk8s docs. So the microk8s prometheus addon should generate a client certificate and save its cert & key as a secret. Then the secret would be added to the PrometheusSpec of prometheus-prometheus.yaml so that the prometheus operator mounts it on prometheus pods, and then prometheus-serviceMonitorKubelet.yaml tlsConfig would reference the mounted cert & key. I'm still testing microk8s so port 10255 is acceptable, and unfortunately I don't have time to test or do a PR at the moment.
eug48
on 12 Feb 2020
Related issues
 tvansteenburgh
·
6Comments
tvansteenburgh
·
6Comments
 avarf
·
5Comments
avarf
·
5Comments
 carmine
·
3Comments
carmine
·
3Comments
 alphawolf1988
·
3Comments
alphawolf1988
·
3Comments
 arno01
·
4Comments
arno01
·
4Comments
Most helpful comment
I noticed the same issue. For me the workaround was to change the kubelet servicemonitor to use http instead of https.