Metrics-server: Metrics server issue with hostname resolution of kubelet and apiserver unable to communicate with metric-server clusterIP
Metric-server unable to resolve the hostname to scrape the metrics from kubelet.
E0903 1 manager.go:102] unable to fully collect metrics: [unable to fully scrape metrics from source kubelet_summary:<hostname>: unable to fetch metrics from Kubelet <hostname> (<hostname>): Get https://<hostname>:10250/stats/summary/: dial tcp: lookup <hostname> on 10.96.0.10:53: no such host
I figured its not resolving the hostname from kubedns
and as mentioned in following issues: https://github.com/kubernetes-incubator/metrics-server/issues/105#issuecomment-412818944
and https://github.com/kubernetes-incubator/metrics-server/issues/97
I did try to edit kubectl -n kube-system edit deploy metrics-server But metrics-server pod entered the error state.
The describe apiservice v1beta1.metrics.k8s.io have message:
no response from https://10.101.248.96:443: Get https://10.101.248.96:443: Proxy Error ( Connection refused )
10.101.248.96 being the clusterIP of the metric-server.
 vikranttkamble
All 73 comments
@vikranttkamble you can try --kubelet-preferred-address-types InternalIP,Hostname,InternalDNS,ExternalDNS,ExternalIP
 MIBc
on 3 Sep 2018
MIBc
on 3 Sep 2018
I'm having the same issue. +1
 damascenorakuten
on 3 Sep 2018
damascenorakuten
on 3 Sep 2018
I think the main problem is that the hostname resolution is being performed through the internal DNS server (which is set by default to the pod where the metrics-server runs in). That server contains the pods/services entries, but not the cluster-nodes ones. AFAIK the cluster nodes are not in that scope so they can't be resolved via that DNS. The InternalIP should be queried from the api instead
 juan-vg
on 3 Sep 2018
juan-vg
on 3 Sep 2018
The solution proposed by @MIBc works. Change the metrics-server-deployment.yaml file and add:
command:
- /metrics-server
- --kubelet-preferred-address-types=InternalIP
The metrics-server is now able to talk to the node (It was failing before because it could not resolve the hostname of the node). There's something strange happening though, I can see the metrics now from HPA but it shows an error in the logs:
E0903 11:04:45.914111 1 reststorage.go:98] unable to fetch pod metrics for pod default/my-nginx-84c58b9888-whg8r: no metrics known for pod "default/my-nginx-84c58b9888-whg8r"
I and Vikrant is working same servers, We are now able to edit Metric Server from below command.
kubectl -n kube-system edit deploy metrics-server
But we are facing issues with proxy issues.
$ kubectl describe apiservice v1beta1.metrics.k8s.io
Name: v1beta1.metrics.k8s.io
Namespace:
Labels: <none>
Annotations: <none>
API Version: apiregistration.k8s.io/v1
Kind: APIService
Metadata:
Creation Timestamp: 2018-09-03T12:36:06Z
Resource Version: 985112
Self Link: /apis/apiregistration.k8s.io/v1/apiservices/v1beta1.metrics.k8s.io
UID: ed81fe44-af75-11e8-8333-ac162d793244
Spec:
Group: metrics.k8s.io
Group Priority Minimum: 100
Insecure Skip TLS Verify: true
Service:
Name: metrics-server
Namespace: kube-system
Version: v1beta1
Version Priority: 100
Status:
Conditions:
Last Transition Time: 2018-09-03T12:36:06Z
Message: no response from https://10.101.212.101:443: Get https://10.101.212.101:443: Proxy Error ( Connection refused )
Reason: FailedDiscoveryCheck
Status: False
Type: Available
Events: <none>
kubectl get --raw /apis/metrics.k8s.io/v1beta1/nodes
Error from server (ServiceUnavailable): the server is currently unable to handle the request
 amolredhat
on 3 Sep 2018
amolredhat
on 3 Sep 2018
In Metrics Servers we are found below logs.
E0903 15:36:38.239003 1 manager.go:102] unable to fully collect metrics: [unable to fully scrape metrics from source kubelet_summary:nvm250d00: unable to fetch metrics from Kubelet nvm250d00 (10.130.X.X): Get https://10.130.X.X:10250/stats/summary/: x509: cannot validate certificate for 10.130.X.X because it doesn't contain any IP SANs, unable to fully scrape metrics from source kubelet_summary:nvmbd1aow270d00: unable to fetch metrics from Kubelet
amolredhat
on 3 Sep 2018
It is OK when set the kubelet flag "--authorization-mode=AlwaysAllow", and metrics-server flag "--kubelet-insecure-tls".
MIBc
on 4 Sep 2018
I think it should authorize for metrics-server to access kubelet if authorization-mode=webhook.
MIBc
on 4 Sep 2018
We also got, SSL issue and get sock connection refused issue, and resolved with below conf parameters in metrics-server-deployment.yaml
containers:
- name: metrics-server
image: k8s.gcr.io/metrics-server-amd64:v0.2.1
command:
- /metrics-server
- --source=kubernetes.summary_api:''?useServiceAccount=true&kubeletHttps=true&kubeletPort=10250&insecure=true
- --requestheader-allowed-names=
We are currently facing proxy issue and working on it.
amolredhat
on 4 Sep 2018
@MIBc --kubelet-preferred-address-types InternalIP,Hostname,InternalDNS,ExternalDNS,ExternalIP this parameter is for proxy issue?
no response from https://10.101.248.96:443: Get https://10.101.248.96:443: Proxy Error ( Connection refused )
Also InternalIP we have to put IP or just the keep it InternalIP?
vikranttkamble
on 4 Sep 2018
@amolredhat The '--source' flag is unavailable right now (v0.3.0-alpha.1)
I (finally) got it to work by setting the following args:
        command:
        - /metrics-server
        - --kubelet-insecure-tls
        - --kubelet-preferred-address-types=InternalIP
It works like a charm!
juan-vg
on 4 Sep 2018
@juan-vg awesome, this also works for me too (metrics-server-amd64:v.0.3.0 on k8s 1.10.3). Btw, so as not to duplicate the entrypoint set in the Dockerfile, consider using args: instead:
args:
- --kubelet-insecure-tls
- --kubelet-preferred-address-types=InternalIP
 kaiterramike
on 5 Sep 2018
kaiterramike
on 5 Sep 2018
If you're going to use InternalIP, you should probably set up your node's serving certs to list the IP as an alternative name. You generally don't want to pass kubelet-insecure-tls except in testing setups.
 DirectXMan12
on 5 Sep 2018
DirectXMan12
on 5 Sep 2018
This seems to be a blocking issue for 0.3.0 when running a kops deployment on AWS using a private network topology.
dial tcp: lookup ip-x-x-x-x.us-west-2.compute.internal on 100.64.0.10:53: no such host
Naturally kubedns can't resolve that hostname. I tried setting dnsPolicy: Default in the metrics-server deployment, which skirts the DNS issue, but then I see this:
x509: certificate signed by unknown authority
Not really sure what to do with that. I don't want to start monkeying with my node's certs without knowing exactly what I'm fixing. For now I've had to revert to metrics-server 0.2.1.
 wilsonjackson
on 7 Sep 2018
wilsonjackson
on 7 Sep 2018
You're the second person to mention issues with kops (https://github.com/kubernetes-incubator/metrics-server/issues/133), so I'm starting to think that kops sets up its certs differently than expected. Basically, the issue is that whatever the kops kubelet serving certs are, they aren't signed by the default kubernetes CA. Can we maybe get a kops maintainer in here to comment?
DirectXMan12
on 10 Sep 2018
@wilsonjackson @DirectXMan12
Observed because of proxy, request was not serving Internally, We Configured proxy server on one of the master server with NoProxy configuration for Internal IPs.
And it Worked !!
Also, we changed some parameters in kubernetes/manifests/kube-apiserver.yaml
```
apiVersion: v1
kind: Pod
metadata:
annotations:
scheduler.alpha.kubernetes.io/critical-pod: ""
creationTimestamp: null
labels:
component: kube-apiserver
tier: control-plane
name: kube-apiserver
namespace: kube-system
spec:
containers:
- command:
- kube-apiserver
- --authorization-mode=Node,RBAC
#- --authorization-mode=AlwaysAllow
#- --kubelet_tls_verify=True - --advertise-address=MASTERIP
- --allow-privileged=true
- --client-ca-file=/etc/kubernetes/pki/ca.crt
#- --disable-admission-plugins=
# https://github.com/kubernetes/website/issues/6012, https://kubernetes.io/docs/reference/command-line-tools-reference/kube-apiserver/ - --enable-admission-plugins=NodeRestriction,DefaultStorageClass,PersistentVolumeClaimResize,PersistentVolumeLabel
- --enable-bootstrap-token-auth=true
- --etcd-cafile=/etc/kubernetes/pki/etcd/ca.crt
- --etcd-certfile=/etc/kubernetes/pki/apiserver-etcd-client.crt
- --etcd-keyfile=/etc/kubernetes/pki/apiserver-etcd-client.key
- --etcd-servers=https://127.0.0.1:2379
- --insecure-port=0
- --kubelet-client-certificate=/etc/kubernetes/pki/apiserver-kubelet-client.crt
- --kubelet-client-key=/etc/kubernetes/pki/apiserver-kubelet-client.key
- --kubelet-preferred-address-types=InternalIP,ExternalIP,Hostname
- --proxy-client-cert-file=/etc/kubernetes/pki/front-proxy-client.crt
- --proxy-client-key-file=/etc/kubernetes/pki/front-proxy-client.key
- --requestheader-allowed-names=
- --requestheader-client-ca-file=/etc/kubernetes/pki/front-proxy-ca.crt
amolredhat
on 10 Sep 2018
I temporary fix this by edit metric-service deployemnt add this cofnig unser Deployemnt.spec.template.spec
hostAliases:
- hostnames:
- k8s-master1
ip: xxxxx
- hostnames:
- k8s-node1
ip: yyyyy
- hostnames:
- k8s-node2
ip: zzzzz
 724399396
on 14 Sep 2018
724399396
on 14 Sep 2018
Obviously the issue in
lookup <hostname-ip> in <dns-service-ip>..... no such host
In my case coreDNS is using for cluster DNS resolutions.
By default coreDNS ( in my case deployed with Kubespray) is set only for services name resolution and not pods/nodes.
Then we could look at default config for coreDNS
kind: ConfigMap
metadata: name: coredns
namespace: kube-system
data: Corefile: |
.:53 {
errors
log stdout
health
kubernetes cluster.local {
cidrs 10.3.0.0/24
}
proxy . /etc/resolv.conf
cache 30
}
This option proxy . /etc/resolv.conf in general is meaning that your DNS service will use your external nameserver (in my case there were defined external nameservers) for node name resolution.
So, yes, I've looked in my DNS logs and found that my DNS were received that requests.
Eventually, I've just added my node's hostnames records to my external DNS service and that's it.
Metrics are collecting successfully.
 Demon-DK
on 19 Sep 2018
Demon-DK
on 19 Sep 2018
Awesome. I'm going to close this issue, but feel free to ping me if you think it's not solved yet.
DirectXMan12
on 24 Sep 2018
Obviously the issue in
lookup <hostname-ip> in <dns-service-ip>..... no such hostIn my case coreDNS is using for cluster DNS resolutions.
By default coreDNS ( in my case deployed with Kubespray) is set only for services name resolution and not pods/nodes.Then we could look at default config for coreDNS
kind: ConfigMap metadata: name: coredns namespace: kube-system data: Corefile: | .:53 { errors log stdout health kubernetes cluster.local { cidrs 10.3.0.0/24 } proxy . /etc/resolv.conf cache 30 }This option
proxy . /etc/resolv.confin general is meaning that your DNS service will use your external nameserver (in my case there were defined external nameservers) for node name resolution.So, yes, I've looked in my DNS logs and found that my DNS were received that requests.
Eventually, I've just added my node's hostnames records to my external DNS service and that's it.
Metrics are collecting successfully.
Hi, I'm using kube-dns instead of coredns, and I have my node's /etc/hosts set properly, and it still fails:
E0926 11:30:18.620009 1 manager.go:102] unable to fully collect metrics: unable to fully scrape metrics from source kubelet_summary:kube: unable to fetch metrics from Kubelet kube (kube): Get https://kube:10250/stats/summary/: dial tcp: lookup kube on 10.96.0.10:53: no such host
 kidlj
on 26 Sep 2018
kidlj
on 26 Sep 2018
显然问题在于
lookup <hostname-ip> in <dns-service-ip>..... no such host就我而言,coreDNS用于群集DNS解析。
默认情况下,coreDNS(在我的情况下使用Kubespray部署)仅设置用于服务名称解析而不是pods / nodes。然后我们可以查看coreDNS的默认配置
kind: ConfigMap metadata: name: coredns namespace: kube-system data: Corefile: | .:53 { errors log stdout health kubernetes cluster.local { cidrs 10.3.0.0/24 } proxy . /etc/resolv.conf cache 30 }此选项
proxy . /etc/resolv.conf通常意味着您的DNS服务将使用您的外部名称服务器(在我的情况下,已定义外部名称服务器)来进行节点名称解析。所以,是的,我查看了我的DNS日志,发现我的DNS收到了请求。
最后,我刚刚将我的节点的主机名记录添加到我的外部DNS服务中,就是这样。
度量标准已成功收集。
The host uses /etc/hosts to parse. How to handle it better?
 xiaotian45123
on 27 Sep 2018
xiaotian45123
on 27 Sep 2018
coredns,并且我已正确设置节点的/ etc / hosts,但它仍然失败:
问题解决了吗?
xiaotian45123
on 27 Sep 2018
Hi, I'm using kube-dns instead of coredns, and I have my node's /etc/hosts set properly, and it still fails:
E0926 11:30:18.620009 1 manager.go:102] unable to fully collect metrics: unable to fully scrape metrics from source kubelet_summary:kube: unable to fetch metrics from Kubelet kube (kube): Get https://kube:10250/stats/summary/: dial tcp: lookup kube on 10.96.0.10:53: no such host
Hi,
I'd recommend just start with making things more clear
$ kubectl exec -it -n <metrics-server-namespace> metrics-server-xxxx -- sh
/ # nslookup kube
** because in your logs requests are making to https://kube:<port>/bla/bla/bla
I can assume your nslookup request will fail.
If I right you have to investigate your cluster DNS settings and then this is not related metrics-server issue.
Demon-DK
on 27 Sep 2018
If you're going to use InternalIP, you should probably set up your node's serving certs to list the IP as an alternative name. You generally don't want to pass
kubelet-insecure-tlsexcept in testing setups.
@DirectXMan12 How to config node using two hostnames?
 TracyBin
on 10 Oct 2018
TracyBin
on 10 Oct 2018
@originsmike Another problem after modify tls and internalIP
[root@192 ~]# docker logs -f fa55e7f7343a
I1010 10:40:01.108023 1 serving.go:273] Generated self-signed cert (apiserver.local.config/certificates/apiserver.crt, apiserver.local.config/certificates/apiserver.key)
[restful] 2018/10/10 10:40:32 log.go:33: [restful/swagger] listing is available at https://:443/swaggerapi
[restful] 2018/10/10 10:40:32 log.go:33: [restful/swagger] https://:443/swaggerui/ is mapped to folder /swagger-ui/
I1010 10:40:33.308883 1 serve.go:96] Serving securely on [::]:443
I1010 10:40:33.609544 1 logs.go:49] http: TLS handshake error from 172.20.0.1:49456: EOF
E1010 10:41:02.208299 1 manager.go:102] unable to fully collect metrics: [unable to fully scrape metrics from source kubelet_summary:master: unable to fetch metrics from Kubelet master (192.168.8.184): request failed - "403 Forbidden", response: "Forbidden (user=system:serviceaccount:kube-system:metrics-server, verb=get, resource=nodes, subresource=stats)", unable to fully scrape metrics from source kubelet_summary:node: unable to fetch metrics from Kubelet node (192.168.8.185): request failed - "403 Forbidden", response: "Forbidden (user=system:serviceaccount:kube-system:metrics-server, verb=get, resource=nodes, subresource=stats)"]
E1010 10:41:32.116815 1 manager.go:102] unable to fully collect metrics: [unable to fully scrape metrics from source kubelet_summary:node: unable to fetch metrics from Kubelet node (192.168.8.185): request failed - "403 Forbidden", response: "Forbidden (user=system:serviceaccount:kube-system:metrics-server, verb=get, resource=nodes, subresource=stats)", unable to fully scrape metrics from source kubelet_summary:master: unable to fetch metrics from Kubelet master (192.168.8.184): request failed - "403 Forbidden", response: "Forbidden (user=system:serviceaccount:kube-system:metrics-server, verb=get, resource=nodes, subresource=stats)"]
I am facing bit different issue here. Don't know if it is metrics server problem or api server. But thought of posting here. Please see below command output and logs and let me know whts wrong.
I believe ApiServer is not able to contact metrics-server over internal IPs.
# kubectl -n kube-system describe apiservice v1beta1.metrics.k8s.io
Name: v1beta1.metrics.k8s.io
Namespace:
Labels:
Annotations: kubectl.kubernetes.io/last-applied-configuration:
{"apiVersion":"apiregistration.k8s.io/v1beta1","kind":"APIService","metadata":{"annotations":{},"name":"v1beta1.metrics.k8s.io"},"spec":{"...
API Version: apiregistration.k8s.io/v1
Kind: APIService
Metadata:
Creation Timestamp: 2018-10-20T16:10:05Z
Resource Version: 638754
Self Link: /apis/apiregistration.k8s.io/v1/apiservices/v1beta1.metrics.k8s.io
UID: 9b8e655c-d482-11e8-9794-0050569160a8
Spec:
Group: metrics.k8s.io
Group Priority Minimum: 100
Insecure Skip TLS Verify: true
Service:
Name: metrics-server
Namespace: kube-system
Version: v1beta1
Version Priority: 100
Status:
Conditions:
Last Transition Time: 2018-10-20T16:10:05Z
Message: no response from https://10.99.121.153:443: Get https://10.99.121.153:443: dial tcp 10.99.121.153:443: connect: no route to host
Reason: FailedDiscoveryCheck
Status: False
Type: Available
Events:
# kubectl -n kube-system get svc -o wide
NAME TYPE CLUSTER-IP EXTERNAL-IP PORT(S) AGE SELECTOR
kube-dns ClusterIP 10.96.0.10
kubernetes-dashboard NodePort 10.97.142.189
metrics-server ClusterIP 10.99.121.153
Logs from APIServer
E1020 17:56:51.069077 1 available_controller.go:311] v1beta1.metrics.k8s.io failed with: Get https://10.99.121.153:443: dial tcp 10.99.121.153:443: connect: no route to host
I1020 17:56:52.046598 1 controller.go:105] OpenAPI AggregationController: Processing item v1beta1.metrics.k8s.io
E1020 17:56:52.046777 1 controller.go:111] loading OpenAPI spec for "v1beta1.metrics.k8s.io" failed with: failed to retrieve openAPI spec, http error: ResponseCode: 503, Body: service unavailable
, Header: map[Content-Type:[text/plain; charset=utf-8] X-Content-Type-Options:[nosniff]]
I1020 17:56:52.046803 1 controller.go:119] OpenAPI AggregationController: action for item v1beta1.metrics.k8s.io: Rate Limited Requeue.
E1020 17:56:52.250466 1 memcache.go:134] couldn't get resource list for metrics.k8s.io/v1beta1: the server is currently unable to handle the request
 shimpikk
on 20 Oct 2018
shimpikk
on 20 Oct 2018
I temporary fix this by edit metric-service deployemnt add this cofnig unser Deployemnt.spec.template.spec
hostAliases: - hostnames: - k8s-master1 ip: xxxxx - hostnames: - k8s-node1 ip: yyyyy - hostnames: - k8s-node2 ip: zzzzz
Would you please provide some details on how to do it?
shimpikk
on 23 Oct 2018
@DirectXMan12 ,
Do you have any inputs for the issue above?
I have created a cluster on centos 7.
shimpikk
on 23 Oct 2018
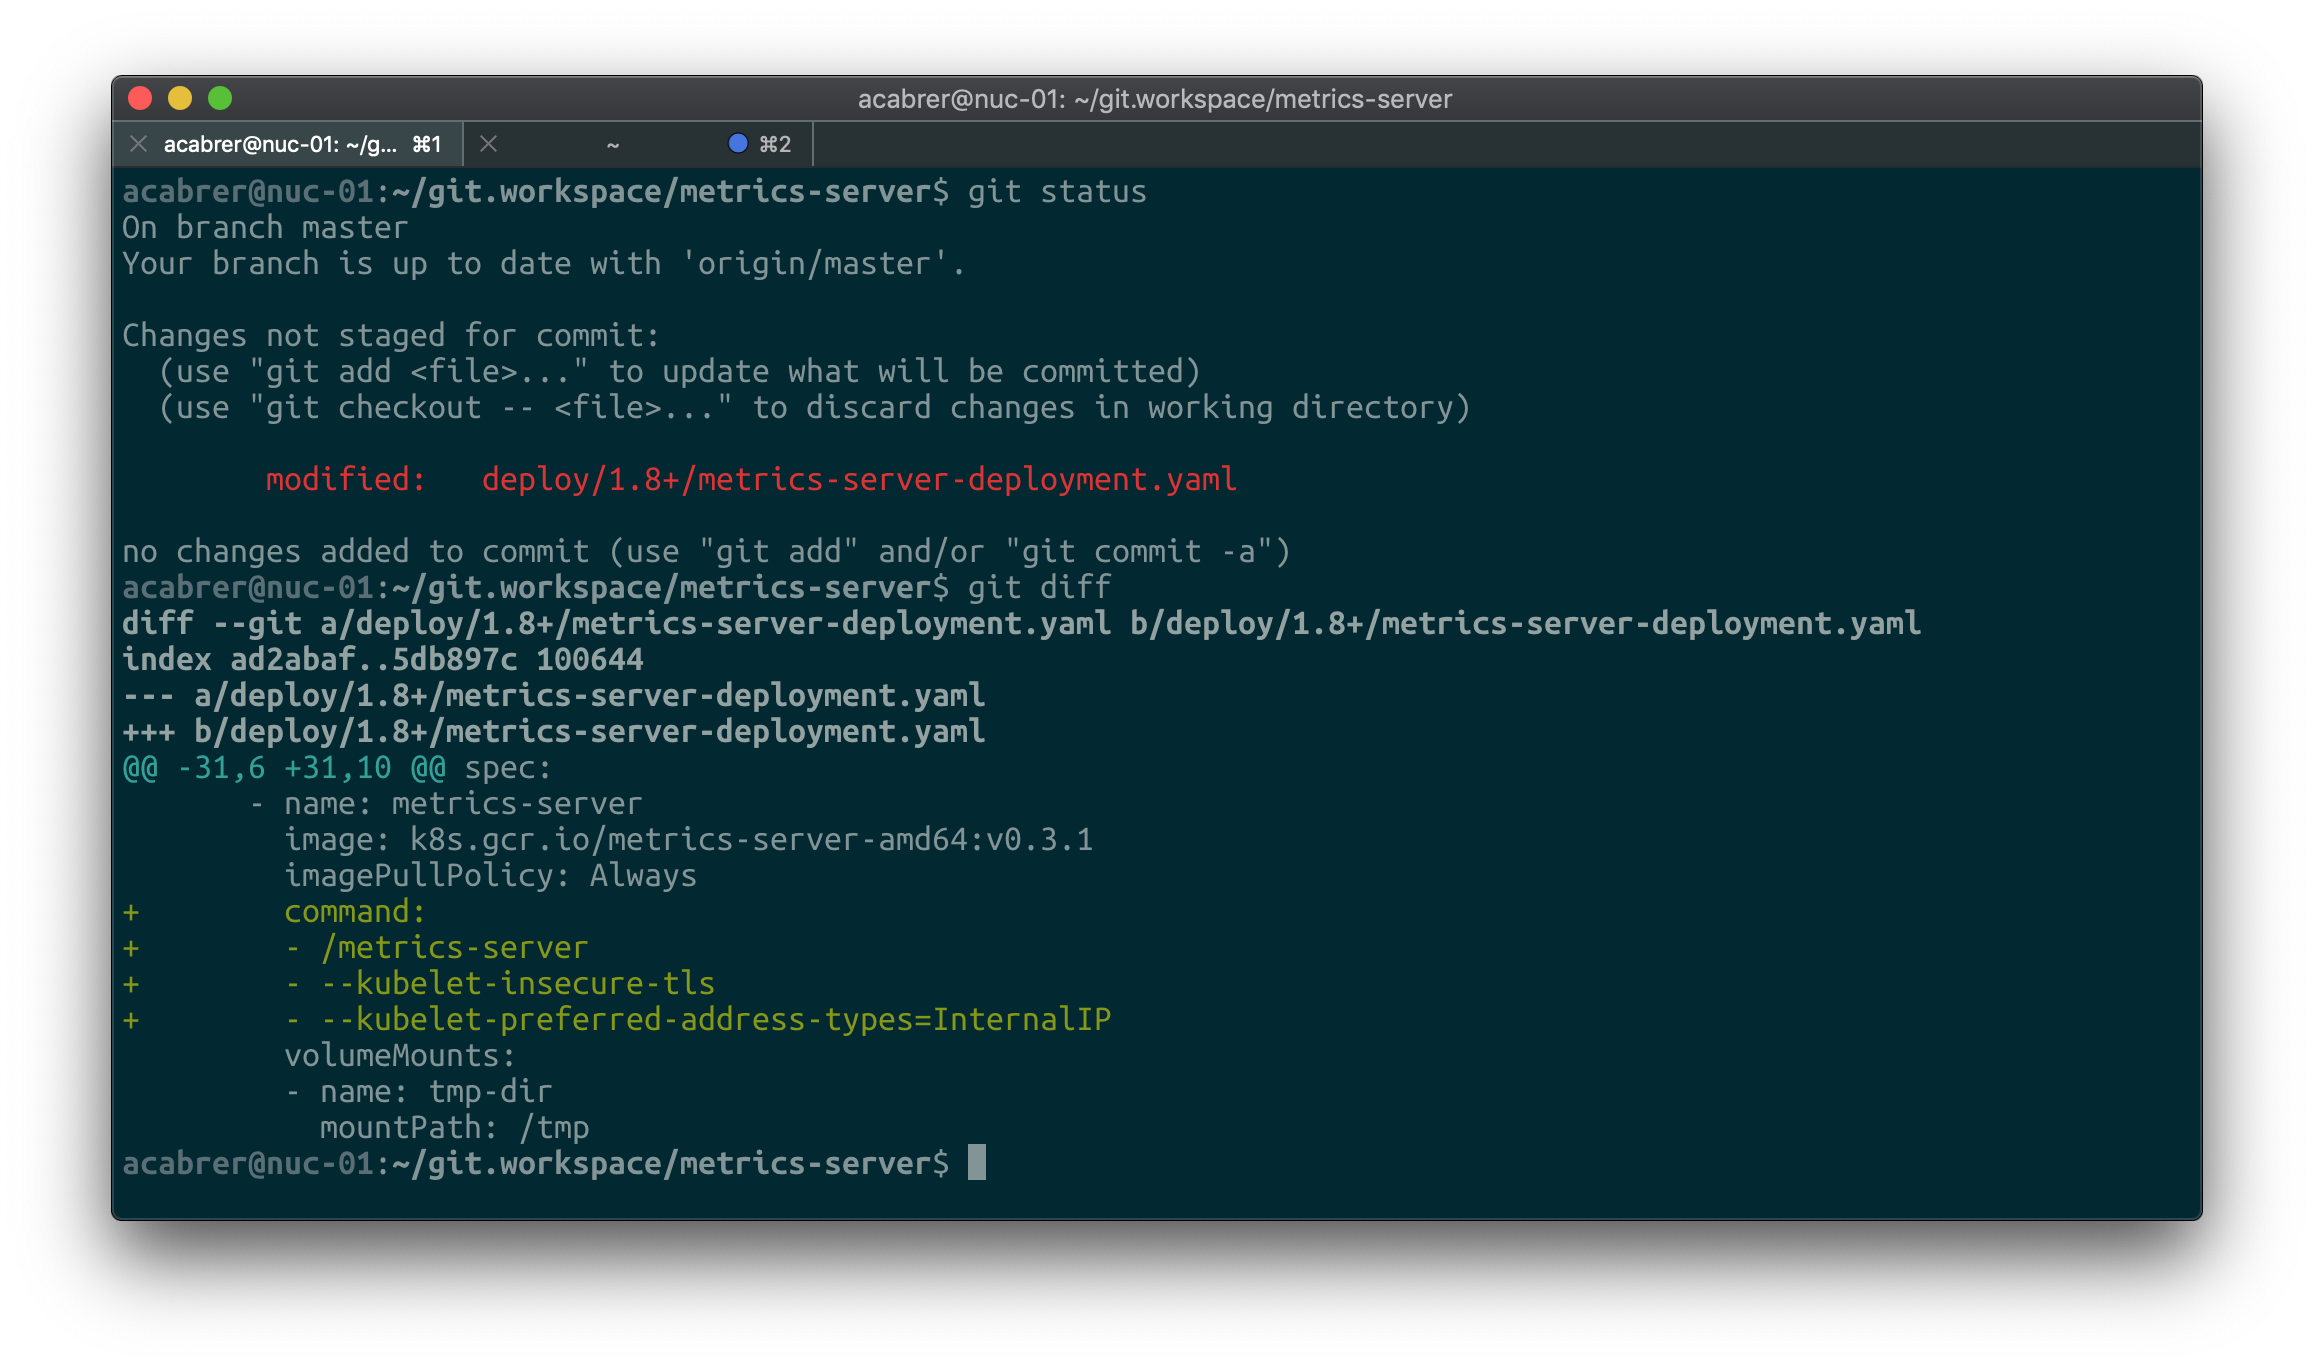
Hi I just want to confirm that I'm seeing the same issues with dns lookups for nodes with the below fix I was able to get metrics working.
 mrmcmuffinz
on 5 Nov 2018
mrmcmuffinz
on 5 Nov 2018
I want to clarify that my prior comment will only help show stats for nodes, pod stats are still broken.
kubectl -n kube-system logs metrics-server-7fbd9b8589-hv6qh
I1105 00:05:31.372311 1 serving.go:273] Generated self-signed cert (apiserver.local.config/certificates/apiserver.crt, apiserver.local.config/certificates/apiserver.key)
[restful] 2018/11/05 00:05:31 log.go:33: [restful/swagger] listing is available at https://:443/swaggerapi
[restful] 2018/11/05 00:05:31 log.go:33: [restful/swagger] https://:443/swaggerui/ is mapped to folder /swagger-ui/
I1105 00:05:31.939521 1 serve.go:96] Serving securely on [::]:443
E1105 00:05:34.537886 1 reststorage.go:144] unable to fetch pod metrics for pod istio-system/istio-egressgateway-5b765869bf-l86lv: no metrics known for pod
E1105 00:05:34.537910 1 reststorage.go:144] unable to fetch pod metrics for pod istio-system/istio-egressgateway-5b765869bf-xrg2f: no metrics known for pod
E1105 00:05:34.543566 1 reststorage.go:144] unable to fetch pod metrics for pod istio-system/istio-ingressgateway-69b597b6bd-qwq78: no metrics known for pod
E1105 00:05:34.549083 1 reststorage.go:144] unable to fetch pod metrics for pod istio-system/istio-policy-59b7f4ccd5-kllfx: no metrics known for pod
E1105 00:05:34.554026 1 reststorage.go:144] unable to fetch pod metrics for pod istio-system/istio-telemetry-7686cd76bd-j72qd: no metrics known for pod
E1105 00:05:34.554041 1 reststorage.go:144] unable to fetch pod metrics for pod istio-system/istio-telemetry-7686cd76bd-rvfgw: no metrics known for pod
E1105 00:05:34.567333 1 reststorage.go:144] unable to fetch pod metrics for pod istio-system/knative-ingressgateway-84d56577db-82sml: no metrics known for pod
E1105 00:05:34.567348 1 reststorage.go:144] unable to fetch pod metrics for pod istio-system/knative-ingressgateway-84d56577db-cnwsj: no metrics known for pod
E1105 00:05:34.567353 1 reststorage.go:144] unable to fetch pod metrics for pod istio-system/knative-ingressgateway-84d56577db-7rzjw: no metrics known for pod
E1105 00:05:34.567357 1 reststorage.go:144] unable to fetch pod metrics for pod istio-system/knative-ingressgateway-84d56577db-9956m: no metrics known for pod
E1105 00:05:34.567361 1 reststorage.go:144] unable to fetch pod metrics for pod istio-system/knative-ingressgateway-84d56577db-r95mj: no metrics known for pod
E1105 00:05:34.567366 1 reststorage.go:144] unable to fetch pod metrics for pod istio-system/knative-ingressgateway-84d56577db-cmlgg: no metrics known for pod
E1105 00:05:34.567370 1 reststorage.go:144] unable to fetch pod metrics for pod istio-system/knative-ingressgateway-84d56577db-m7kpx: no metrics known for pod
E1105 00:05:34.567374 1 reststorage.go:144] unable to fetch pod metrics for pod istio-system/knative-ingressgateway-84d56577db-tgwfc: no metrics known for pod
E1105 00:05:34.567378 1 reststorage.go:144] unable to fetch pod metrics for pod istio-system/knative-ingressgateway-84d56577db-r4dxm: no metrics known for pod
E1105 00:05:34.567382 1 reststorage.go:144] unable to fetch pod metrics for pod istio-system/knative-ingressgateway-84d56577db-82wg9: no metrics known for pod
E1105 00:05:49.560880 1 reststorage.go:144] unable to fetch pod metrics for pod istio-system/istio-egressgateway-5b765869bf-xrg2f: no metrics known for pod
E1105 00:05:49.560924 1 reststorage.go:144] unable to fetch pod metrics for pod istio-system/istio-egressgateway-5b765869bf-l86lv: no metrics known for pod
Snippet of logs from metrics pod.
mrmcmuffinz
on 5 Nov 2018
Hi, @DirectXMan12
I have a question when i use metrics-server, i use deployment yaml on the github, pod is running, but i found logs error, below is logs:
I1108 11:57:00.510244 1 serving.go:273] Generated self-signed cert (apiserver.local.config/certificates/apiserver.crt, apiserver.local.config/certificates/apiserver.key)
[restful] 2018/11/08 11:57:01 log.go:33: [restful/swagger] listing is available at https://:443/swaggerapi
[restful] 2018/11/08 11:57:01 log.go:33: [restful/swagger] https://:443/swaggerui/ is mapped to folder /swagger-ui/
I1108 11:57:01.067499 1 serve.go:96] Serving securely on [::]:443
E1108 11:58:01.061276 1 manager.go:102] unable to fully collect metrics: unable to fully scrape metrics from source kubelet_summary:master211: unable to fetch metrics from Kubelet master211 (master211): Get https://master211:10250/stats/summary/: dial tcp: lookup master211 on 10.96.0.10:53: server misbehaving
i update metrics-server deployment, add --kubelet-preferred-address-types=InternalDNS,InternalIP,ExternalDNS,ExternalIP,Hostname, but it also has error logs:
I1108 13:02:32.148090 1 serving.go:273] Generated self-signed cert (apiserver.local.config/certificates/apiserver.crt, apiserver.local.config/certificates/apiserver.key)
[restful] 2018/11/08 13:02:33 log.go:33: [restful/swagger] listing is available at https://:443/swaggerapi
[restful] 2018/11/08 13:02:33 log.go:33: [restful/swagger] https://:443/swaggerui/ is mapped to folder /swagger-ui/
I1108 13:02:33.243585 1 serve.go:96] Serving securely on [::]:443
E1108 13:03:33.228248 1 manager.go:102] unable to fully collect metrics: unable to fully scrape metrics from source kubelet_summary:master211: unable to fetch metrics from Kubelet master211 (10.33.46.211): Get https://10.33.46.211:10250/stats/summary/: x509: cannot validate certificate for 10.33.46.211 because it doesn't contain any IP SANs
E1108 13:03:56.325689 1 reststorage.go:129] unable to fetch node metrics for node "master211": no metrics known for node
then i add --kubelet-insecure-tls, metrics-server is ok.
If you're going to use InternalIP, you should probably set up your node's serving certs to list the IP as an alternative name. You generally don't want to pass kubelet-insecure-tls except in testing setups.
i don't understand where node's serving certs?
 pytimer
on 8 Nov 2018
pytimer
on 8 Nov 2018
@shimpikk sorry for replay so late.
change metrics-service deploy
kubectl edit deployment metrics-server -nkube-system
change spec.template.spec.containers.command to
command:
- /metrics-server
- --kubelet-insecure-tls
- --kubelet-preferred-address-types=InternalIP
add hostAlias under sepc.template.spec.containers
hostAliases:
- hostnames:
- k8s-master1
ip: xxxx
- hostnames:
- k8s-node1
ip: xxx
- hostnames:
- k8s-node2
ip: xxx
the name and ip should be your k8s cluster node hostname and ip.
724399396
on 8 Nov 2018
@pytimer any process that serves TLS (HTTPS) needs certificates to use to encrypt communications and verify identity as part of the TLS process. We call these certificates "serving certificates", because they're used to "serve" HTTPS. Since the node is serving HTTPS, it has serving certificates for this purpose. Certificates can have "names" embedded that help define the identity of the process serving the content. In the case of HTTP, these names (common name and alternative name) define what IP addresses, host names, etc the certificate is valid for.
DirectXMan12
on 8 Nov 2018
@DirectXMan12 Thanks for you reply.
I use kubeadm init to create Kubernetes cluster.
I check /etc/kubernetes/pki/apiserver.crt SANS, my ip and hostname already exists. Is it checking /etc/kubernetes/pki/apiserver.crt ?
{
"subject": {
"common_name": "kube-apiserver",
"names": [
"kube-apiserver"
]
},
"issuer": {
"common_name": "kubernetes",
"names": [
"kubernetes"
]
},
"serial_number": "8503464891842940653",
"sans": [
"master211",
"kubernetes",
"kubernetes.default",
"kubernetes.default.svc",
"kubernetes.default.svc.cluster.local",
"10.96.0.1",
"10.33.46.211"
],
"not_before": "2018-11-07T19:49:17Z",
"not_after": "2019-11-07T19:49:18Z",
"sigalg": "SHA256WithRSA",
"authority_key_id": "",
"subject_key_id": "",
...
}
- name: metrics-server
image: k8s.gcr.io/metrics-server-amd64:v0.3.1
command:
- /metrics-server
# - --metric-resolution=30s
- --kubelet-port=10255
# - --deprecated-kubelet-completely-insecure=true
- --kubelet-insecure-tls
- --kubelet-preferred-address-types=InternalIP
I1109 09:51:40.509482 1 serving.go:273] Generated self-signed cert (apiserver.local.config/certificates/apiserver.crt, apiserver.local.config/certificates/apiserver.key)
[restful] 2018/11/09 09:51:49 log.go:33: [restful/swagger] listing is available at https://:443/swaggerapi
[restful] 2018/11/09 09:51:49 log.go:33: [restful/swagger] https://:443/swaggerui/ is mapped to folder /swagger-ui/
I1109 09:51:49.811231 1 serve.go:96] Serving securely on [::]:443
E1109 09:52:49.350068 1 manager.go:102] unable to fully collect metrics: [unable to fully scrape metrics from source kubelet_summary:linuxea.node-3.com: unable to fetch metrics from Kubelet linuxea.node-3.com (10.10.240.143): Get https://10.10.240.143:10255/stats/summary/: dial tcp 10.10.240.143:10255: connect: connection refused, unable to fully scrape metrics from source kubelet_summary:linuxea.node-4.com: unable to fetch metrics from Kubelet linuxea.node-4.com (10.10.240.142): Get https://10.10.240.142:10255/stats/summary/: dial tcp 10.10.240.142:10255: connect: connection refused, unable to fully scrape metrics from source kubelet_summary:linuxea.node-1.com: unable to fetch metrics from Kubelet linuxea.node-1.com (10.10.240.202): Get https://10.10.240.202:10255/stats/summary/: dial tcp 10.10.240.202:10255: connect: connection refused, unable to fully scrape metrics from source kubelet_summary:linuxea.master-1.com: unable to fetch metrics from Kubelet linuxea.master-1.com (10.10.240.161): Get https://10.10.240.161:10255/stats/summary/: dial tcp 10.10.240.161:10255: connect: connection refused, unable to fully scrape metrics from source kubelet_summary:linuxea.node-2.com: unable to fetch metrics from Kubelet linuxea.node-2.com (10.10.240.203): Get https://10.10.240.203:10255/stats/summary/: dial tcp 10.10.240.203:10255: connect: connection refused]
E1109 09:53:49.407793 1 manager.go:102] unable to fully collect metrics: [unable to fully scrape metrics from source kubelet_summary:linuxea.master-1.com: unable to fetch metrics from Kubelet linuxea.master-1.com (10.10.240.161): Get https://10.10.240.161:10255/stats/summary/: dial tcp 10.10.240.161:10255: connect: connection refused, unable to fully scrape metrics from source kubelet_summary:linuxea.node-3.com: unable to fetch metrics from Kubelet linuxea.node-3.com (10.10.240.143): Get https://10.10.240.143:10255/stats/summary/: dial tcp 10.10.240.143:10255: connect: connection refused, unable to fully scrape metrics from source kubelet_summary:linuxea.node-4.com: unable to fetch metrics from Kubelet linuxea.node-4.com (10.10.240.142): Get https://10.10.240.142:10255/stats/summary/: dial tcp 10.10.240.142:10255: connect: connection refused, unable to fully scrape metrics from source kubelet_summary:linuxea.node-2.com: unable to fetch metrics from Kubelet linuxea.node-2.com (10.10.240.203): Get https://10.10.240.203:10255/stats/summary/: dial tcp 10.10.240.203:10255: connect: connection refused, unable to fully scrape metrics from source kubelet_summary:linuxea.node-1.com: unable to fetch metrics from Kubelet linuxea.node-1.com (10.10.240.202): Get https://10.10.240.202:10255/stats/summary/: dial tcp 10.10.240.202:10255: connect: connection refused]
E1109 09:54:49.509521 1 manager.go:102] unable to fully collect metrics: [unable to fully scrape metrics from source kubelet_summary:linuxea.node-2.com: unable to fetch metrics from Kubelet linuxea.node-2.com (10.10.240.203): Get https://10.10.240.203:10255/stats/summary/: dial tcp 10.10.240.203:10255: connect: connection refused, unable to fully scrape metrics from source kubelet_summary:linuxea.node-3.com: unable to fetch metrics from Kubelet linuxea.node-3.com (10.10.240.143): Get https://10.10.240.143:10255/stats/summary/: dial tcp 10.10.240.143:10255: connect: connection refused, unable to fully scrape metrics from source kubelet_summary:linuxea.node-4.com: unable to fetch metrics from Kubelet linuxea.node-4.com (10.10.240.142): Get https://10.10.240.142:10255/stats/summary/: dial tcp 10.10.240.142:10255: connect: connection refused, unable to fully scrape metrics from source kubelet_summary:linuxea.master-1.com: unable to fetch metrics from Kubelet linuxea.master-1.com (10.10.240.161): Get https://10.10.240.161:10255/stats/summary/: dial tcp 10.10.240.161:10255: connect: connection refused, unable to fully scrape metrics from source kubelet_summary:linuxea.node-1.com: unable to fetch metrics from Kubelet linuxea.node-1.com (10.10.240.202): Get https://10.10.240.202:10255/stats/summary/: dial tcp 10.10.240.202:10255: connect: connection refused]
I didn't solve this problem, it was really confusing.
 marksugar
on 9 Nov 2018
marksugar
on 9 Nov 2018
I'm adding a followup comment in case others had the same issues as I did. Here is how I got this working on a kubeadm bootstrapped cluster:
metrics server changes:
acabrer@nuc-01:~/git.workspace/metrics-server$ git diff
diff --git a/deploy/1.8+/metrics-server-deployment.yaml b/deploy/1.8+/metrics-server-deployment.yaml
index ad2abaf..bc5e718 100644
--- a/deploy/1.8+/metrics-server-deployment.yaml
+++ b/deploy/1.8+/metrics-server-deployment.yaml
@@ -31,7 +31,14 @@ spec:
- name: metrics-server
image: k8s.gcr.io/metrics-server-amd64:v0.3.1
imagePullPolicy: Always
+ command:
+ - /metrics-server
+ - --kubelet-insecure-tls
+ - --kubelet-preferred-address-types=InternalIP
volumeMounts:
- name: tmp-dir
mountPath: /tmp
-
+ hostAliases:
+ - hostnames:
+ - nuc-01
+ ip: 192.168.1.240
acabrer@nuc-01:~/git.workspace/metrics-server$ hostname -A
nuc-01.int.mrmcmuffinz.com nuc-01 nuc-01
acabrer@nuc-01:~/git.workspace/metrics-server$ hostname -I
192.168.1.240 172.17.0.1 172.16.0.1
deploy.sh:
#!/bin/sh
sudo kubeadm init --pod-network-cidr=172.16.0.0/12 --token-ttl=0 --apiserver-advertise-address=192.168.1.240
rm -f /home/acabrer/.kube/config
mkdir -p /home/acabrer/.kube
sudo cp -i /etc/kubernetes/admin.conf $HOME/.kube/config
sudo chown acabrer:acabrer /home/acabrer/.kube/config
kubectl taint nodes --all node-role.kubernetes.io/master-
kubectl apply -f /home/acabrer/scratch/rbac-kdd.yaml
kubectl apply -f /home/acabrer/scratch/calico.yaml
cd /home/acabrer/git.workspace/metrics-server
kubectl apply -f deploy/1.8+/
cd -
kubectl top commands...
acabrer@nuc-01:~$ kubectl top nodes
NAME CPU(cores) CPU% MEMORY(bytes) MEMORY%
nuc-01 368m 9% 2017Mi 6%
acabrer@nuc-01:~$ kubectl top pods --all-namespaces
NAMESPACE NAME CPU(cores) MEMORY(bytes)
kube-system calico-node-bfmkw 36m 54Mi
kube-system coredns-576cbf47c7-5r2v9 4m 8Mi
kube-system coredns-576cbf47c7-7pvx2 3m 8Mi
kube-system etcd-nuc-01 33m 34Mi
kube-system kube-apiserver-nuc-01 53m 406Mi
kube-system kube-controller-manager-nuc-01 67m 50Mi
kube-system kube-proxy-fkrb6 6m 11Mi
kube-system kube-scheduler-nuc-01 19m 12Mi
kube-system metrics-server-556f49c7c9-4smvt 2m 13Mi
Note: in kubeadm the insecure port is disabled by default, so don't try setting the kubelet port in the metrics server to 10255 as it will not work!
mrmcmuffinz
on 10 Nov 2018
@mrmcmuffinz
It’s really a headache. I have downgraded kubenetes to 1.11.1 to complete the kubectl top.
Previously, I used 1.12.2.
marksugar
on 11 Nov 2018
@LinuxEA-Mark I use 1.12.2, it works well, but you should update deployment yaml, add below args.
command:
- /metrics-server
- --kubelet-insecure-tls
- --kubelet-preferred-address-types=InternalIP
@pytimer it's probably using different cert for kubelets, or using self-signed certs. That one is for the main Kubernetes API server
DirectXMan12
on 13 Nov 2018
For future readers scratching their heads: on a Kubernetes 1.13 cluster deployed with kubeadm, metrics server started working once I updated the deployment spec with the following:
command:
- /metrics-server
- --kubelet-insecure-tls
- --kubelet-preferred-address-types=InternalIP
(After that, give it a few minutes before kubectl top actually has enough data to show anything, though.)
 jpetazzo
on 9 Dec 2018
jpetazzo
on 9 Dec 2018
... I'm starting to think that kops sets up its certs differently than expected. Basically, the issue is that whatever the kops kubelet serving certs are, they aren't signed by the default kubernetes CA. Can we maybe get a kops maintainer in here to comment?
@DirectXMan12 Not a kops maintainer but I've been debugging this on my own cluster. It seems to me that kops by default does not have webhook authorization turned on on kubelet. To get it to work I've had to do this, see https://github.com/kubernetes/kops/pull/6201 i.e. set --kubelet-insecure-tls and --kubelet-preferred-address-types ... but there are still TLS errors.
From my understanding if you have a service account and webhook authentication on kubelet, it should just work! And the TLS errors are because we have self-signed certs? I'm skeptical if setting the insecure flag is the right fix (certainly good for the short term though).
 itskingori
on 12 Dec 2018
itskingori
on 12 Dec 2018
@itskingori yeah, it should just work with webhook auth, assuming metrics-server can trust your Kubelet. Right now, that trust means that the kubelet's serving certs must be signed by the main cluster CA. We need someone to submit a to support a separate Kubelet CA, since some clusters use that.
EDIT: #183 implements the "separate kubelet CA" thing. Once it merges, that'll be a good way forward. Then we just have to convince cluster tools to use an actual CA for their kubelet serving certs.
DirectXMan12
on 21 Dec 2018
@itskingori and yes, the insecure flag is not a good long term solution (@jpetazzo)
DirectXMan12
on 21 Dec 2018
I was able to resolve the certificate issue without disabling TLS. With k8s version 1.13.1, I was able to generate new certs using https://kubernetes.io/docs/tasks/tls/managing-tls-in-a-cluster/ and openssl.
I generated the CSR and private key with openssl and passed that to the certificates API in K8S to approve and sign it. Then I downloaded the signed cert and put it in /var/lib/kublet/pki/ and added the kublet tls cert and key params to /etc/sysconfig/kubelet. And then obviously I had to restart the kubelet service. Now, port 10250 on each node has a K8S CA signed cert installed.
However, I did notice some deprecation warnings regarding using those params in the KUBELET_EXTRA_ARGS, I will investigate the alternate later as I didn't find a quick solution in my 10s of googling.
 nabheet
on 8 Jan 2019
nabheet
on 8 Jan 2019
@amolredhat The '--source' flag is unavailable right now (v0.3.0-alpha.1)
I (finally) got it to work by setting the following args:
command: - /metrics-server - --kubelet-insecure-tls - --kubelet-preferred-address-types=InternalIPIt works like a charm!
Also restart all coredns pods.
 teodorst
on 13 Jan 2019
teodorst
on 13 Jan 2019
@DirectXMan12 this problem still exists and usage of --kubelet-insecure-tls is discouraged. Furthermore, I don't found any guide how to deploy metrics-server "right way". Can you please reopen this issue until it is fixed by code or documentation?
 Bessonov
on 18 Jan 2019
Bessonov
on 18 Jan 2019
I am not sure the issue needs to be resolved here. I think the root cause is that when the node's kubelet is added to the cluster, a new self-signed cert is created by Kubernetes for use by the node's kubelet service. I think the solution might be to have the kubelet use certs signed by the cluster CA when the node joins a cluster.
I think this issue is related to this: https://github.com/kubernetes/kubernetes/issues/63164.
nabheet
on 18 Jan 2019
this is the issue still exist in kops, and I don't see any workaround specified above work at all. funny thing is it just work by --kubelet-insecure-tls for k8s v1.11.1 by v1.11.6 it does not work with it either.
 prageethw
on 25 Jan 2019
prageethw
on 25 Jan 2019
I also got the exactly problem with kops 1.11.0 (stable version) and k8s v1.11.6.
 vietwow
on 28 Jan 2019
vietwow
on 28 Jan 2019
this issue in KOPs due to some difference when a version upgrade from 1.10.0 to 1.11.0
refer
https://github.com/kubernetes/kops/pull/6201#pullrequestreview-196897146
prageethw
on 28 Jan 2019
If you deploying with OpenStack Magnum the kubernetes version can by configured with the labels parameter and kube_tag (https://docs.openstack.org/magnum/latest/user/#kube-tag), see available container images under https://hub.docker.com/r/openstackmagnum/kubernetes-apiserver/tags/
openstack coe cluster create kubernetes-cluster \
--cluster-template kubernetes-cluster-template \
--master-count 1 \
--node-count 2 \
--keypair mykey
--labels kube_tag=v1.13.4,cloud_provider_tag=1.13.1
 panticz
on 8 May 2019
panticz
on 8 May 2019
I was running metrics-server 0.2.7 on Kubernetes 1.10.11 with TLS option disabled. It was working fine. After K8s release update (1.13.5) and PodSecurityPolicy in place (Metrics-Server updated to 0.3.2) it has problems. Kubectl top command works. The HPA Pod is unable to collect the metrics. The K8s-Controller logs show the following error message:
Post https://10.244.0.1:443/apis/authorization.k8s.io/v1beta1/subjectaccessreviews: dial tcp 10.244.0.1:443: connect: connection refused\") has prevented the request from succeeding (get
pods.metrics.k8s.io)\n","stream":"stderr","time":"2019-06-19T17:39:15.441431233Z"}
Do I have to run the metrics-server with 'ROOT' privilege? Any feedback is appreciated.
 mathisub
on 20 Jun 2019
mathisub
on 20 Jun 2019
My issue was resolved by updating the hpa pod yaml with the correct syntax for v2beta2 version.
mathisub
on 26 Jun 2019
If you're going to use InternalIP, you should probably set up your node's serving certs to list the IP as an alternative name. You generally don't want to pass
kubelet-insecure-tlsexcept in testing setups.
@DirectXMan12 Hi, sorry to revive an old issue with a question like this - I agree with this approach as I try to have a keen eye on security, however, as a newbie to kubernetes, I don't know where I begin to configure this. Would you be kind enough to link me somewhere?
Hopefully this will help others who find this issue when Googling around too.
 silverbackdan
on 30 Jul 2019
silverbackdan
on 30 Jul 2019
@silverbackdan Hopefully I can help. I assume you already know about CSRs. You can start with https://kubernetes.io/docs/tasks/tls/managing-tls-in-a-cluster/#create-a-certificate-signing-request-object-to-send-to-the-kubernetes-api.
Once you approve and download the cert, put the private key from your CSR in /var/lib/kubelet/pki/kubelet.key and the cert in /var/lib/kubelet/pki/kubelet.crt. Then restart kubelet service.
service kubelet restart (or systemctl)
you are good to go.
nabheet
on 30 Jul 2019
Thanks very much for this info. kubectl get csr is a new one to me and that link is very helpful about CSRs - I know about them but not so much in the context outlined in that link.
Just to check, I'd be replacing the key and cert already at those paths because they do exist. I imagine they are just self-signed which is what is being used at the moment and therefore is seen as insecure?
silverbackdan
on 31 Jul 2019
Yes, that is correct. They are self-signed certs and you will be replacing them with certs signed by your Kubernetes cluster CA. I wish the kubeadm join command would do this but IIRC I think there is a chicken and egg problem here. I am not sure exactly how but for some reason "they" decided to not implement this replacement feature. I think there is a closed issue in the K8S repo regarding this too. I can try to find it if needed. But hopefully, you should be set now.
nabheet
on 31 Jul 2019
Also, I wonder if this would avoid the issue - https://kubernetes.io/docs/tasks/tls/certificate-rotation/.
nabheet
on 31 Jul 2019
Perhaps, specifically the --bootstrap-kubeconfig flag https://kubernetes.io/docs/tasks/tls/certificate-rotation/#understanding-the-certificate-rotation-configuration
I had to run this command to change the cert SANs for the API and to listen on different IPs
kubeadm init phase certs all \
--apiserver-advertise-address=0.0.0.0 \
--apiserver-cert-extra-sans=10.244.0.1,11.0.0.10,example.com
It'd have been nice if that command could also sign the cert with the cluster's CA, anyway, I see where things are going wrong now and can use your very helpful notes to take me further.
silverbackdan
on 31 Jul 2019
Nice! I was reading that same page too. There might be more learnings on the page you linked for me too. Queued for when I have some learning time. :-)
nabheet
on 31 Jul 2019
I have the same issue resolved by adding :
command:
- /metrics-server
- --kubelet-insecure-tls
- --kubelet-preferred-address-types=InternalIP
Whereas the metrics server now return only used ressources for The master node (always unknown for workers node).
NB. Deployment done with vagrant (hence kubebadm).
Please have you any hint to solve it
 AdelBouridah
on 29 Oct 2019
AdelBouridah
on 29 Oct 2019
I'm still getting the error, I'm using Kubespray v2.11.0 to deploy a Kubernetes v1.15.3 with the following instruction:
helm install stable/metrics-server --set args[0]="--kubelet-insecure-tls" --set args[1]="--kubelet-preferred-address-types=InternalIP" --name metrics-server
 electrocucaracha
on 8 Nov 2019
electrocucaracha
on 8 Nov 2019
The solution proposed by @MIBc works. Change the metrics-server-deployment.yaml file and add:
        command:
        - /metrics-server
        - --kubelet-preferred-address-types=InternalIP
The metrics-server is now able to talk to the node (It was failing before because it could not resolve the hostname of the node). There's something strange happening though, I can see the metrics now from HPA but it shows an error in the logs:
E0903 11:04:45.914111 1 reststorage.go:98] unable to fetch pod metrics for pod default/my-nginx-84c58b9888-whg8r: no metrics known for pod "default/my-nginx-84c58b9888-whg8r"
The solution proposed by @MIBc works. Change the metrics-server-deployment.yaml file and add:
command: - /metrics-server - --kubelet-preferred-address-types=InternalIPThe metrics-server is now able to talk to the node (It was failing before because it could not resolve the hostname of the node). There's something strange happening though, I can see the metrics now from HPA but it shows an error in the logs:
E0903 11:04:45.914111 1 reststorage.go:98] unable to fetch pod metrics for pod default/my-nginx-84c58b9888-whg8r: no metrics known for pod "default/my-nginx-84c58b9888-whg8r"
I just got the same situation on my metrics-server,unable to fetch pod metrics for pod default/xxxxxxxx: no metrics known for pod "default/xxxxxxxx" @damascenorakuten
Do you fix it already?
 carlylelu
on 12 Nov 2019
carlylelu
on 12 Nov 2019
@carlylelu appirence of this log does not mean that there is a problem, nor points to possible cause.
More info https://github.com/kubernetes-sigs/metrics-server/issues/349#issuecomment-550068449
This Issue is about host resolution. Example log dial tcp: lookup <hostname> on 10.96.0.10:53: no such host
 serathius
on 12 Nov 2019
serathius
on 12 Nov 2019
Got the same issue (host resolution) when installing server-metrics in a DO cluster. I think I did not have the issue a couple of days ago :(
 lucj
on 12 Nov 2019
lucj
on 12 Nov 2019
One small detail that may get overlooked, in case a proxy is used, that could be caused by forgetting to add the 10.0.0.0/8 to the no_proxy list.
 weshouman
on 19 Feb 2020
weshouman
on 19 Feb 2020
In recent versions of metrics-server, where there is no "command" or "metrics-server-deployment.yaml", the following helped me
- Open deployment editor
kubectl -n kube-system edit deploy metrics-server - Add a few args:
- args:
- --cert-dir=/tmp
- --secure-port=4443
- --v=2
- --kubelet-insecure-tls
- --kubelet-preferred-address-types=InternalIP
 veton
on 23 Apr 2020
veton
on 23 Apr 2020
@veton 's answer is the most on-point and up to date, thank you! 🙏
 progapandist
on 3 Jun 2020
progapandist
on 3 Jun 2020
In recent versions of metrics-server, where there is no "command" or "metrics-server-deployment.yaml", the following helped me
- Open deployment editor
kubectl -n kube-system edit deploy metrics-server- Add a few args:
- args: - --cert-dir=/tmp - --secure-port=4443 - --v=2 - --kubelet-insecure-tls - --kubelet-preferred-address-types=InternalIP
Thanks, that solved my problem too
 HisokaHous
on 27 Aug 2020
HisokaHous
on 27 Aug 2020
Adding --kubelet-preferred-address-types=InternalIP flag helped me to fix metrics-server 0.3.6 after enabling NodeLocal DNS Cache.
 xoxbet
on 7 Sep 2020
xoxbet
on 7 Sep 2020
I temporary fix this by edit metric-service deployemnt add this cofnig unser Deployemnt.spec.template.spec
      hostAliases:
      - hostnames:
        - k8s-master1
        ip: xxxxx
      - hostnames:
        - k8s-node1
        ip: yyyyy
      - hostnames:
        - k8s-node2
        ip: zzzzz
I tried this suggestion and it worked for me.
My problem:
All my nodes have same InternalIP (10.0.2.15) due to VirtualBox/NAT configuration so with --kubelet-preferred-address-types=InternalIP my metrics-server could only query it's own node. I then tried --kubelet-preferred-address-types=Hostname
but DNS was incorrectly resolving the hostname (when I used nslookup on the DNS server it returned an incorrect IP address so I don't know what is wrong with my configuration). There are other solutions to use a NodePort or a LoadBalancer but they don't seem applicable to my situation since the metric-server is already inside the cluster, and they are more complicated as well.
Here is my working yaml file:
metrics-server-components.zip
You can compare to the one in GitHub
Note: the IP addresses I used for the hostAliases are the ones that were assigned to the nodes for the pod network by Flannel, so they are reachable from all of the containers.
 edwardfberliner
on 27 Jan 2021
edwardfberliner
on 27 Jan 2021
[root@k8s-master1:~]# kubectl get svc -n kube-system -o wide
NAME TYPE CLUSTER-IP EXTERNAL-IP PORT(S) AGE SELECTOR
kube-dns ClusterIP 10.96.0.10
metrics-server ClusterIP 10.99.131.42
[root@k8s-master1:~]# kubectl describe apiservice v1beta1.metrics.k8s.io
Name: v1beta1.metrics.k8s.io
Namespace:
Labels:
Annotations:
API Version: apiregistration.k8s.io/v1
Kind: APIService
Metadata:
Creation Timestamp: 2021-01-14T05:44:07Z
Resource Version: 6313248
Self Link: /apis/apiregistration.k8s.io/v1/apiservices/v1beta1.metrics.k8s.io
UID: 09c2cee7-af53-4920-bd7e-1617c4068da3
Spec:
Group: metrics.k8s.io
Group Priority Minimum: 100
Insecure Skip TLS Verify: true
Service:
Name: metrics-server
Namespace: kube-system
Port: 443
Version: v1beta1
Version Priority: 100
Status:
Conditions:
Last Transition Time: 2021-01-14T05:44:07Z
Message: failing or missing response from https://10.99.131.42:443/apis/metrics.k8s.io/v1beta1: Get "https://10.99.131.42:443/apis/metrics.k8s.io/v1beta1": dial tcp 10.99.131.42:443: connect: connection refused
Reason: FailedDiscoveryCheck
Status: False
Type: Available
Events:
[root@k8s-master1:~]# kubectl top pods
Error from server (ServiceUnavailable): the server is currently unable to handle the request (get pods.metrics.k8s.io)
[root@k8s-master1:~]# kubectl logs -f -n kube-system metrics-server-69fbcb864b-jvkkr
[..........]
I0203 10:38:52.792663 1 round_trippers.go:443] GET https://k8s-master1:10250/stats/summary?only_cpu_and_memory=true 200 OK in 29 milliseconds
I0203 10:38:52.823497 1 round_trippers.go:443] GET https://k8s-node1:10250/stats/summary?only_cpu_and_memory=true 200 OK in 54 milliseconds
I0203 10:38:52.842695 1 round_trippers.go:443] GET https://k8s-node2:10250/stats/summary?only_cpu_and_memory=true 200 OK in 70 milliseconds
I0203 10:38:52.844152 1 scraper.go:168] ScrapeMetrics: time: 101.319542ms, nodes: 4, pods: 60
I0203 10:38:52.844195 1 server.go:138] ...Storing metrics...
I0203 10:38:52.844264 1 server.go:143] ...Cycle complete
[root@k8s-master1:~]# cat metrics-server-deployment.yaml
apiVersion: apps/v1
kind: Deployment
metadata:
name: metrics-server
namespace: kube-system
labels:
k8s-app: metrics-server
spec:
selector:
matchLabels:
k8s-app: metrics-server
template:
metadata:
name: metrics-server
labels:
k8s-app: metrics-server
spec:
serviceAccountName: metrics-server
volumes:
# mount in tmp so we can safely use from-scratch images and/or read-only containers
- name: tmp-dir
emptyDir: {}
containers:
- name: metrics-server
image: ip/library/metrics-server:v0.4.1
imagePullPolicy: IfNotPresent
args:
- --v=6
- --cert-dir=/tmp
- --secure-port=4443
- --kubelet-preferred-address-types=Hostname
- --kubelet-use-node-status-port
- --kubelet-insecure-tls
ports:
- name: main-port
containerPort: 4443
protocol: TCP
securityContext:
readOnlyRootFilesystem: true
runAsNonRoot: true
runAsUser: 1000
volumeMounts:
- name: tmp-dir
mountPath: /tmp
hostAliases:
- hostnames:
- k8s-master1
ip: 192.xx.x.x
- hostnames:
- k8s-node1
ip: 192.x.x.x
- hostnames:
- k8s-node2
ip: 192.x.x.x
- hostnames:
- k8s-node3
ip: 192.x.x.x
nodeSelector:
kubernetes.io/os: linux
 balainit
on 3 Feb 2021
balainit
on 3 Feb 2021
some other things to try:
verify that 192.x.x.x IP addresses are in pod network; check kube-controller-manager process: "--cluster-cidr=" option which was configured during kubeadm init with "--pod-network-cidr" option
verify that pod network was configured to use correct interface in each node (e.g. flanneld command has an "--iface option); I had to change my daemonset/kube-flannel-ds configuration to use the flannel (pod) network interface; otherwise it would default to an internal (VirtualBox) network interface
check your kube-proxy process; if you see "--hostname-override=...", try removing this argument from the daemonset/kube-proxy yaml configuration
try setting "- --enable-aggregator-routing=true" in kube-apiserver
edwardfberliner
on 3 Feb 2021
Related issues
 cdenneen
·
7Comments
cdenneen
·
7Comments
 GregSilverman
·
4Comments
GregSilverman
·
4Comments
 Rajat-0
·
5Comments
Rajat-0
·
5Comments
 gjmzj
·
7Comments
gjmzj
·
7Comments
 godomainz
·
6Comments
godomainz
·
6Comments
Most helpful comment
@amolredhat The '--source' flag is unavailable right now (v0.3.0-alpha.1)
I (finally) got it to work by setting the following args:
It works like a charm!