Mediapipe: Realtime video feed with slow model
Hello, I'm trying to achieve realtime video feed with slow model on Android (like mentioned in MediaPipe paper): I have a slow model which predictions I want to interpolate and a live video feed on which I want to draw predictions when they are available. At first when no predictions are available - draw nothing, then cache latest prediction and draw it.
I've tried multiple approaches, but seems like I don't understand some core concept.
Now my graph looks like this:
# MediaPipe graph that performs face detection with TensorFlow Lite on GPU.
# Used in the examples in
# mediapipie/examples/android/src/java/com/mediapipe/apps/facedetectiongpu and
# mediapipie/examples/ios/facedetectiongpu.

# Images on GPU coming into and out of the graph.
input_stream: "input_video"
output_stream: "output_video"

executor {
  name: "model_executor"
  type: "ThreadPoolExecutor"
  options {
    [mediapipe.ThreadPoolExecutorOptions.ext] { num_threads: 4 }
  }
}

# Throttles the images flowing downstream for flow control. It passes through
# the very first incoming image unaltered, and waits for
# TfLiteTensorsToDetectionsCalculator downstream in the graph to finish
# generating the corresponding detections before it passes through another
# image. All images that come in while waiting are dropped, limiting the number
# of in-flight images between this calculator and
# TfLiteTensorsToDetectionsCalculator to 1. This prevents the nodes in between
# from queuing up incoming images and data excessively, which leads to increased
# latency and memory usage, unwanted in real-time mobile applications. It also
# eliminates unnecessarily computation, e.g., a transformed image produced by
# ImageTransformationCalculator may get dropped downstream if the subsequent
# TfLiteConverterCalculator or TfLiteInferenceCalculator is still busy
# processing previous inputs.
node {
  calculator: "FlowLimiterCalculator"
  input_stream: "input_video"
  input_stream: "FINISHED:render_data"
  input_stream_info: {
    tag_index: "FINISHED"
    back_edge: true
  }
  output_stream: "throttled_input_video"
}

# Transforms the input image on GPU to a 128x128 image. To scale the input
# image, the scale_mode option is set to FIT to preserve the aspect ratio,
# resulting in potential letterboxing in the transformed image.
node: {
  executor: "model_executor"
  calculator: "ImageTransformationCalculator"
  input_stream: "IMAGE_GPU:throttled_input_video"
  output_stream: "IMAGE_GPU:transformed_input_video"
  output_stream: "LETTERBOX_PADDING:letterbox_padding"
  node_options: {
    [type.googleapis.com/mediapipe.ImageTransformationCalculatorOptions] {
      output_width: 256
      output_height: 256
    }
  }
}

# Converts the transformed input image on GPU into an image tensor stored as a
# TfLiteTensor.
node {
  executor: "model_executor"
  calculator: "TfLiteConverterCalculator"
  input_stream: "IMAGE_GPU:transformed_input_video"
  output_stream: "TENSORS_GPU:image_tensor"
}

# Runs a TensorFlow Lite model on GPU that takes an image tensor and outputs a
# vector of tensors representing, for instance, detection boxes/keypoints and
# scores.
node {
  executor: "model_executor"
  calculator: "TfLiteInferenceCalculator"
  input_stream: "TENSORS_GPU:image_tensor"
  output_stream: "TENSORS:detection_tensors"
  node_options: {
    [type.googleapis.com/mediapipe.TfLiteInferenceCalculatorOptions] {
      model_path: "mediapipe/models/model.tflite"
    }
  }
}

# Generates a single side packet containing a vector of SSD anchors based on
# the specification in the options.
node {
  calculator: "SsdAnchorsCalculator"
  output_side_packet: "anchors"
  node_options: {
    [type.googleapis.com/mediapipe.SsdAnchorsCalculatorOptions] {
      num_layers: 4
      min_scale: 0.1484375
      max_scale: 0.75
      input_size_height: 128
      input_size_width: 128
      anchor_offset_x: 0.5
      anchor_offset_y: 0.5
      strides: 8
      strides: 16
      strides: 16
      strides: 16
      aspect_ratios: 1.0
      fixed_anchor_size: true
    }
  }
}

# Decodes the detection tensors generated by the TensorFlow Lite model, based on
# the SSD anchors and the specification in the options, into a vector of
# detections. Each detection describes a detected object.
node {
  executor: "model_executor"
  calculator: "TfLiteTensorsToDetectionsCalculator"
  input_stream: "TENSORS:detection_tensors"
  input_side_packet: "ANCHORS:anchors"
  output_stream: "DETECTIONS:detections"
  node_options: {
    [type.googleapis.com/mediapipe.TfLiteTensorsToDetectionsCalculatorOptions] {
      num_classes: 1
      num_boxes: 896
      num_coords: 16
      box_coord_offset: 0
      keypoint_coord_offset: 4
      num_keypoints: 6
      num_values_per_keypoint: 2
      sigmoid_score: true
      score_clipping_thresh: 100.0
      reverse_output_order: true
      x_scale: 128.0
      y_scale: 128.0
      h_scale: 128.0
      w_scale: 128.0
      min_score_thresh: 0.75
    }
  }
}

# Converts the detections to drawing primitives for annotation overlay.
node {
  executor: "model_executor"
  calculator: "DetectionsToRenderDataCalculator"
  input_stream: "DETECTIONS:detections"
  output_stream: "RENDER_DATA:render_data"
  node_options: {
    [type.googleapis.com/mediapipe.DetectionsToRenderDataCalculatorOptions] {
      thickness: 4.0
      color { r: 255 g: 0 b: 0 }
    }
  }
}

# Caches a hand-presence decision fed back from HandLandmarkSubgraph, and upon
# the arrival of the next input image sends out the cached decision with the
# timestamp replaced by that of the input image, essentially generating a packet
# that carries the previous hand-presence decision. Note that upon the arrival
# of the very first input image, an empty packet is sent out to jump start the
# feedback loop.
node {
  calculator: "PreviousLoopbackCalculator"
  input_stream: "MAIN:input_video"
  input_stream: "LOOP:render_data"
  input_stream_info: {
    tag_index: "LOOP"
    back_edge: true
  }
  output_stream: "PREV_LOOP:prev_render_data"
}

node {
   calculator: "PacketClonerCalculator"
   input_stream: "prev_render_data"
   input_stream: "input_video"
   output_stream: "sync_render_data"
}

# Draws annotations and overlays them on top of the input images.
node {
  calculator: "AnnotationOverlayCalculator"
  input_stream: "INPUT_FRAME_GPU:input_video"
  input_stream: "sync_render_data"
  output_stream: "OUTPUT_FRAME_GPU:output_video"
}
The reasoning behind this is:
1) input video comes with high fps
2) on the first step _input_video_ triggers PreviousLoopbackCalculator and it outputs an empty packet to PacketClonerCalculator which stores that. Also _input_video_ triggers model computation that happens in parallel with this.
3) first _input_video_ frame comes to AnnotationOverlayCalculator. As we don't have real render_data, empty packet comes here from PacketClonerCalculator and this process continues until real _render_data_ comes through PreviousLoopbackCalculator and is stored in PacketClonerCalculator.
I've inserted PreviousLoopbackCalculator into graph so that PacketClonerCalculator doesn't have to wait for first real _render_data_ and starts to output empty packets immediately.
What is wrong with this understanding? It looks like this should achieve realtime video output, but it doesn't. Offloading model computation to a separate executor doesn't have any effect also.
If I input some video data into this graph on desktop (not waiting for result on every input frame, but first I load all the frames into the graph and wait for completion) this graph hangs. But if I remove PreviousLoopbackCalculator, everything works as I expect.
 Cubbee
All 7 comments
Hi @Cubbee, thank you for this question and details.
From what I understand, a summary of the problem is this: Since the model runs slowly at inference time, each frame doesn't have a result for rendering. You would like to save and forward the annotations from a previously processed frame to display a result in the output.
Here is a visualization of the graph you shared using https://viz.mediapipe.dev/ :
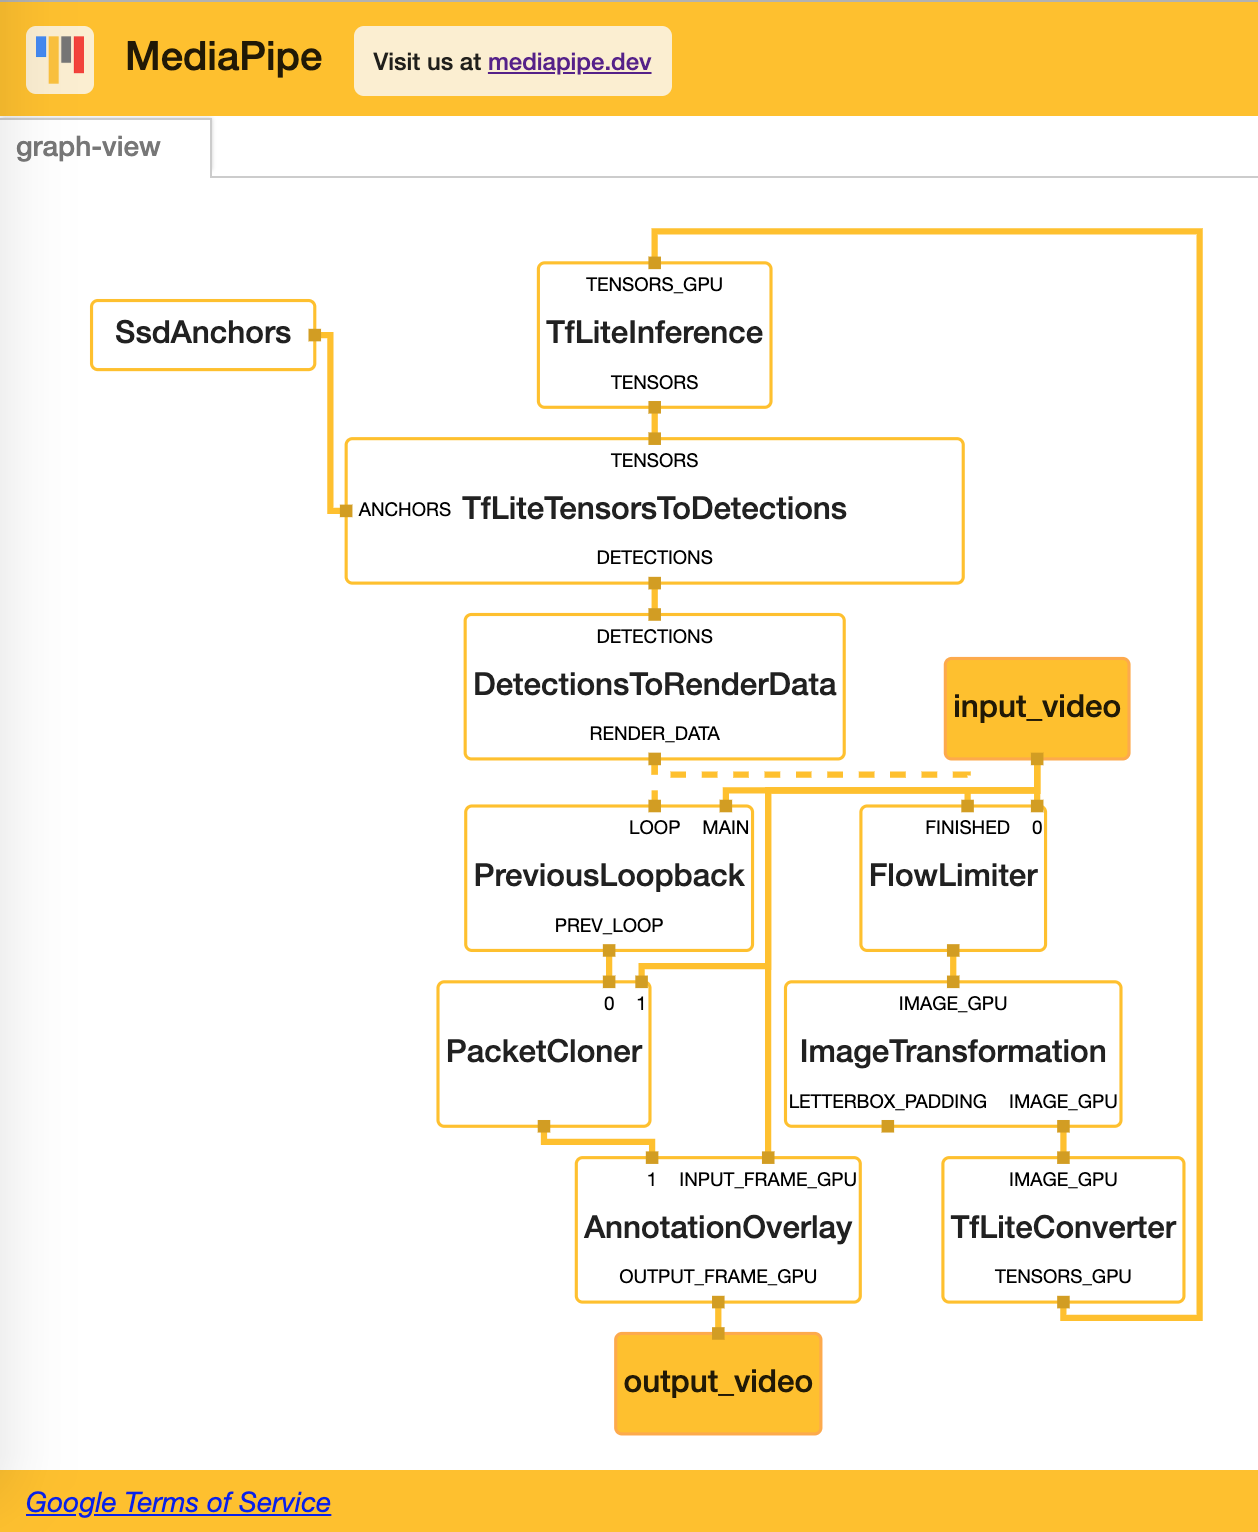
Here are my recommendations:
DetectionsToRenderDatais supposed to be inexpensive and shouldn't block your pipeline from processing the next video frame. Therefore, instead ofFINISHED:render_data, useFINISHED: detectionsin theFlowLimiterCalculatornode of your graph. This way, the pipeline will be limited only by heavy operations that actually limit the throughput of the graph.Both ideas, i.e. using
PreviousLoopbackCalculatorto forward state from a previous iteration or usingPacketClonerCalculatorto clone state from a previous iteration are correct. Implementation-wise, both are very different.- The goal of the
PreviousLoopbackCalculatoris to wait for a packet from a previous timestamp in theLOOPinput stream, forward it to on the next timestamp as an output packet in thePREV_LOOPinput stream based on the packet timestamp of packets in theMAINinput stream. The reason it is possible for this calculator to handle packets coming in at different timestamps in theLOOPandMAINinput streams is due to the use of an ImmediateInputStreamHandler. While the details of the implementation of this calculator are tricky, the key takeaway is that it is not guaranteed that each input packet in theMAINinput stream will have a corresponding output packet in thePREV_LOOPoutput stream if packets in theLOOPinput stream are unavailable, as of today. - The goal of the
PacketClonerCalculatoris slightly different. It aims to output the clone of the latest packet received in certain input streams when a tick signal is sent to the calculator. The tick signal corresponds to theinput_videostream in the graph above. This is the solution that should work for the problem you described.
- The goal of the
Finally, you mention an issue with the first
render_datapacket:I've inserted PreviousLoopbackCalculator into graph so that PacketClonerCalculator doesn't have to wait for first real render_data and starts to output empty packets immediately.
However, my followup question is this: Is it really necessary to explicitly wait for an empty packet?
According to the code, if there is no packet available in the render_data input stream, the code informs downstream calculators about a timestamp bound update. As described in the documentation about timestamp synchronization:
Each stream has a timestamp bound, which is the lowest possible timestamp allowed for a new packet on the stream. When a packet with timestamp
Tarrives, the bound automatically advances toT+1, reflecting the monotonic requirement. This allows the framework to know for certain that no more packets with timestamp lower thanTwill arrive.
The code therefore actually informs the downstream calculator that no packet is available at the first iteration. Using PacketCloner alone should be sufficient as shown here:
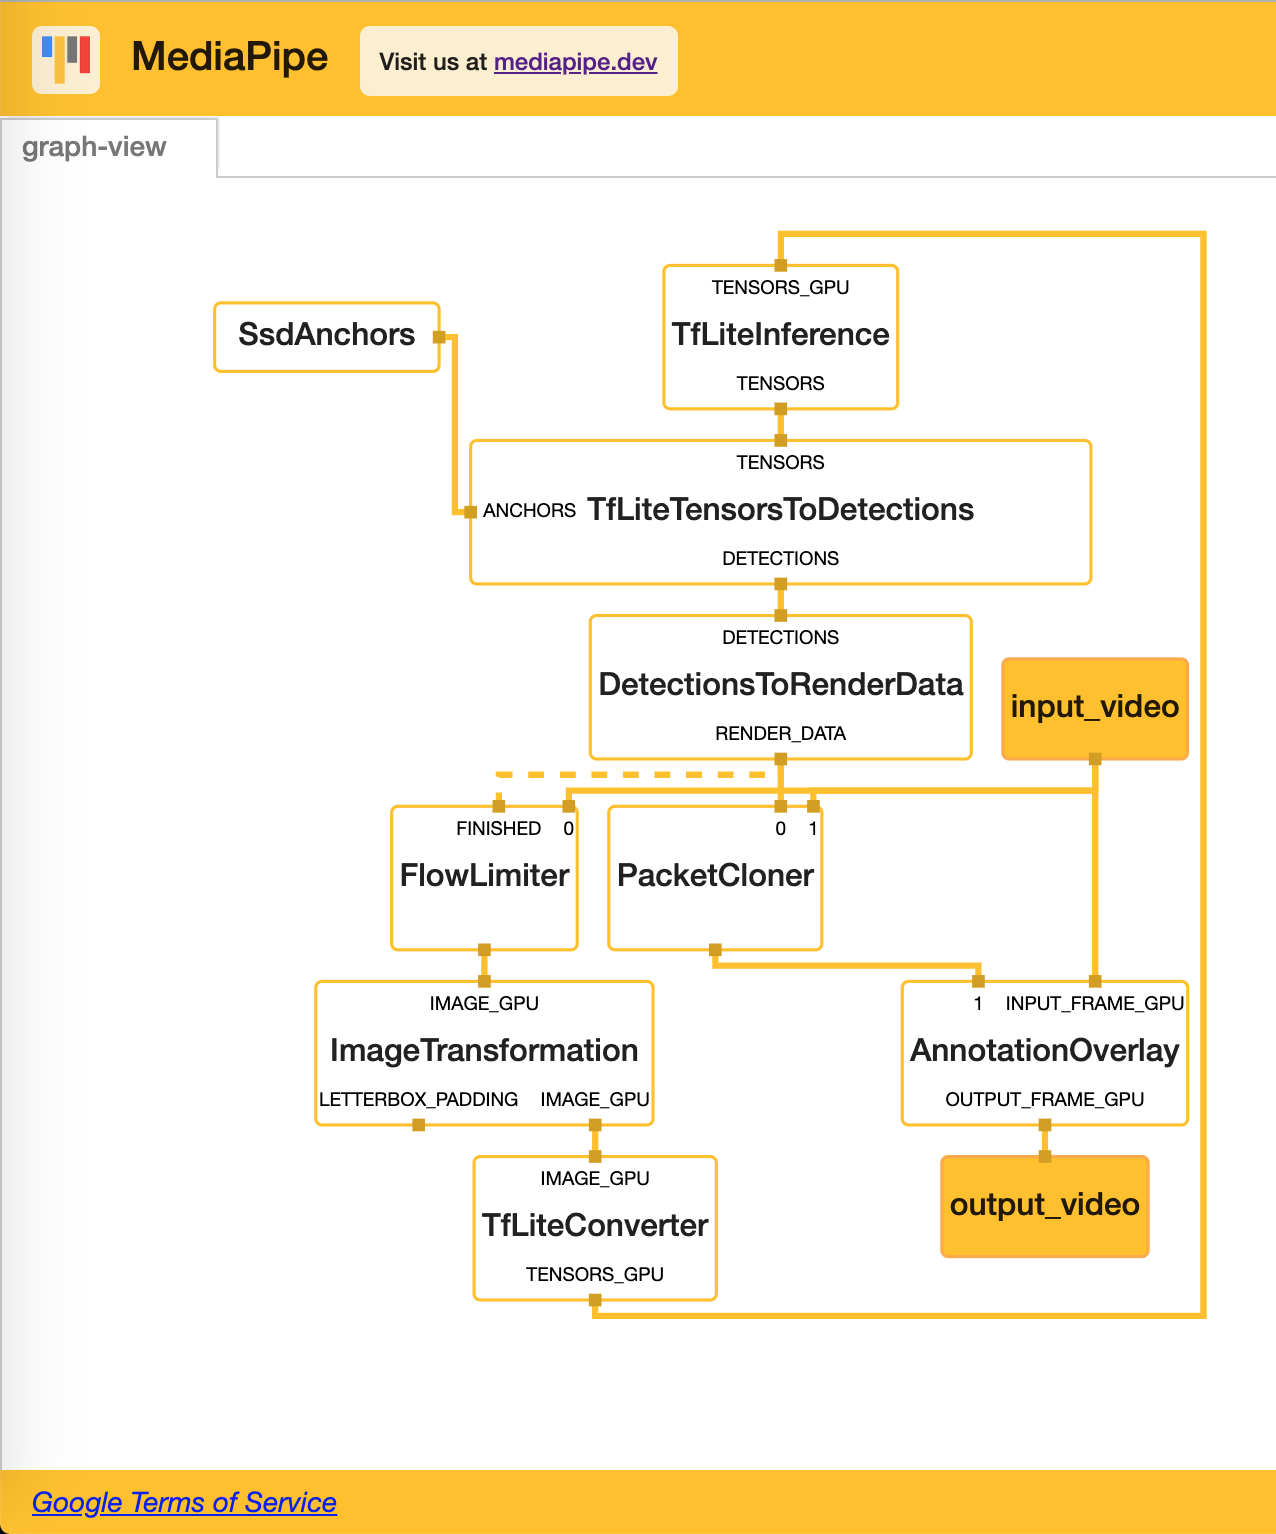
The question then is, do you observe any errors with this version of the graph that usesPacketCloner to cache state?
Some useful links:
 eknight7
on 3 Mar 2020
eknight7
on 3 Mar 2020
Hello, @eknight7. Thank you for the very detailed answer!
I've tried to implement your advice for Android app, but failed and want to ask more questions.
I've been experimenting with object detection Android demo (please note that I'm still using Mediapipe v0.6.8.1 and a rather slow Android device) trying to understand how the camera and other OpenGL-related stuff works.
I've noticed that somehow it looks like that graph input framerate is dependent on the output framerate.
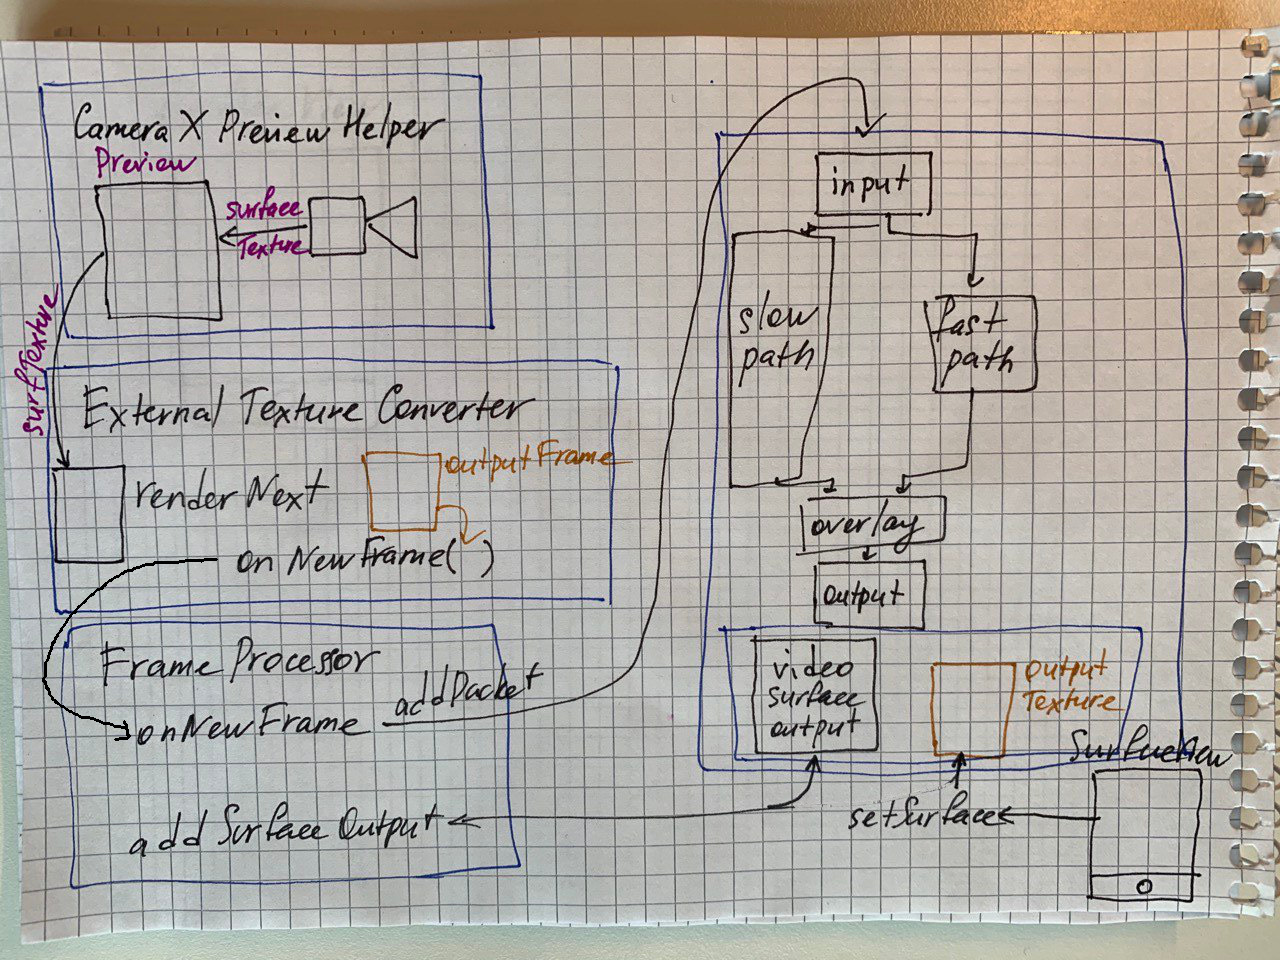
As far as I understand input and output texture flows are separate:
1) We initialize the camera and preview with CameraXPreviewHelper
2) We connect it to ExternalTexureConverter which is connected to FrameProcessor
3) When converter's renderNext is called it renders camera texture on a new texture which is passed to FrameProcessor by onNextFrame
4) FrameProcessor adds this texture to the graph's input stream and graph starts processing
The output is handled separately:
1) We add a utility output node that handles output texture drawing via FrameProcessor addSurfaceOutput
2) We create a SurfaceView and attach it's texture to output node with setSurface
So at least on the texture level input and output are not related.
Here is a scheme, hope it'll help someone. It took me quite some time to understand how all this works :)
I've had a hypothesis that this (input and output sync frequency) is somehow related to OpenGL locks of some kind (unfortunately, I don't understand OpenGL insides at all). Maybe the phone's memory doesn't have enough throughput to copy frames between CPU and GPU (related to CPU graph version)? Or model computation somehow affects the camera?
So, I've made some tests with GPU and CPU graph configurations and it raised more questions. :)
Here are graph configs with inserted PacketFrequencyCalculators, images of the graphs and logs with packet frequencies that I received with this code
1) Default mobile object detection GPU graph with PacketFrequencyCalculators
2) Mobile object detection GPU graph with PacketFrequencyCalculators and PacketCloner
3) Mobile object detection CPU graph with PacketFrequencyCalculators
4) Mobile object detection CPU graph with PacketFrequencyCalculators and PacketCloner
5) Mobile object detection CPU graph with PacketFrequencyCalculators and PacketCloner (input_video to PacketCloner)
Comments:
1) So, the 1st one is the default mobile GPU graph. It runs as expected and outputs stable low fps video, but I don't understand why input framerate is so low.
input_video_frequency: 14.67
throttled_input_video_frequency: 7.33
output_video_frequency: 7.33
2) Here I've inserted a PacketCloner and expected to get "delayed" predictions drawing, but it didn't happen. For some reason I even got lower input fps.
input_video_frequency: 12.67
throttled_input_video_frequency: 6.33
sync_render_data_frequency: 12.67
output_video_frequency: 12.67
3) Is the CPU version of this graph. It behaves more like what I expected: input framerate is high, output is low.
input_video_frequency: 30.00
throttled_input_video_frequency: 5.00
output_video_frequency: 5.00
[video](https://photos.app.goo.gl/tLc2wqAudAntNTRC9)
4) Here I've inserted a packet cloner and again don't quite understand why the input framerate dropped.
input_video_frequency: 18.67
throttled_input_video_frequency: 3.67
sync_render_data_frequency: 17.67
output_video_frequency: 17.67
[video](https://photos.app.goo.gl/46EDVgGUDuXBPb2c9)
5) Here I've changed PacketCloner's tick stream from input_video_cpu to input_video and for some reason my input framerate dropped even more.
input_video_frequency: 8.00
throttled_input_video_frequency: 4.00
sync_render_data_frequency: 8.00
output_video_frequency: 8.00
[video](https://photos.app.goo.gl/dK3j5mKJRuWWYmTv7)
Also, I've noticed some strange behavior: 4th version of the graph outputs video in bursts of high framerate followed by stutter (compared to versions 3 and 5)
So, here are the questions:
1) Is my understanding of Android demo architecture related to camera and output correct?
2) Why does it look like that input framerate is affected by output framerate? Is it possible to achieve equal 30 fps input and output on a graph with a slow branch? (I've tried different max_queue_size settings and global graph input policies but it looked like they didn't have any effect)
3) How does the executor model work? When I've tried to output thread id of each node they came out different. However, when I put a std::this_thread::sleep_for(std::chrono::milliseconds(x)); in a calculator, it looks like it stops the world even if I put this calculator path on a separate executor (marked as the slow path on the scheme).
4) Why do "frame bursts" happen and how to avoid them? When I understand how graphs work, I plan to store outputs in a buffer so the results will be delayed but frame pacing is maintained. Is this a sound approach?
5) Why changing 'tick' signal of PacketCloner (between 4 and 5) affected the output framerate so much?
Thank you for your great work!
Cubbee
on 5 Mar 2020
Found the following info in the documentation:
MediaPipe allows graphs to run OpenGL in multiple GL contexts. For example, this can be very useful in graphs that combine a slower GPU inference path (eg, at 10 FPS) with a faster GPU rendering path (eg, at 30 FPS): since one GL context corresponds to one sequential command queue, using the same context for both tasks would reduce the rendering frame rate.
Looks like this is exactly the problem that I face. Then the question is: how to use multiple OpenGL contexts? :)
_Update:_
Unfortunately, adding
options {
[mediapipe.GlContextOptions.ext] {
gl_context_name: "render_ctx"
}
}
to AnnotationOverlayCalculator didn't change anything :(
Cubbee
on 6 Mar 2020
Experiment proposal: Can you add a separate context for the slow path and keep the render_ctx?
The idea here is to let the slow path have a separate context to avoid blocking other work, a render_ctx to wait for a pass through the slow path to finish and let the default/main context do work for everything else.
eknight7
on 6 Mar 2020
Sorry for delayed reply.
I've kind of managed to solve my problem and achieved almost realtime video feed, which is good news. :) This required 2 steps:
1) I had to modify the code of gpu_shared_data_internal.cc, because setting OpenGL contexts via options field somehow conflicted with node_options. (I didn't dig too much, but looks like setting options for node prevents it from parsing node_options)
bool gets_own_context = (node_type == "ImageFrameToGpuBufferCalculator") ||
(node_type == "GpuBufferToImageFrameCalculator") ||
(node_type == "GlSurfaceSinkCalculator") ||
(node_type == "AnnotationOverlayCalculator");
bool compute_context = (node_type == "TfLiteConverterCalculator") ||
(node_type == "TfLiteInferenceCalculator") ||
(node_type == "TfLiteTensorsToDetectionsCalculator");
const auto& options = node->GetCalculatorState().Options<GlContextOptions>();
if (options.has_gl_context_name() && !options.gl_context_name().empty()) {
context_key = absl::StrCat("user:", options.gl_context_name());
} else if (gets_own_context) {
context_key = absl::StrCat("auto:", node_type);
} else if (compute_context) {
context_key = "user:compute_ctx";
} else if (kGlCalculatorShareContext) {
context_key = SharedContextKey();
} else {
context_key = absl::StrCat("auto:", node_id);
}
node_key_[node_id] = context_key;
2) ExternalTextureConverter has a buffer for storing texture prepared for mediapipe. Increasing the size of this buffer (either with DEFAULT_NUM_BUFFERS or constructor parameter) helps. I've increased it to 12.
With these modifications I've been able to achieve almost 30 fps output rate with a very slow model (~3fps) and mobile GPU graph. This stream doesn't look great (probably because of bad frame pacing), but that's another story.
Now, the "explanation". When a new frame comes into ExternalTextureConverter, it selects a place for it in the buffer inside nextOutputFrame and passes the reference to mediapipe consumer.onNewFrame(outputFrame). If selected space is not yet "released" by mediapipe, we have to wait. And this wait was the reason why it looked like the graph's input frequency dropped.
So, to decrease the wait time we can either increase the buffer size or decrease the time when graph grabs the ownership of the texture.
Putting AnnotationOverlayCalculator and calculators related to inference on separate OpenGL contexts helps to reduce the "ownership transfer" time.
However, I didn't understand why. CalculatorGraph::AddPacketToInputStreamInternal takes 0 ms to complete, so it looks like some graph-level throttling happens. Could you please explain how does it work? Does it happen because the input queue of AnnotationOverlayCalculator calculator is filled too fast? Anyway, having a graph profiler would be amazing. :)
Cubbee
on 11 Mar 2020
About "node_options" and "options", these were designed as alternatives, for proto3 syntax and proto2 syntax respectively. If needed we could look into combining options from both fields.
Your conclusion about ExternalTextureConverter sounds correct to me. Increasing numBuffers will increase the number of pipelined frames allowed in-flight before new frames are blocked by nextOutputFrame.
The effect of defining 2 separate GlContexts sounds complex to me. With multiple pipelined frames (enabled by numBuffers) and one GlContext, multiple TfLiteInferenceCalculator::Process calls and AnnotationOverlayCalculator::Process calls will queue GPU commands onto the same GL command queue, and each will essentially wait for its command to start and then to finish. With multiple GlContext's, the TfLiteInferenceCalculator and the AnnotationOverlayCalculator will wait on separate GPU command queues, which could be especially beneficial if the device has multiple GPU's.
The actual waiting will occur when a calculator waits for GPU results. Calculators don't always wait for GPU results before proceeding to downstream calculators. Calculators can wait for the GPU by calling GlSyncPoint::Wait.
 hadon
on 13 Mar 2020
hadon
on 13 Mar 2020
Putting
AnnotationOverlayCalculatorand calculators related to inference on separate OpenGL contexts helps to reduce the "ownership transfer" time.
Glad the experimental proposal helped! Thanks for trying it out.
However, I didn't understand why.
CalculatorGraph::AddPacketToInputStreamInternaltakes 0 ms to complete, so it looks like some graph-level throttling happens. Could you please explain how does it work? Does it happen because the input queue of AnnotationOverlayCalculator calculator is filled too fast?
One way to inspect this is by adding a few custom logging statements:
- Add the following line to at the beginning of the loop inside
CalculatorNode::SchedulingLoop()in calculator_node.cc#L601:
LOG(INFO) << "NODE: " << DebugName() << " with input streams: " << input_stream_handler_->DebugStreamNames(); - The graph uses
AnnotationOverlayCalculatorwith theDefaultInputStreamHandler. Add the following code block to loop insideDefaultInputStreamHandler::GetNodeReadiness(...)in default_input_stream_handler#L47:
for (const auto& stream : input_stream_managers_) {
  ...
  *min_stream_timestamp = ...

  int queue_size  = stream->QueueSize();
  int max_queue_size = stream->MaxQueueSize();
  bool is_full = stream->IsFull();

  LOG(INFO) << "\tstream: " << stream->Name()
                      << "\tqueue_size: " << queue_size << " / " << max_queue_size
                      << "\tis_full: " << is_full;
}
Then run adb logcat * > log.txt and after logging for some time, press CTRL+C. Then inspect the log. It will be dense, but will have info about each node that is checked for readiness before scheduling, and then the queue sizes of each of the input streams for that node.
Hopefully, this will help you get an idea if the queue of one or more of the input streams of the AnnotationOverlayCalculator is filling up fast.
Anyway, having a graph profiler would be amazing. :)
Coming soon, watch https://mediapipe.readthedocs.io/en/latest/measure_performance.html for updates.
eknight7
on 13 Mar 2020
Related issues
 7AM7
·
5Comments
7AM7
·
5Comments
 Devin0202
·
5Comments
Devin0202
·
5Comments
 suyashjoshi
·
3Comments
suyashjoshi
·
3Comments
 RealBBakGosu
·
4Comments
RealBBakGosu
·
4Comments
 baocareos
·
5Comments
baocareos
·
5Comments
Most helpful comment
Glad the experimental proposal helped! Thanks for trying it out.
One way to inspect this is by adding a few custom logging statements:
CalculatorNode::SchedulingLoop()in calculator_node.cc#L601:LOG(INFO) << "NODE: " << DebugName() << " with input streams: " << input_stream_handler_->DebugStreamNames();AnnotationOverlayCalculatorwith theDefaultInputStreamHandler. Add the following code block to loop insideDefaultInputStreamHandler::GetNodeReadiness(...)in default_input_stream_handler#L47:Then run
adb logcat * > log.txtand after logging for some time, pressCTRL+C. Then inspect the log. It will be dense, but will have info about each node that is checked for readiness before scheduling, and then the queue sizes of each of the input streams for that node.Hopefully, this will help you get an idea if the queue of one or more of the input streams of the
AnnotationOverlayCalculatoris filling up fast.Coming soon, watch https://mediapipe.readthedocs.io/en/latest/measure_performance.html for updates.