Mattermost-server: High disk I/O reads after upgrading to 4.9
Summary
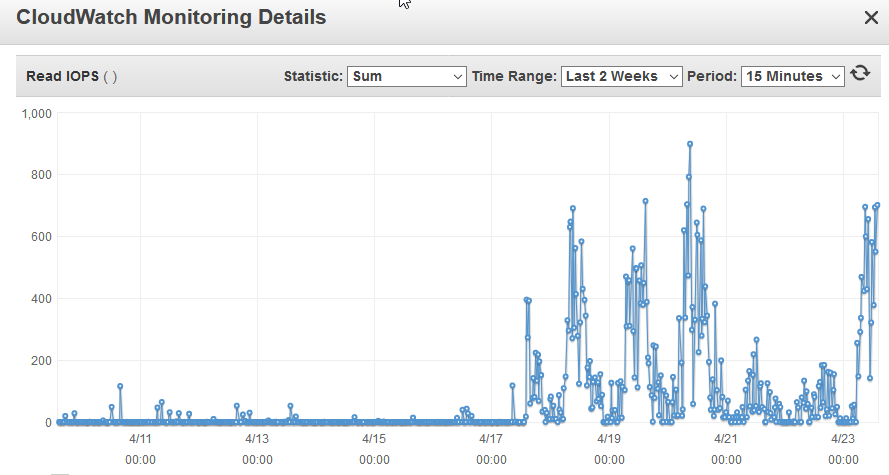
After updating Mattermost from 4.8 to 4.9 the amount of disk I/O read activity went extremely high. This causes channels to load very slowly.
Steps to reproduce
Install or upgrade to Mattermost 4.9 and monitor disk I/O read activity when loading large channels.
Expected behavior
Channels load fast(er) with "normal" amount of disk I/O read activity. This issue is probably related to these changes done in Mattermost 4.9:
- Decreased channel load time by optimizing database queries used to fetch threads and parent posts in a channel.
- Decreased load time of large channels with 5,000+ messages by up to 90% by optimizing many client functions related to rendering posts and threads.
Observed behavior (that appears unintentional)
This screenshot displays the AWS EC2 volume Read IOPS from the last two weeks. The increased disk load is after upgrading to Mattermost 4.9
 nagotti
All 9 comments
@nagotti, are you noticing the increased IOPS on your Mattermost server instance or your database instance? We are in the process of releasing 4.9.1 that reverts some performance changes that negatively impact large installations that use threads infrequently: does this describe your situation?
 lieut-data
on 24 Apr 2018
lieut-data
on 24 Apr 2018
@lieut-data We are running both Mattermost server and the database server (PostgreSQL 9.6.7) on the same instance. The I/O load is caused by PostgreSQL processes. We have quite small deployment with 20+ users.
Here's some stats from iotop when trying to open a channel that contains large amount of messages:
Total DISK READ : 61.00 M/s | Total DISK WRITE : 31.38 K/s
Actual DISK READ: 61.01 M/s | Actual DISK WRITE: 62.76 K/s
TID PRIO USER DISK READ DISK WRITE SWAPIN IO> COMMAND
11958 be/4 postgres 23.03 M/s 0.00 B/s 0.00 % 34.16 % postgres: (37228) SELECT
12271 be/4 postgres 18.90 M/s 0.00 B/s 0.00 % 27.84 % postgres: (41172) SELECT
11965 be/4 postgres 18.87 M/s 0.00 B/s 0.00 % 27.37 % postgres: (37406) SELECT
nagotti
on 24 Apr 2018
Would you be comfortable running a SQL query to see if your instance is negatively impacted by the performance change I mentioned above?
EXPLAIN ANALYZE SELECT * FROM Posts WHERE Id IN (SELECT * FROM ( (SELECT * FROM ( SELECT CASE RootId WHEN '' THEN NULL ELSE RootId END FROM Posts WHERE ChannelId = (SELECT ChannelId FROM Channels ORDER BY CreateAt ASC LIMIT 1) AND DeleteAt = 0 ORDER BY CreateAt DESC LIMIT 60 OFFSET 0) x ) UNION ( SELECT Id FROM Posts WHERE RootId IN (SELECT * FROM ( SELECT CASE RootId WHEN '' THEN Id ELSE RootId END FROM Posts WHERE ChannelId = (SELECT ChannelId FROM Channels ORDER BY CreateAt ASC LIMIT 1) AND DeleteAt = 0 ORDER BY CreateAt DESC LIMIT 60 OFFSET 0) x ))) x ) AND DeleteAt = 0;
This should spit out a multi-line query plan that might help pinpoint the issue, if it's related to the query I suspect in 4.9.
lieut-data
on 24 Apr 2018
Seems safe. Here is the result of that query:
Nested Loop (cost=660138.68..661828.25 rows=1258306 width=346) (actual time=11536.141..11536.141 rows=0 loops=1)
-> HashAggregate (cost=660138.25..660140.25 rows=200 width=32) (actual time=11536.133..11536.134 rows=1 loops=1)
Group Key: (x.rootid)::text
-> Subquery Scan on x (cost=615772.64..653800.31 rows=2535178 width=32) (actual time=11536.081..11536.125 rows=1 loops=1)
-> Unique (cost=615772.64..628448.53 rows=2535178 width=32) (actual time=11536.078..11536.120 rows=1 loops=1)
-> Sort (cost=615772.64..622110.58 rows=2535178 width=32) (actual time=11536.077..11536.099 rows=60 loops=1)
Sort Key: x_1.rootid
Sort Method: quicksort Memory: 26kB
-> Append (cost=0.43..224793.12 rows=2535178 width=32) (actual time=1.059..11536.020 rows=60 loops=1)
-> Subquery Scan on x_1 (cost=0.43..6562.77 rows=60 width=32) (actual time=1.059..1.889 rows=60 loops=1)
-> Limit (cost=0.43..6562.17 rows=60 width=40) (actual time=1.057..1.848 rows=60 loops=1)
-> Index Scan Backward using idx_posts_create_at on posts posts_1 (cost=0.43..1376106.52 rows=12583 width=40) (actual time=1.057..1.810 rows=60 loops=1)
Filter: ((deleteat = 0) AND ((channelid)::text = ((SubPlan 2))::text))
Rows Removed by Filter: 4
SubPlan 2
-> Limit (cost=0.27..0.44 rows=1 width=78) (actual time=0.027..0.027 rows=1 loops=60)
-> Index Only Scan using idx_channels_create_at on channels channels_1 (cost=0.27..68.08 rows=397 width=78) (actual time=0.026..0.026 rows=1 loops=60)
Heap Fetches: 60
-> Hash Semi Join (cost=6563.52..192878.57 rows=2535118 width=27) (actual time=11534.083..11534.083 rows=0 loops=1)
Hash Cond: ((posts_2.rootid)::text = (x_2.rootid)::text)
-> Seq Scan on posts posts_2 (cost=0.00..151457.18 rows=2535118 width=28) (actual time=0.012..10511.828 rows=2391985 loops=1)
-> Hash (cost=6562.77..6562.77 rows=60 width=70) (actual time=0.847..0.847 rows=60 loops=1)
Buckets: 1024 Batches: 1 Memory Usage: 12kB
-> Subquery Scan on x_2 (cost=0.43..6562.77 rows=60 width=70) (actual time=0.025..0.810 rows=60 loops=1)
-> Limit (cost=0.43..6562.17 rows=60 width=78) (actual time=0.023..0.768 rows=60 loops=1)
-> Index Scan Backward using idx_posts_create_at on posts posts_3 (cost=0.43..1376106.52 rows=12583 width=78) (actual time=0.023..0.724 rows=60 loops=1)
Filter: ((deleteat = 0) AND ((channelid)::text = ((SubPlan 1))::text))
Rows Removed by Filter: 4
SubPlan 1
-> Limit (cost=0.27..0.44 rows=1 width=78) (actual time=0.010..0.010 rows=1 loops=60)
-> Index Only Scan using idx_channels_create_at on channels (cost=0.27..68.08 rows=397 width=78) (actual time=0.009..0.009 rows=1 loops=60)
Heap Fetches: 60
-> Index Scan using posts_pkey on posts (cost=0.43..8.43 rows=1 width=346) (actual time=0.002..0.002 rows=0 loops=1)
Index Cond: ((id)::text = (x.rootid)::text)
Filter: (deleteat = 0)
Planning time: 13.475 ms
Execution time: 11536.297 ms
(37 rows)
nagotti
on 24 Apr 2018
@nagotti, thanks! It doesn't quite match the EXPLAIN I expected, given the sequential scan through the Posts table. Can I get you to give 4.9.1 a go as soon as its released and let me know if this settles back down?
lieut-data
on 25 Apr 2018
@lieut-data Alright, I'll test 4.9.1 as soon as it is released and I'll let you know then if it helped. Thanks for the help!
nagotti
on 25 Apr 2018
@lieut-data I just upgraded to 4.9.1 and I can confirm that it fixed the issue. Channels are loading very fast again.
nagotti
on 29 Apr 2018
Thanks, @nagotti! This is a useful data point for our continued investigation :)
lieut-data
on 29 Apr 2018
Thanks @nagotti @lieut-data
Glad the issue is resolved.
I'll close this issue off here for now...
 lindy65
on 2 May 2018
lindy65
on 2 May 2018
Related issues
 esethna
·
3Comments
esethna
·
3Comments
esethna
·
3Comments
esethna
·
3Comments
 saturninoabril
·
3Comments
saturninoabril
·
3Comments
 NotSqrt
·
3Comments
NotSqrt
·
3Comments
 harshilsharma2
·
3Comments
harshilsharma2
·
3Comments
Most helpful comment
Thanks, @nagotti! This is a useful data point for our continued investigation :)