Background
LND is constantly writing around 500 kb/s onto its volume while only reading 0,5kB/s. LND has 51 peers and 48 channels with about 8 forwarding events per day. I wonder what it is constantly writing. I fear that this write load already wore off my previously used and meanwhile broken sd card.
Your environment
lnd version 0.11.1-beta.rc5 commit=v0.11.1-beta.rc5
Linux odroid 4.14.180-176 #1 SMP PREEMPT Tue May 19 00:40:55 -03 2020 armv7l armv7l armv7l GNU/Linux
Bitcoin Core Daemon version v0.17.1
Steps to reproduce
I am happy to provide you any helpful information, please tell me what you need to investigate this.
Expected behaviour
I would expect LND to rarely write to the file system unless channel states changed.
Actual behaviour
dm-0 is the bitcoin blockchain volume and dm-1 is the lnd volume. Both are on sda.
$ iostat 8

avg-cpu:  %user   %nice %system %iowait  %steal   %idle
           3,27    0,00    3,39   13,81    0,00   79,54

Device             tps    kB_read/s    kB_wrtn/s    kB_read    kB_wrtn
sda             157,25       382,00       531,00       3056       4248
dm-0              9,12       382,00         0,00       3056          0
dm-1            149,12         0,00       528,00          0       4224
 hpbock
All 41 comments
Did you start seeing this with this version of LND, or did you notice it also before?
 halseth
on 13 Oct 2020
halseth
on 13 Oct 2020
I'm seeing a similar problem,
LND is running on on AWS t2.small (Intel(R) Xeon(R) CPU E5-2686 v4 @ 2.30GHz with 2 GB RAM) mounted on gp2 SSD storage. Only running LND on that host. bitcoind is running on a different host.
After a recent LND update kernel consistency maxed out on iowaiting:
$ vmstat 3
procs -----------memory---------- ---swap-- -----io---- -system-- ------cpu-----
 r  b   swpd   free   buff  cache   si   so    bi    bo   in   cs us sy id wa st
 1  1      0 758488  84440 647044    0    0     0   405  263  536  2  0  0 98  0
 0  1      0 758456  84440 647044    0    0     0   388  230  476  2  0  0 98  0
 0  1      0 758172  84444 647044    0    0     0   403  243  508  2  0  0 98  0
 0  1      0 758140  84452 647044    0    0     0   401  252  512  2  0  0 98  0
 0  1      0 758108  84452 647044    0    0     0   416  241  485  2  0  0 98  0
I checked with atop that the writes are coming from lnd only
Versions
- lnd version 0.11.99-beta commit=v0.11.0-beta-303-gf98c74319cbf32d608cdd1cfc5fa077107538351
- Linux 4.19.0-8-amd64 #1 SMP Debian 4.19.98-1 (2020-01-26) x86_64 GNU/Linux
- go version go1.14.2 linux/amd64
 alevchuk
on 13 Oct 2020
alevchuk
on 13 Oct 2020
That's weird. Do you see any writes to the swap area? As in, is the box running out of physical memory?
Could you maybe get a goroutine profile to find out what exactly lnd is waiting on?
https://github.com/lightningnetwork/lnd/blob/master/docs/debugging_lnd.md#capturing-pprof-data-with-lnd
 guggero
on 13 Oct 2020
guggero
on 13 Oct 2020
Swap is disabled and I don't suspect that writes are coming from page cache.
I don't have cycles to run the profile. I'm running another experiment for #4669 Maybe it would be useful for internal testing to spin up a node on AWS with 2GB RAM.
Here is the monitoring of my CPU (%1 actually means 1 core here) and memory: 
alevchuk
on 13 Oct 2020
How much memory is lnd _actually_ utilizing typically? I run a mainnet node with ~100 channels/peers and usually it overs around 300-500 MB (I have some things that hit RPC a lot which can generate garbage).
 Roasbeef
on 14 Oct 2020
Roasbeef
on 14 Oct 2020
I checked with atop that the writes are coming from lnd only
In your logs, if you crank PEER to debug do you see a lot of activity from either forwards or updates? Also do you see a lot of failed HTLCs?
Roasbeef
on 14 Oct 2020
@halseth there has always been a constant write load by lnd. It increased five times about two weeks ago. I can not tell any more if this was rc4 or rc5. Strangely the write load decreased to the normal high load of 50kb/s after restarting rc5 yesterday.


hpbock
on 14 Oct 2020
@Roasbeef memory usage with around 50 active channels is at ~300MB resident memory and ~2.4GB virtual memory.
top - 09:28:37 up 127 days, 19:43,  2 users,  load average: 4,41, 5,01, 5,03
Tasks: 204 total,   1 running, 119 sleeping,   0 stopped,   0 zombie
%Cpu(s):  5,6 us, 11,1 sy,  0,0 ni, 72,2 id, 11,1 wa,  0,0 hi,  0,0 si,  0,0 st
KiB Mem :  2042436 total,    56712 free,  1257192 used,   728532 buff/cache
KiB Swap:  8388604 total,  7985576 free,   403028 used.   834088 avail Mem

  PID USER      PR  NI    VIRT    RES    SHR S  %CPU %MEM     TIME+ COMMAND
20867 lnd-mai+  20   0 2478652 298808  84720 S   0,0 14,6 371:40.73 lnd                  `

hpbock
on 14 Oct 2020


hpbock
on 14 Oct 2020
I am also having issues with LND (0.11.1-beta) writing excessively (several GB in a few hours). I only had one channel at the time (now I have zero). I don't know what's normal, but I'm seeing about 5000 log lines/minute from PEER on debug.
 rytido
on 14 Oct 2020
rytido
on 14 Oct 2020
I don't know what's normal, but I'm seeing about 5000 log lines/minute from PEER on debug.
What are the log lines? Channel Updates?
Roasbeef
on 15 Oct 2020
@hpbock so you're saying the increased I/O is correlated with your update to 0.11.1?
Roasbeef
on 15 Oct 2020
What are the log lines? Channel Updates?
Mostly channel updates, yes
rytido
on 15 Oct 2020
I had the same issue.

I didn't touch the installation and my disk write and io wait went up a lot. Then I tried solving it by updating lnd and go but no luck. Then someone suggested bbolt. That helped with the load but disk writing was still high. Then suddenly it went back to normal without any interaction from my side.
EDIT:
It just started again.

 lnd-dl
on 15 Oct 2020
lnd-dl
on 15 Oct 2020
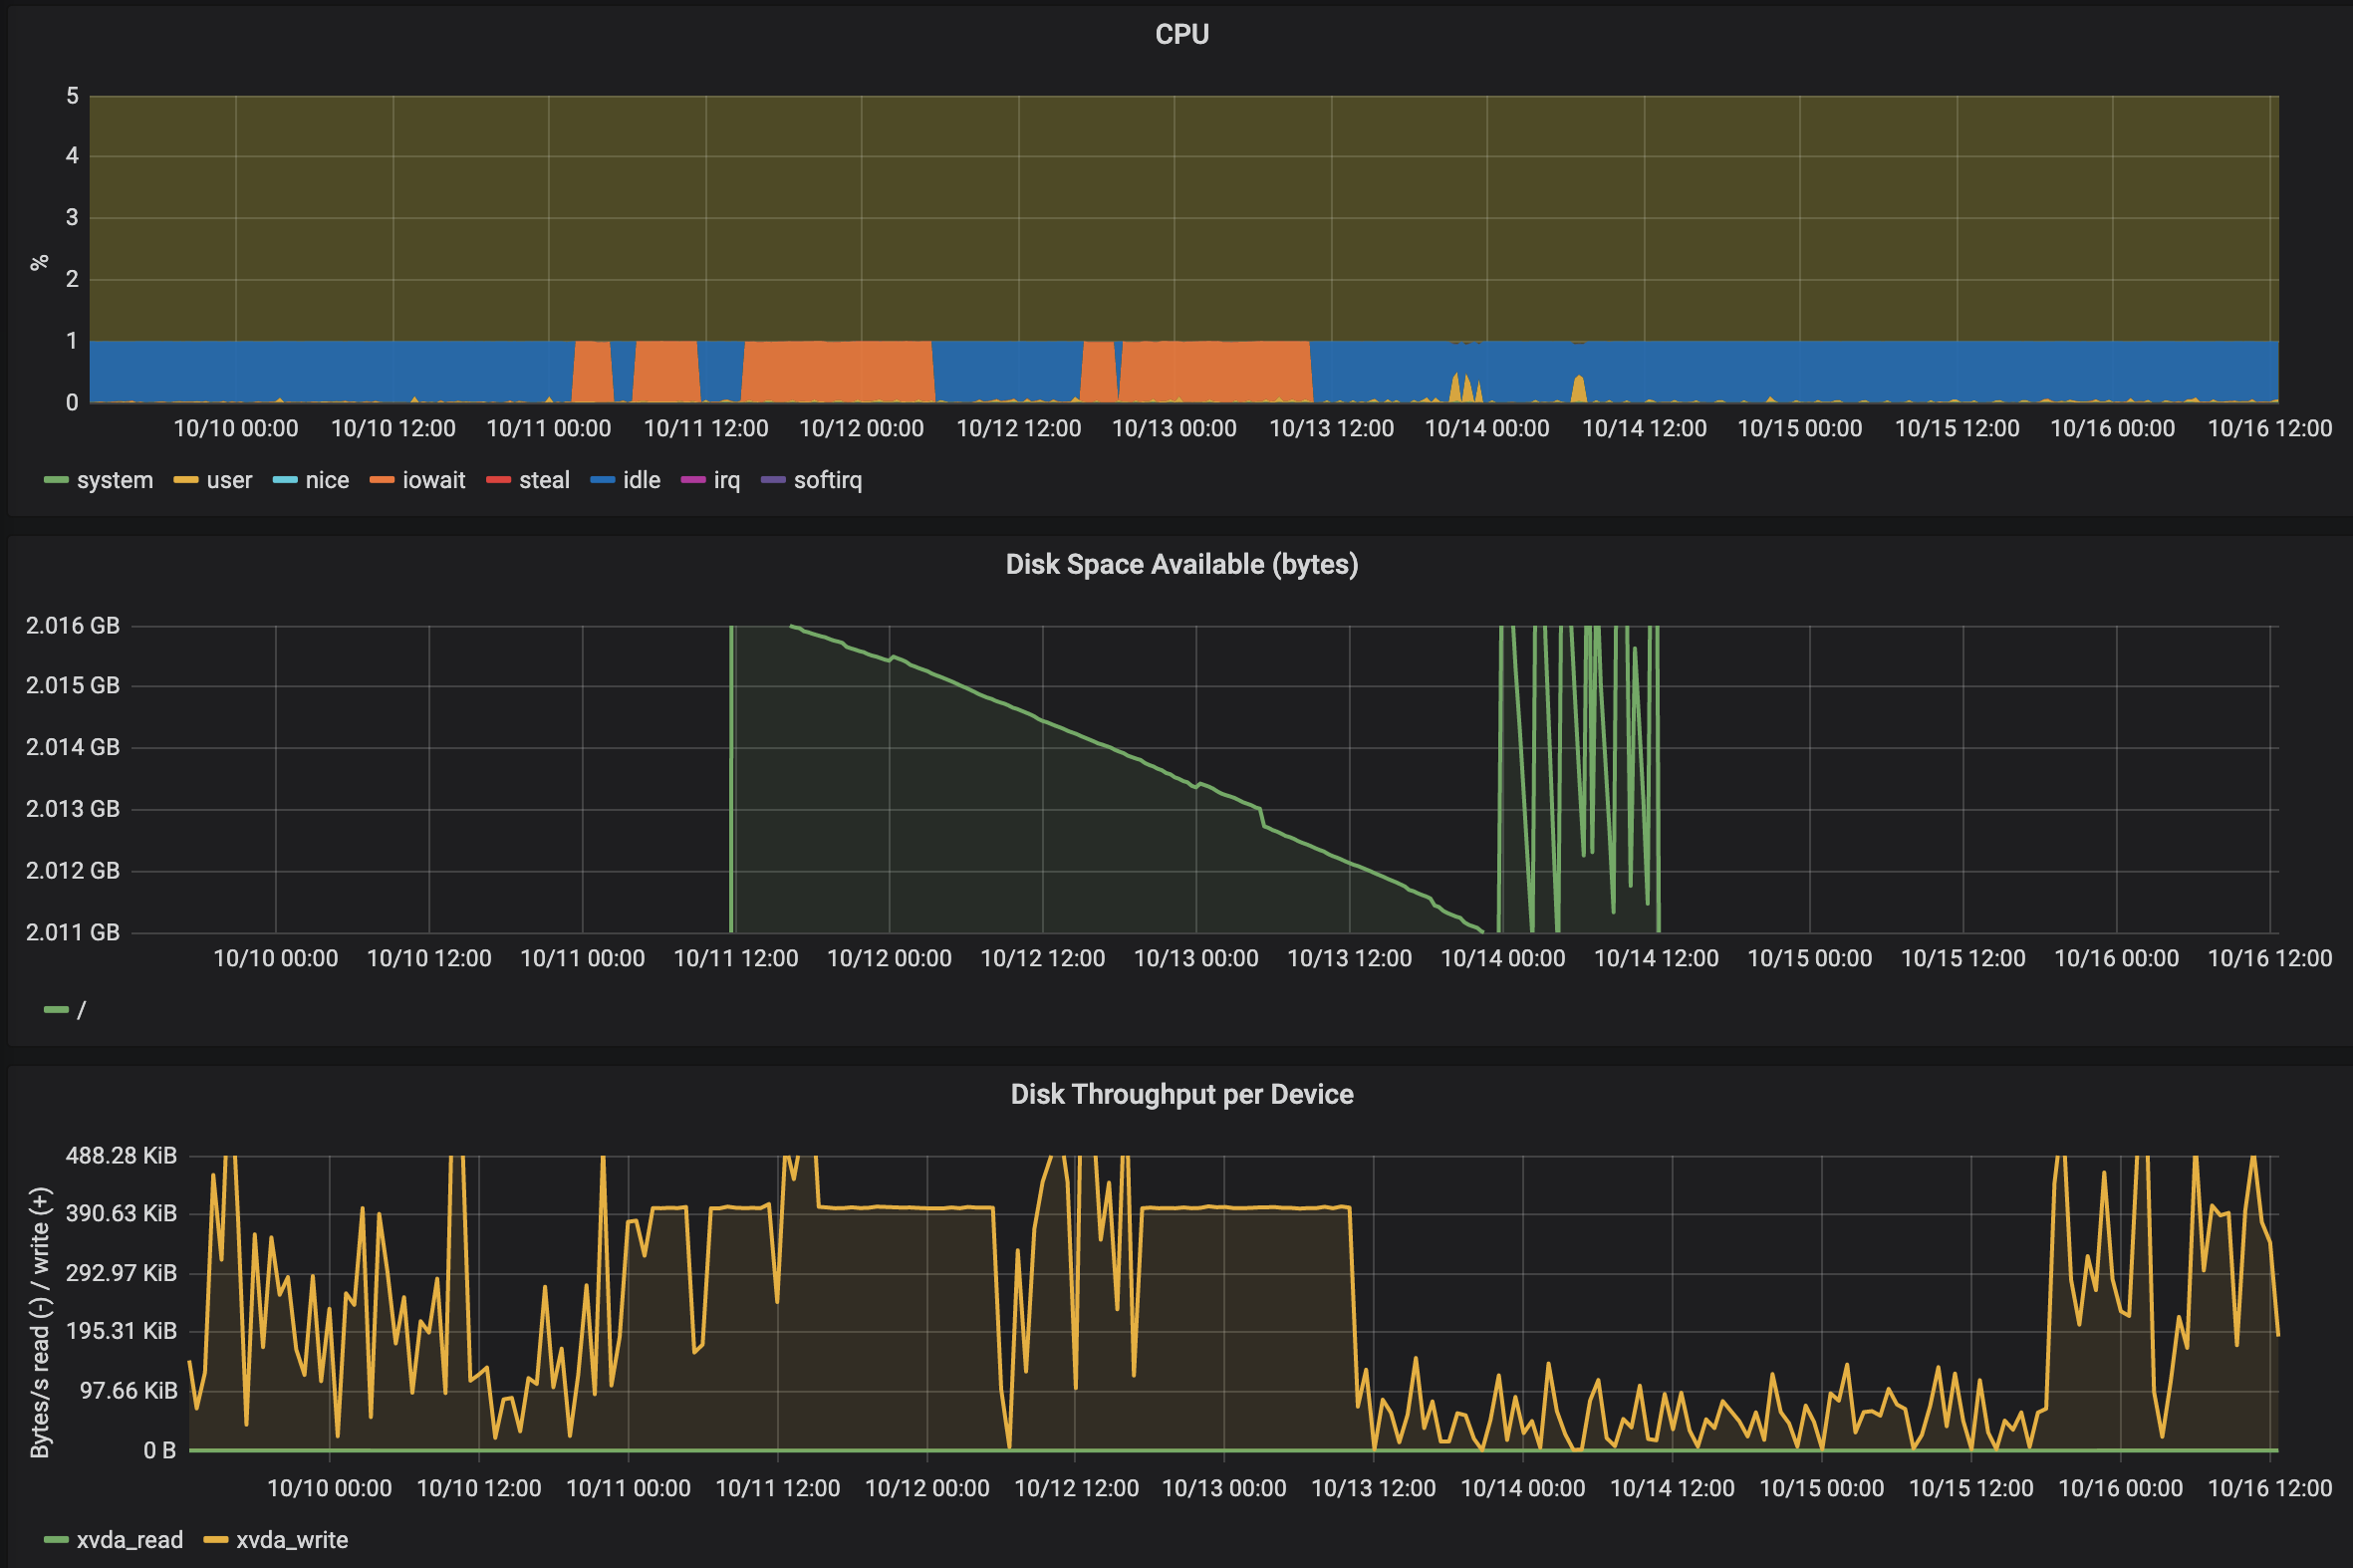
@Roasbeef I can not say, if the load is directly correlated with 0.11.1. What I currently observe is, that the load yesterday suddenly raised by 6 times as you can see in the attached graphs below.
Beside the different levels of write load I wonder, why LND writes much more data onto the filesystem than it ever reads. (on average reading 10kb/s vs writing 60 kb/s)


It seems that there are a lot of channel updates right now.
$ grep PEER .lnd/logs/bitcoin/mainnet/lnd.log | grep Received\ ChannelUpdate | cut -c 254-319 | sort | uniq | while read peer a; do echo -n $peer; grep $peer ~/.lnd/logs/bitcoin/mainnet/lnd.log | wc; done
024a8228d764091fce2ed67e1a7404f83e38ea3c7cb42030a2789e73cf3b341365    975   14536  328164
02572c2e1b43a78bb060e7d322b033443efc0d8d60fc2b111dd8bb999aa940d1f5     92    1031   21400
0260fab633066ed7b1d9b9b8a0fac87e1579d1709e874d28a0d171a1f5c43bb877     50     418    7934
02ad6fb8d693dc1e4569bcedefadf5f72a931ae027dc0f0c544b34c1c6f3b9a02b     68     640   13342
02dfdcca40725ca204eec5d43a9201ff13fcd057c369c058ce4f19e5c178da09f3     54     460    9072
0311cad0edf4ac67298805cf4407d94358ca60cd44f2e360856f3b1c088bcd4782    444    6311  139841
03205b045b0126c0d3fb826a38b9befc4babf51689544908c704d8e51fdec75ffb     46     380    7248
033d8656219478701227199cbd6f670335c8d408a92ae88b962c49d4dc0e83e025    974   14512  325430
037f990e61acee8a7697966afd29dd88f3b1f8a7b14d625c4f8742bd952003a590   1020   14959  335235
03abf6f44c355dec0d5aa155bdbdd6e0c8fefe318eff402de65c6eb2e1be55dc3e   1856   27616  620938
03aca0142349abf19e96a3c9231d556a1525182b659e8b2ae5328efbd01ff227e1    987   14678  333144
There seem to be some either frequent or redundant channel updates:
$ grep PEER .lnd/logs/bitcoin/mainnet/lnd.log | grep Received\ ChannelUpdate | cut -c 137-168 | sort | uniq | wc
   2752    2752   90816
$ grep PEER .lnd/logs/bitcoin/mainnet/lnd.log | grep Received\ ChannelUpdate | cut -c 137-168 | sort | wc
   3258    3258  107514
@Roasbeef lnd was writing about 400KB/sec yet the total disk space available decreased only by 5MB over 2 days
@hpbock i presume there are 0 reads at runtime because disk data will be used only for starting up the process
alevchuk
on 16 Oct 2020
@hpbock this is really cool, i'm looking at vmstat 1 on my systems and there is literally 0 reads constantly. Only goes non-0 when I read a large file or do something like find /usr. This is due to page cache.
alevchuk
on 16 Oct 2020
I'm having the same issue after updating to v0.11.1-beta a week go, disk I/O went crazy. I'm running with Neutrino if that helps, not sure if somebody else is also using Neutrino but might not be related to it.
 gonzaloaune
on 16 Oct 2020
gonzaloaune
on 16 Oct 2020
I'm seeing this issue on AWS with neutrino as well. Disk I/O is hosed.
 githorray
on 17 Oct 2020
githorray
on 17 Oct 2020
Are the others in this thread _also_ running neutrino? At a glance, I don't think that would affect things at all though, given it only will write to disk when doing transaction updates, or rescanning blocks.
@alevchuk's comment re the relationship between disk writes and total consumed space makes me think this might indeed be channel updates.
For those active in the thread: are you running with sync free list mode on (the non-default), and also when was the last time you compacted your database?
Another:
- How many peers+channels do each of y'all have?
Roasbeef
on 20 Oct 2020
[INF] LTND: Opening bbolt database, sync_freelist=false
compact channel.db weekly.
22 peers, 11 channels
githorray
on 20 Oct 2020
@Roasbeef i am running LND with bitcoind. I think sync freelist is false since I have not yet heard about that option. Same with compact database, how can I do that?
Here is my graph of peers and channels:

hpbock
on 20 Oct 2020
@Roasbeef Running LND with Neutrino.
Brand new instance with 6 LND's, 8gb ram, 4 cores and 100gb SDD.
Never compacted the database since the nodes are a week old or so. Each node has 1 peer and 1 channel.
sync_freelist has the default value
Never experienced this problem before upgrading to v0.11.
Seeing this in the logs every 5 seconds, I'm running my own Knots server:
2020-10-20 10:35:21.912 [INF] BTCN: New valid peer xxx.xxx.xxx.xxx:8333 (outbound) (/Satoshi:0.19.1/Knots:20200304/)
2020-10-20 10:35:22.759 [INF] BTCN: Lost peer xxx.xxx.xxx.xxx:8333 (outbound)
I ran an experiment with a new mainnet Neutrino node on Digital Ocean.
Both version v0.10.4 and v0.11.1 stabilizes between 200-600 kb/s of writes for me. No significant difference between the two version as far as I can tell.
Which leads me to think what has changed is the amount of network activity (channel updates), not lnd itself.
halseth
on 22 Oct 2020
@Roasbeef I was not running Neutrino
rytido
on 22 Oct 2020
I ran an experiment with a new mainnet Neutrino node on Digital Ocean.
Both version v0.10.4 and v0.11.1 stabilizes between 200-600 kB/s of writes for me. No significant difference between the two version as far as I can tell.
Which leads me to think what has changed is the amount of network activity (channel updates), not lnd itself.
Update: every 20 minutes I see a spike to about 1 MB/s. This is probably related to swithcing the active sync peer.
halseth
on 22 Oct 2020
Which leads me to think what has changed is the amount of network activity (channel updates), not lnd itself.
I'd like to disagree with your assumption. It is a very sudden spike. How can the network activity become 5 times bigger in one hour? And then stay constant? Is this a way (hack) to make nodes using SD-Cards unusable? To break their disks to get their funds?

lnd-dl
on 23 Oct 2020
on my node lnd writing average is steadily over 2MiB/sec.
no swap involved.
machine has 8GiB of RAM and lnd files are on a two disks btrfs-raid1 array.
I have no historic data because I started monitoring it today after seeing this issue, but it seems to me that it has always been this way.

 villastrangiato
on 23 Oct 2020
villastrangiato
on 23 Oct 2020
I just got another repro after 9 days of healthy. Attaching the goroutine profile as @guggero asked.
Logs have a lot of channel updates: 10+/second, at one spot going to 134 updates in 1 second
(I have my logging level for PEER cranked up to debug)

lnd-profile.1.2020-10-18.healthy.log
lnd-profile.1.2020-10-23.repro.log
lnd-profile.1.2020-10-23.repro2.log
lnd.log-13:37:58.log
lnd.log-13:44:58.log
alevchuk
on 23 Oct 2020
Possibly related: https://github.com/lightningnetwork/lnd/issues/4714
Connection issues would create more gossip?
 Crypt-iQ
on 23 Oct 2020
Crypt-iQ
on 23 Oct 2020
@Crypt-iQ after restart my node seems to run fine without connection issue but already with the high write load on disk. After a few days it starts to get connection issues as described in #4714.
Edit: This active/inactive connection issues seem to have startet at week 42.
hpbock
on 26 Oct 2020
My high write load disappeared again without me doing anything or any increase or decrease in channel number, peers, firewall throughput. Strange...
lnd-dl
on 30 Oct 2020
The reason was increased channel update gossip on the network. It has now gone back to more normal levels, which should result in less IO.
halseth
on 30 Oct 2020
Is there a need to persist every channel update gossip? It seems that they are overwriting the same spot on disk. Flushing memory periodically would make the the I/O usage constant - not vulnerable to gossip elevations.
alevchuk
on 30 Oct 2020
The reason was increased channel update gossip on the network. It has now gone back to more normal levels, which should result in less IO.
Please help me understand this. I'm new to this. Do we know what has caused the increase? Has someone with bad intentions flooded the network with these messages? Or does that occur naturally? I mean this could do harm to hardware especially if you use a PI with SD Cards as a hard disk.
lnd-dl
on 2 Nov 2020
@halseth The write load has decreased since last week, but the current write load is still five times higher than the average read load. Would it be feasible to take up the suggestion of @alevchuk and store the volatile channel graph rather in memory than directly disk?

hpbock
on 2 Nov 2020
but the current write load is still five times higher than the average read load
We have more gossip throttling planned, but I don't think that would change the ratio much ultimately. Access pattern wise, lnd will write more than it reads since most reads occur due to RPC calls or on start up.
Roasbeef
on 4 Nov 2020
What causes it to be necessary to persist every gossip update to disk? (sorry, it's a noob question. i'll start reading the book - i promise)
alevchuk
on 4 Nov 2020
What causes it to be necessary to persist every gossip update to disk?
It is not, we are working on better filtering of uninteresting gossip.
Will track this in https://github.com/lightningnetwork/lnd/issues/4724. Thank you all for the reports and feedback that got us to the bottom of this! ❤️
halseth
on 4 Nov 2020
I know a solution is in the works, but just reinforcing this issue one last time. With a brand new lnd wallet and no channels open, my desktop pc nearly grinds to a halt from disk i/o from channel updates. It is an older pc so others probably handle it better, but lnd is basically unusable for me currently. Love lnd though - thank you!
rytido
on 6 Nov 2020
Hey guys, as of 12 hours ago, this issue started happening again in most of my nodes, not sure if everyone is experiencing the same
gonzaloaune
on 13 Nov 2020
Related issues
 joostjager
·
3Comments
joostjager
·
3Comments
 BitBargain
·
3Comments
BitBargain
·
3Comments
 Richard87
·
3Comments
Richard87
·
3Comments
 alec-djinn
·
3Comments
alec-djinn
·
3Comments
 joaodealmeida
·
3Comments
joaodealmeida
·
3Comments
Most helpful comment
It is not, we are working on better filtering of uninteresting gossip.
Will track this in https://github.com/lightningnetwork/lnd/issues/4724. Thank you all for the reports and feedback that got us to the bottom of this! ❤️