Linkerd2: High memory usage on a destination controller
Bug Report
What is the issue?
The communication from linkerd injected pods to other linkerd injected pods suddenly stops. Restarting the control plane resolves it instantly.
 kforsthoevel
All 35 comments
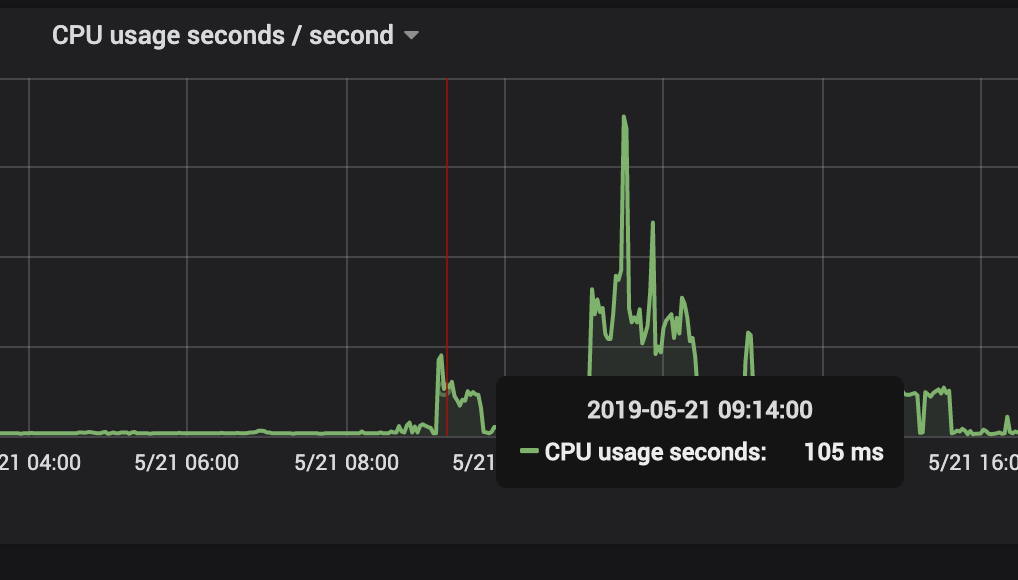
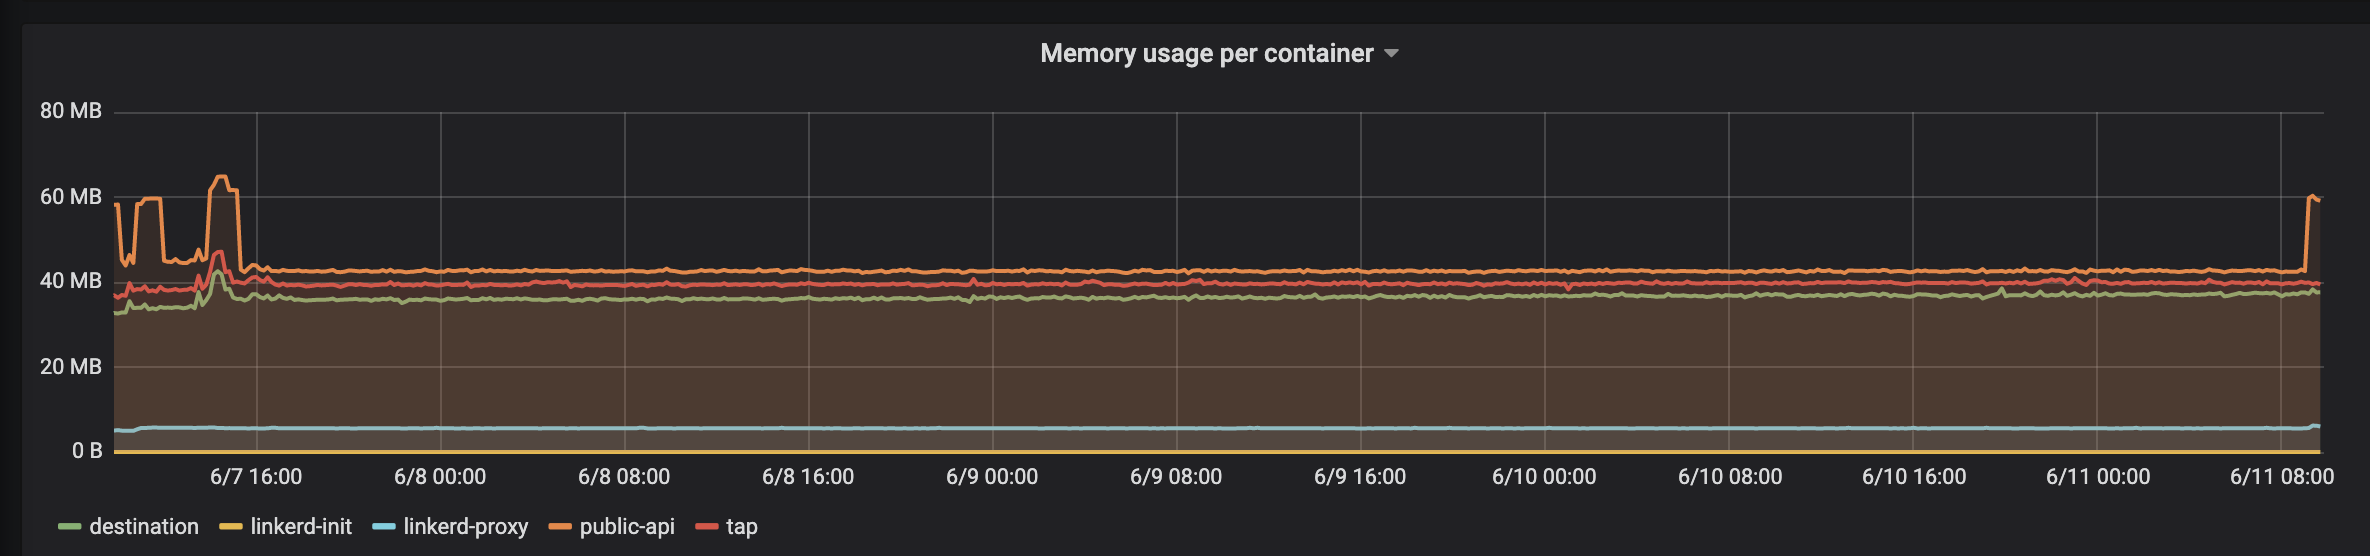
About 9:00 linkerd did not work anymore. Its the first small peak in memory.
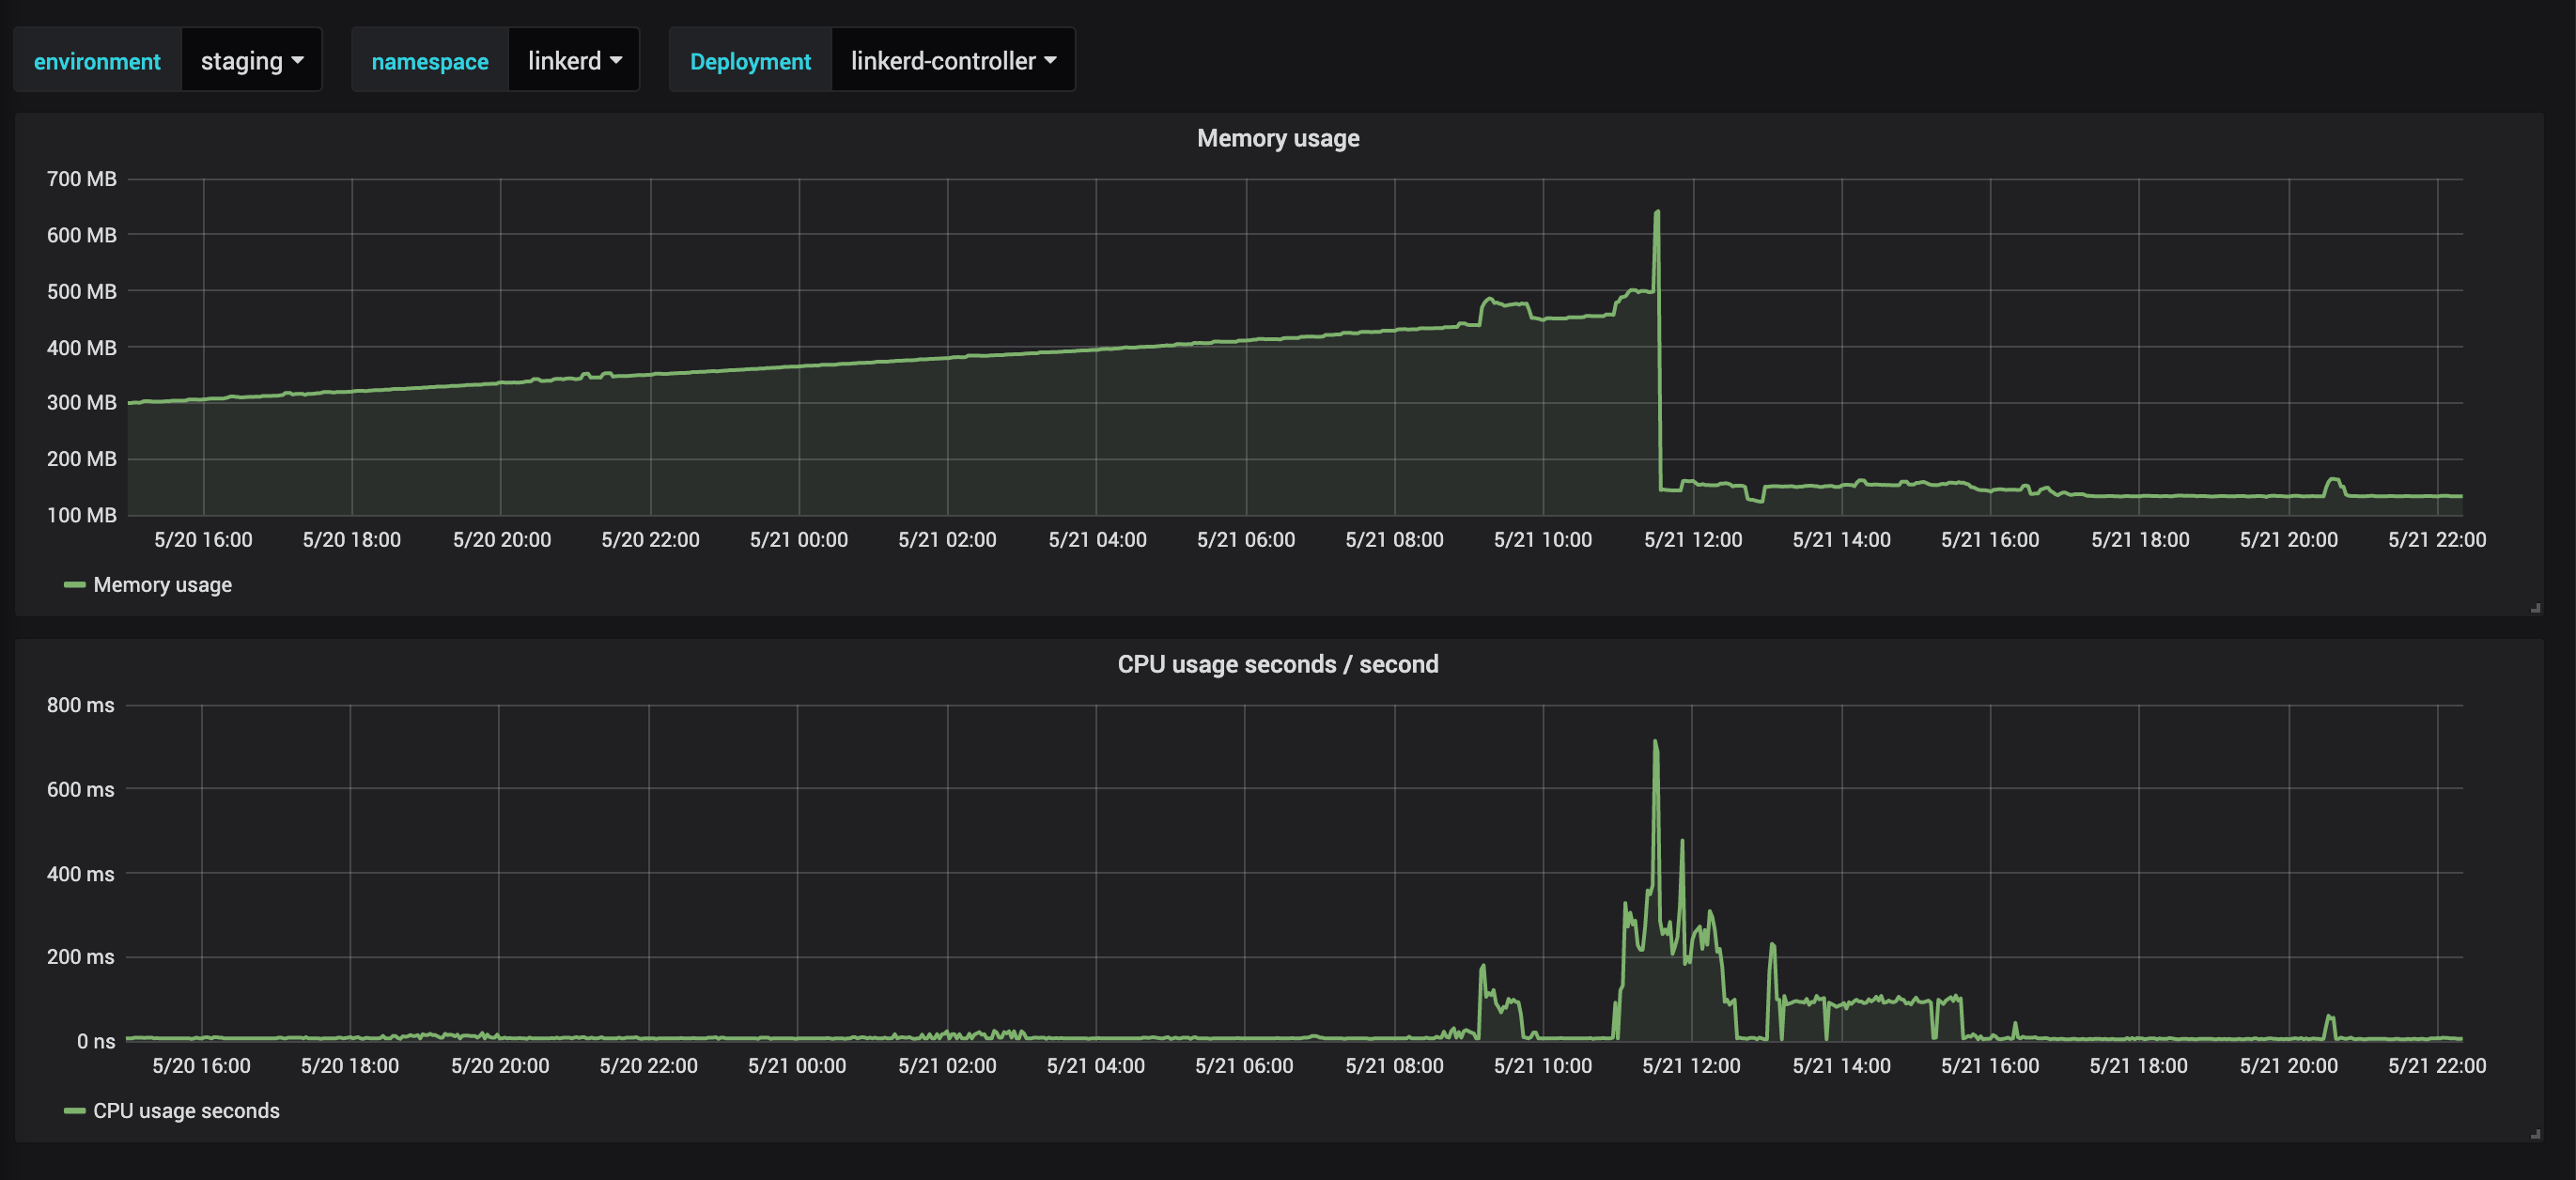
Memory going down was triggered through restart of linkerd-controller.
 thomaspeitz
on 22 May 2019
thomaspeitz
on 22 May 2019
This sounds like https://github.com/linkerd/linkerd2/issues/2703, for which we have a pretty good repro.
 olix0r
on 22 May 2019
olix0r
on 22 May 2019
@kforsthoevel @tsupertramp We'll have an important leak-fix in this week's edge-19.6.1. If you're eager to test this before the edge release, you can add the annotation config.linkerd.io/proxy-version: fix-2863-0 to your pod specs to try the most recent proxy version.
We're hopeful that this resolves your issues. Let us know!
olix0r
on 5 Jun 2019
Yeah awesome - We will try it out tomorrow and give you feedback.
thomaspeitz
on 5 Jun 2019
@thomaspeitz Have you had a chance to test edge-19.6.1 or stable-2.3.2 (both of which include our hopeful fix)? I'm hopeful we can close this issue out before stable-2.4.0.
olix0r
on 10 Jun 2019
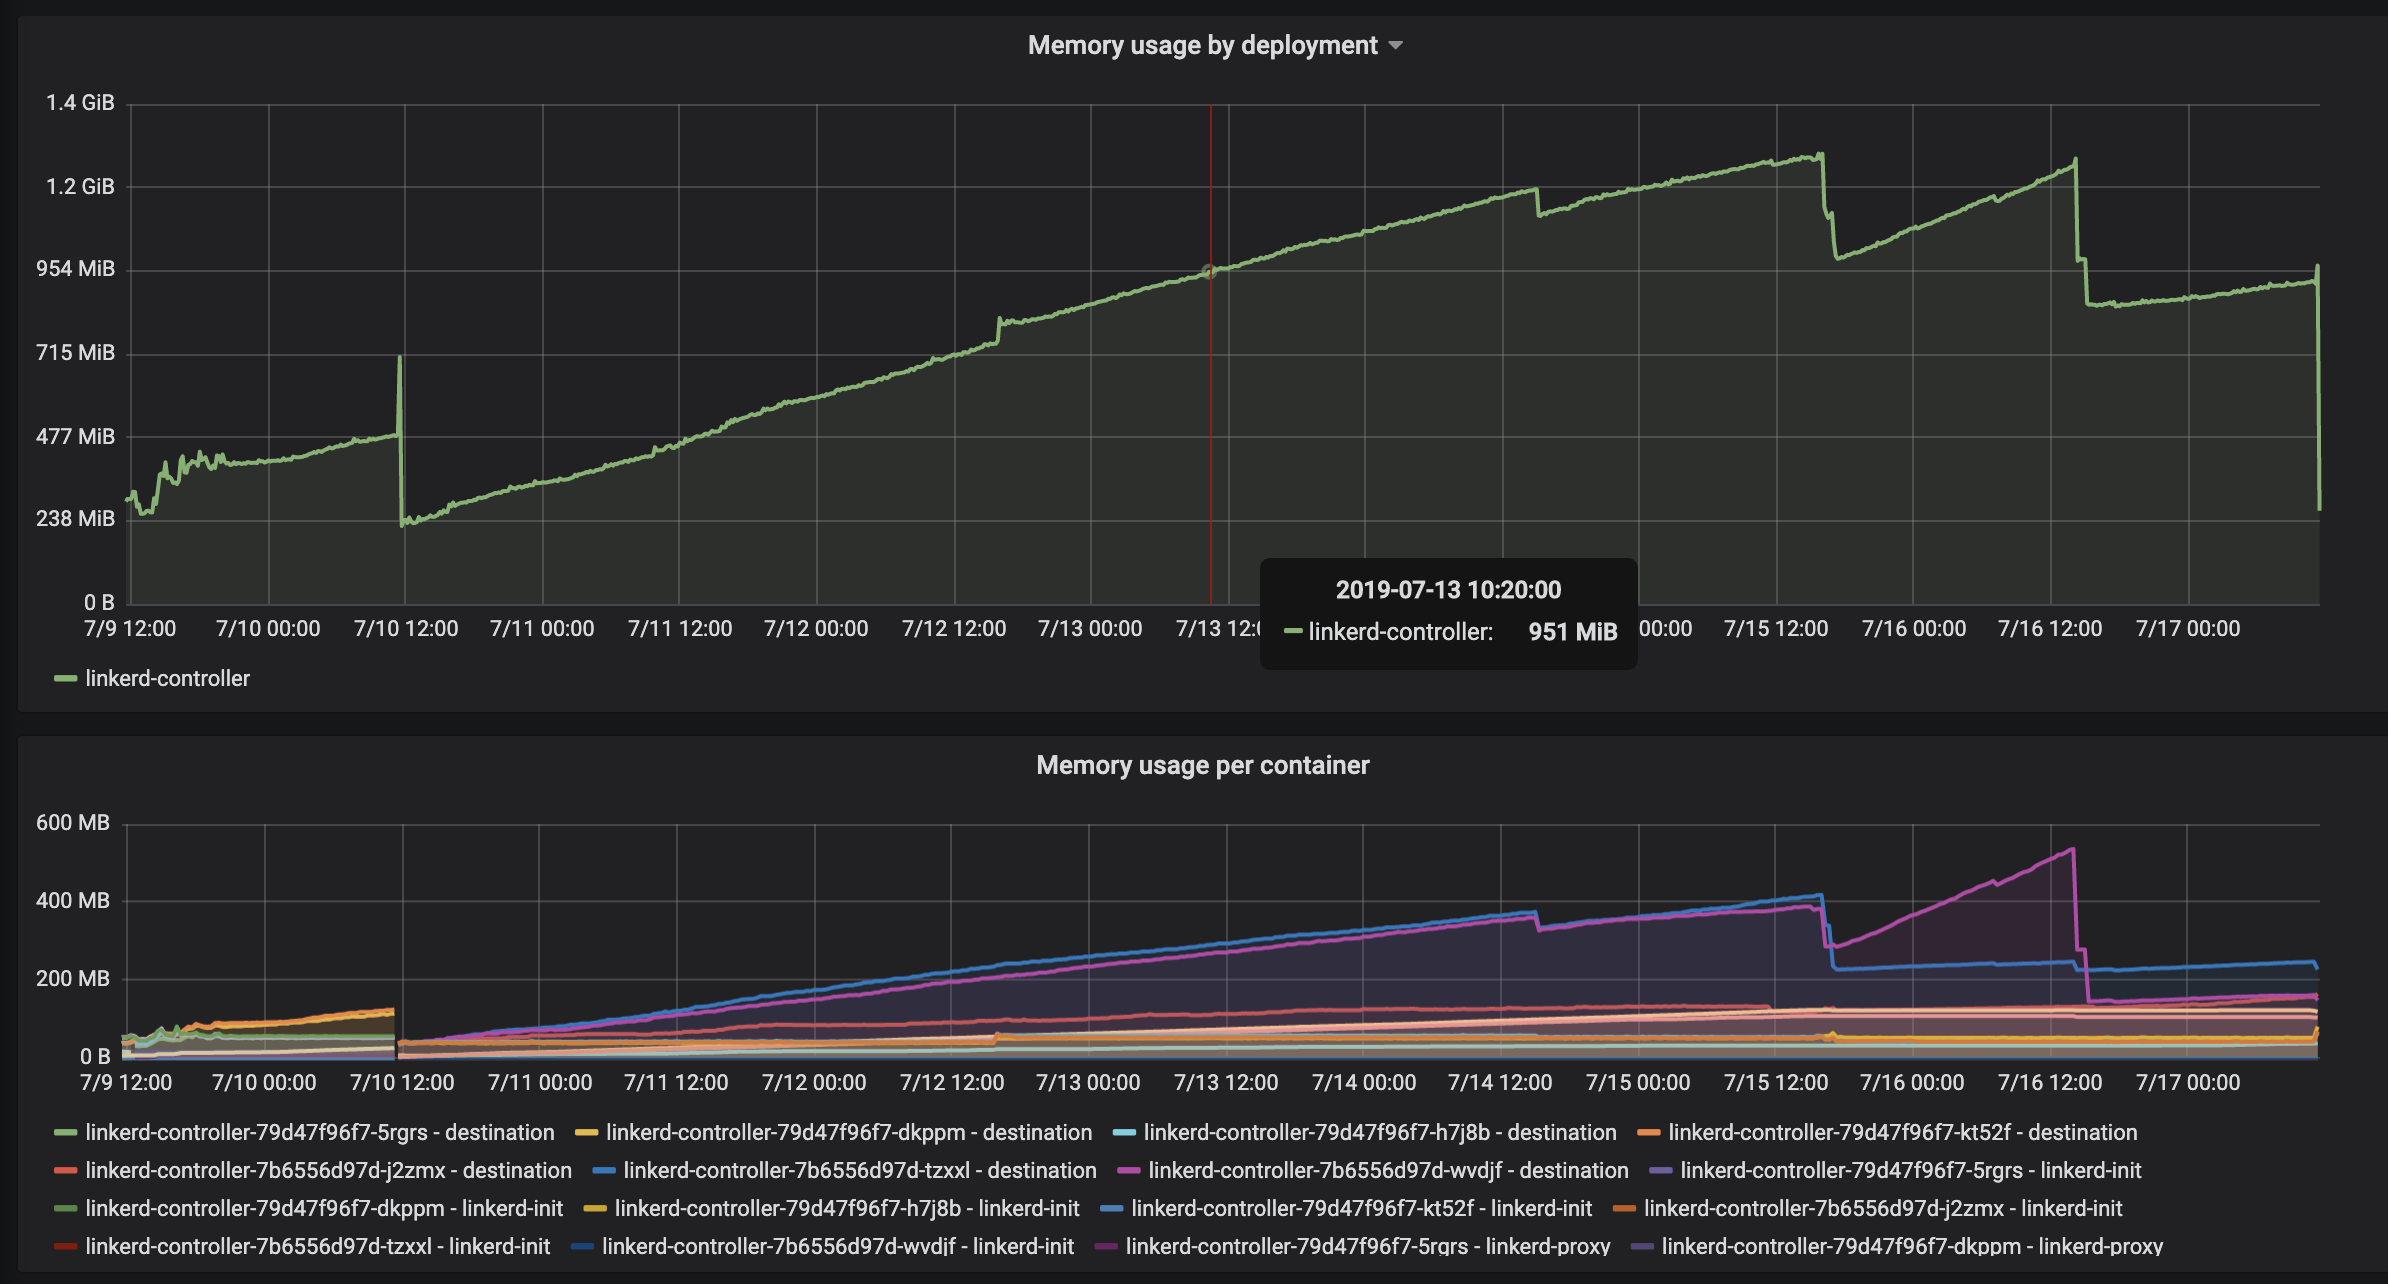
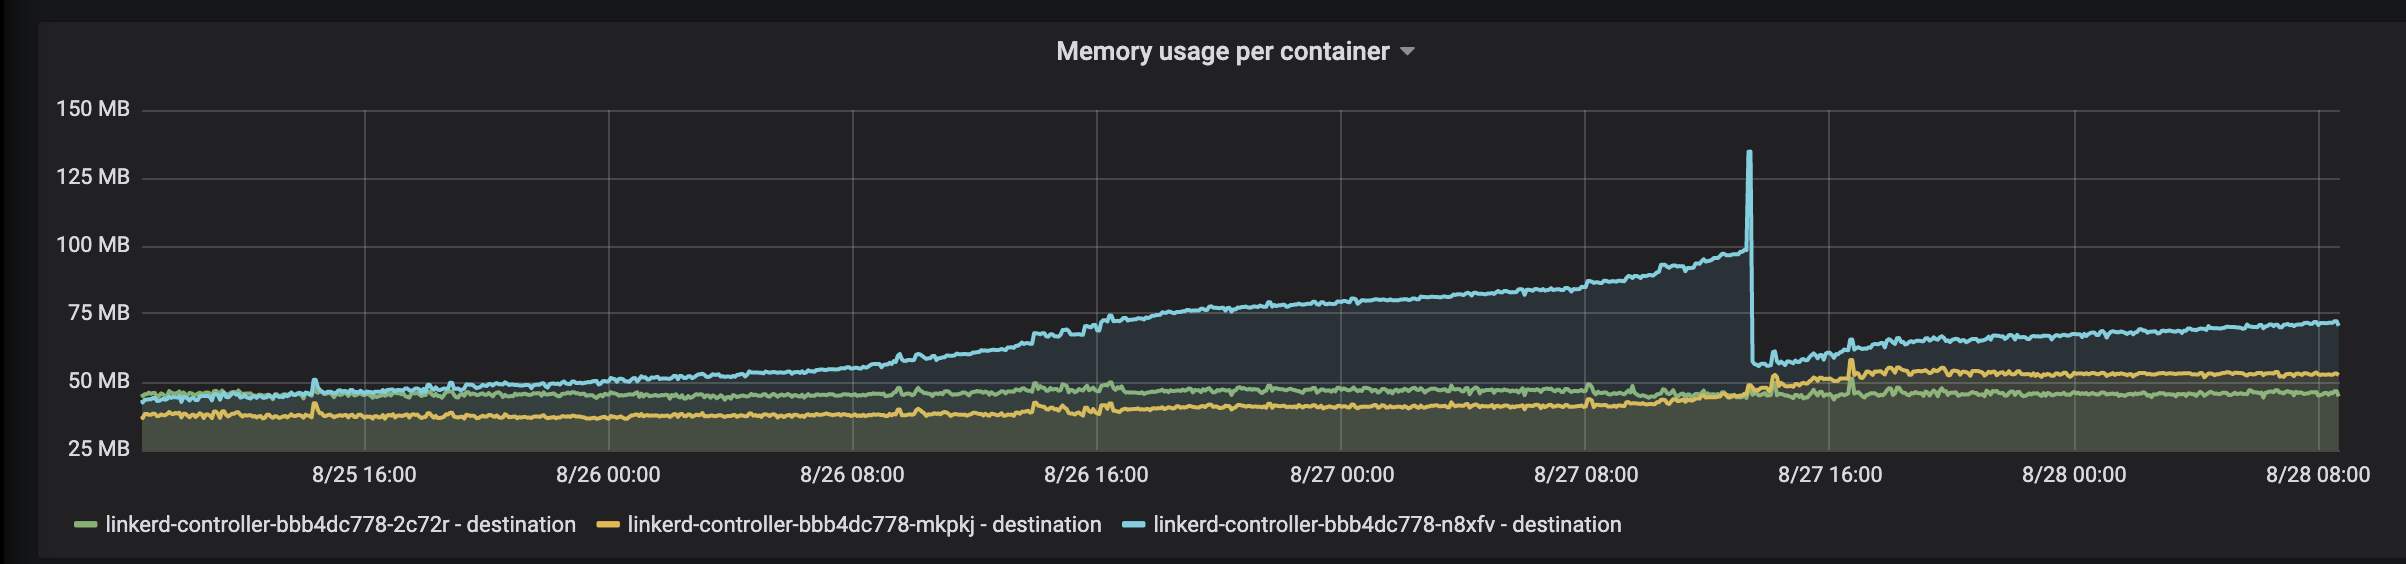
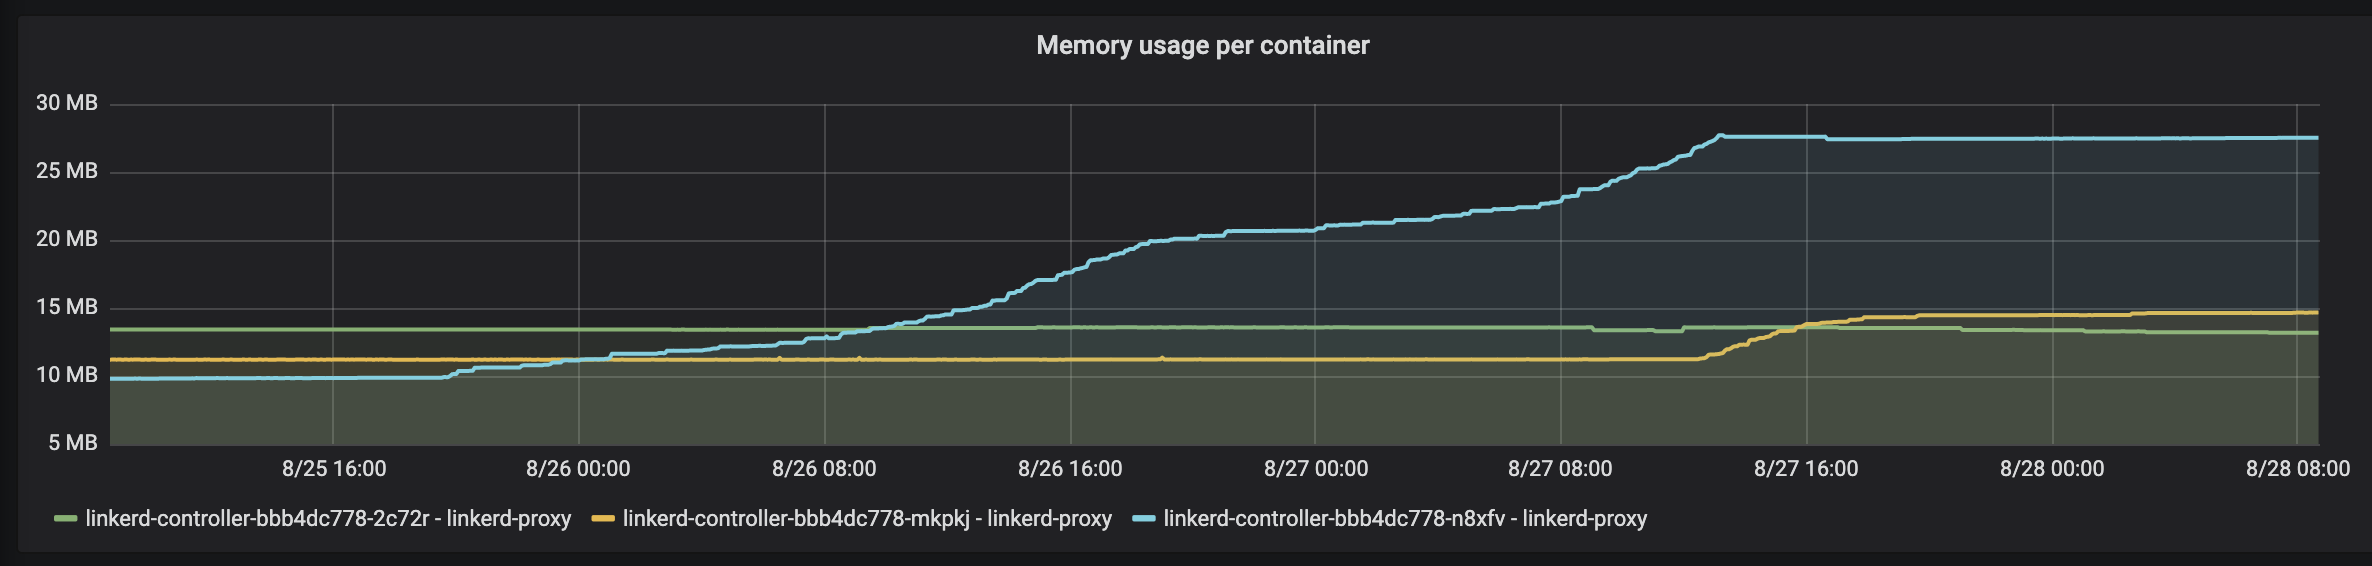
@olix0r We have upgraded on Friday (2019-06-07) to stable-2.3.2. So far, everything works fine, but I noticed a steep increase in memory for one of the linkerd-controller pods in the destination container - HA feature is enabled.
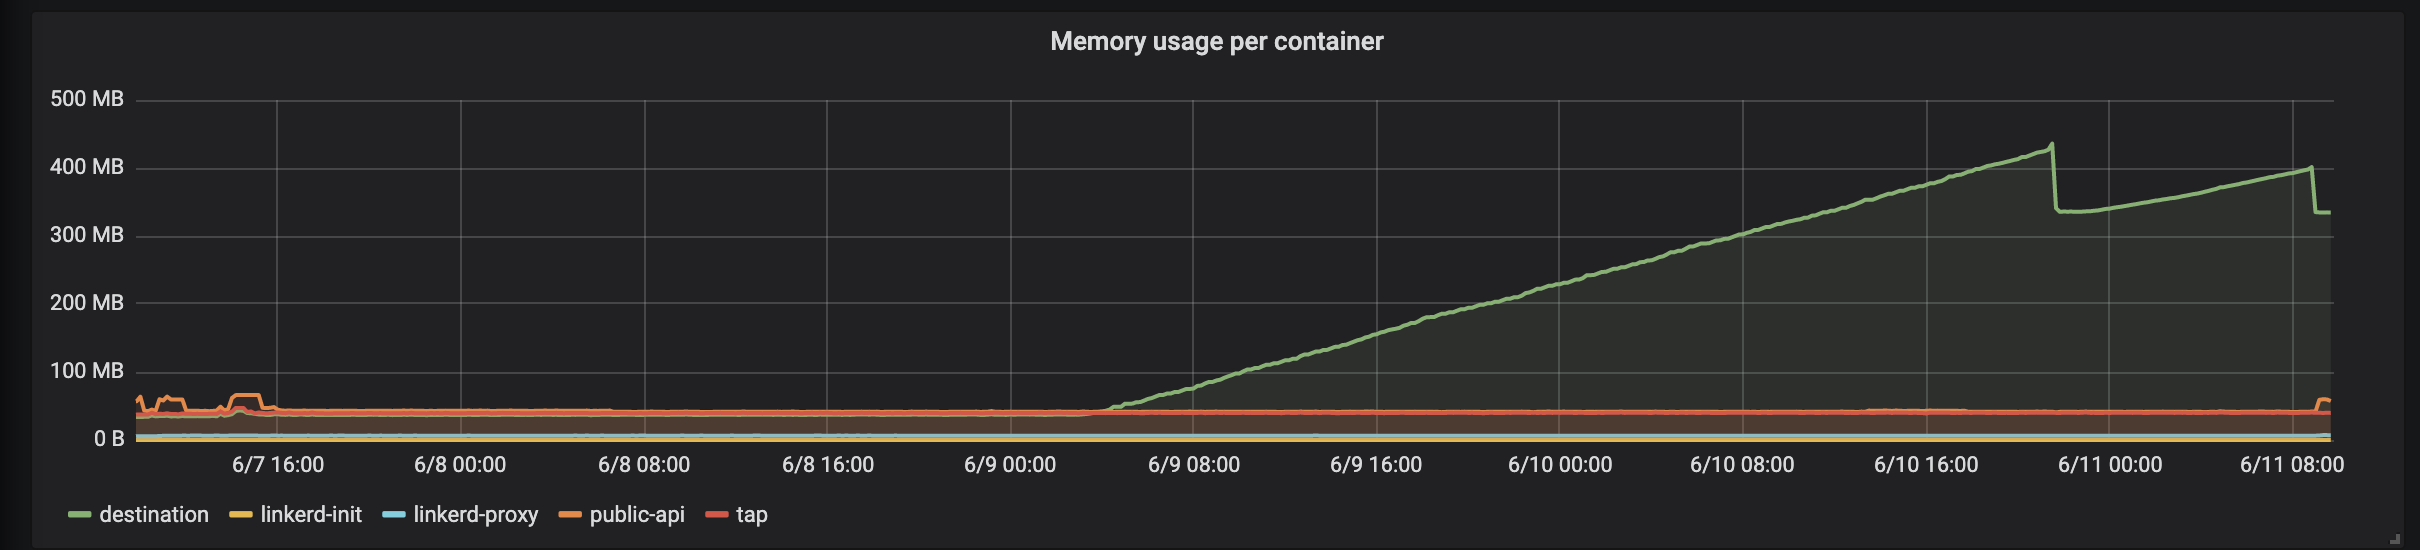
The other pods are fine.
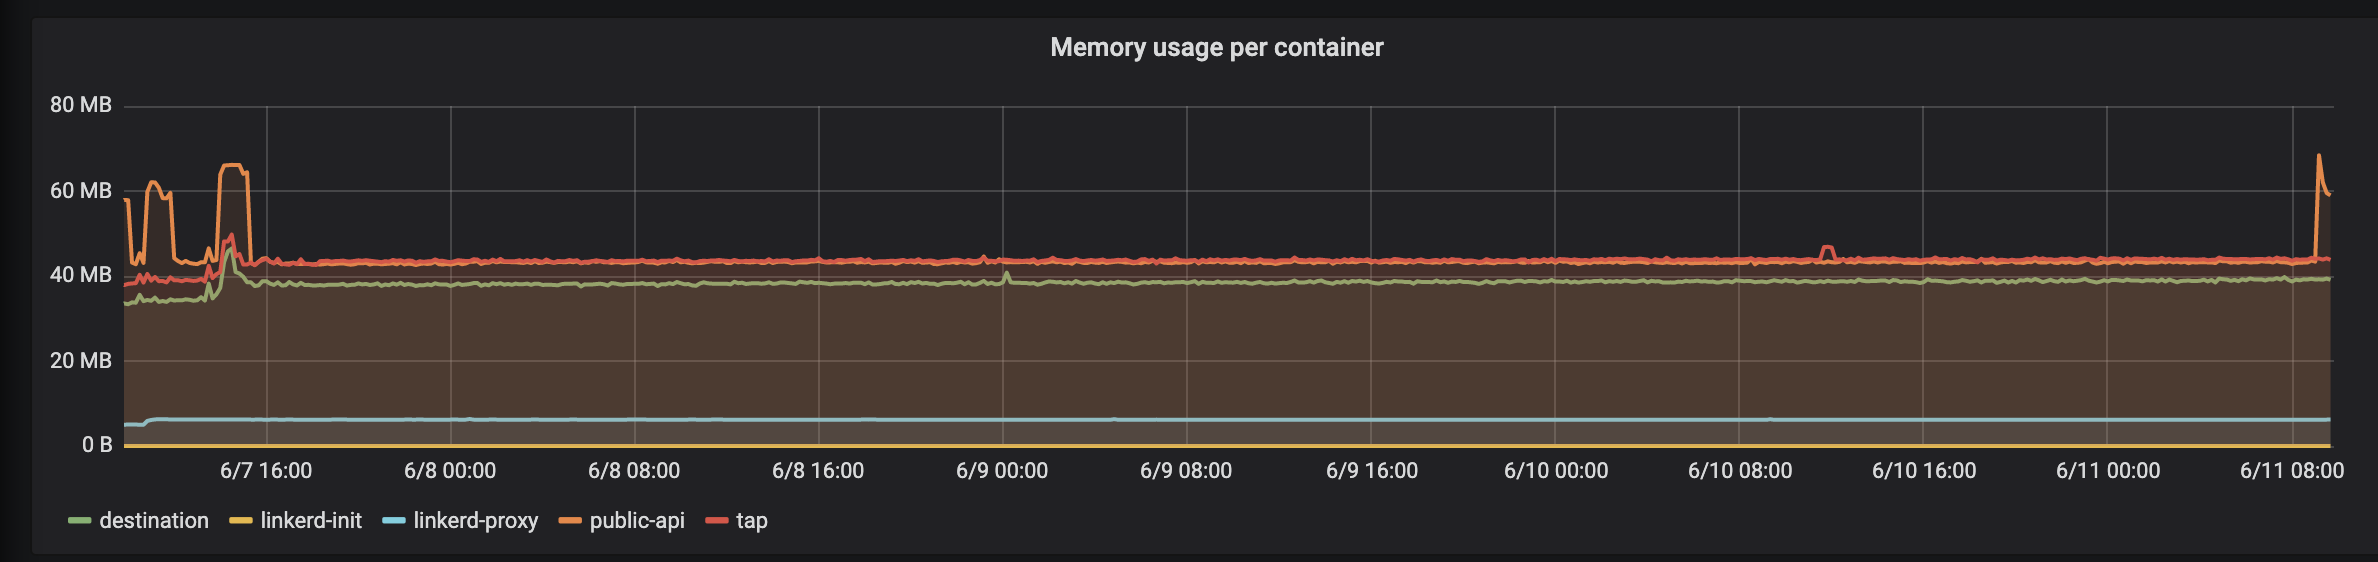
kforsthoevel
on 11 Jun 2019
@kforsthoevel thanks for the helpful graphs, Kai. Do you happen to have heapster enabled on this cluster? If so, the per-container metrics may help us narrow this down:
:; kubectl top po --containers -n linkerd
POD                                       NAME             CPU(cores)   MEMORY(bytes)
linkerd-controller-7b959977bd-ws2wf       public-api       0m           22Mi
linkerd-controller-7b959977bd-ws2wf       destination      0m           22Mi
linkerd-controller-7b959977bd-ws2wf       linkerd-proxy    1m           2Mi
linkerd-grafana-f64c96bfd-8smjd           grafana          3m           32Mi
linkerd-grafana-f64c96bfd-8smjd           linkerd-proxy    0m           1Mi
linkerd-identity-7dcb854d79-nk76w         identity         0m           15Mi
linkerd-identity-7dcb854d79-nk76w         linkerd-proxy    0m           2Mi
linkerd-prometheus-744f858f68-g6pkh       prometheus       6m           182Mi
linkerd-prometheus-744f858f68-g6pkh       linkerd-proxy    1m           3Mi
linkerd-proxy-injector-5cb44dc4d8-d4gdx   proxy-injector   0m           16Mi
linkerd-proxy-injector-5cb44dc4d8-d4gdx   linkerd-proxy    0m           1Mi
linkerd-sp-validator-5bd8c557d7-tnf4x     sp-validator     0m           11Mi
linkerd-sp-validator-5bd8c557d7-tnf4x     linkerd-proxy    0m           1Mi
linkerd-tap-56b9474dd6-hkx88              tap              0m           22Mi
linkerd-tap-56b9474dd6-hkx88              linkerd-proxy    0m           1Mi
linkerd-web-78767599f9-5zx7g              web              0m           14Mi
linkerd-web-78767599f9-5zx7g              linkerd-proxy    0m           1Mi
@olix0r Here are the metrics:
POD                                       NAME             CPU(cores)   MEMORY(bytes)
linkerd-controller-667fcb657-552q5        public-api       1m           40Mi
linkerd-controller-667fcb657-552q5        destination      1m           344Mi
linkerd-controller-667fcb657-552q5        tap              1m           38Mi
linkerd-controller-667fcb657-552q5        linkerd-proxy    2m           6Mi
linkerd-controller-667fcb657-6565t        tap              1m           42Mi
linkerd-controller-667fcb657-6565t        linkerd-proxy    2m           5Mi
linkerd-controller-667fcb657-6565t        destination      2m           40Mi
linkerd-controller-667fcb657-6565t        public-api       1m           41Mi
linkerd-controller-667fcb657-xnttb        tap              1m           39Mi
linkerd-controller-667fcb657-xnttb        public-api       2m           40Mi
linkerd-controller-667fcb657-xnttb        linkerd-proxy    2m           5Mi
linkerd-controller-667fcb657-xnttb        destination      2m           38Mi
linkerd-grafana-945c7588b-6gcjt           grafana          3m           29Mi
linkerd-grafana-945c7588b-6gcjt           linkerd-proxy    1m           1Mi
linkerd-identity-6df4fb89bc-78glc         identity         1m           13Mi
linkerd-identity-6df4fb89bc-78glc         linkerd-proxy    1m           3Mi
linkerd-identity-6df4fb89bc-bpwzw         linkerd-proxy    1m           4Mi
linkerd-identity-6df4fb89bc-bpwzw         identity         1m           12Mi
linkerd-identity-6df4fb89bc-vn8w5         identity         1m           11Mi
linkerd-identity-6df4fb89bc-vn8w5         linkerd-proxy    1m           3Mi
linkerd-prometheus-97b48866f-pvwgn        prometheus       26m          881Mi
linkerd-prometheus-97b48866f-pvwgn        linkerd-proxy    22m          45Mi
linkerd-proxy-injector-68778786cf-7sd9n   linkerd-proxy    1m           1Mi
linkerd-proxy-injector-68778786cf-7sd9n   proxy-injector   1m           20Mi
linkerd-sp-validator-77fd94b5f4-mhw7r     sp-validator     1m           7Mi
linkerd-sp-validator-77fd94b5f4-mhw7r     linkerd-proxy    1m           1Mi
linkerd-web-796b57984f-9g8dp              linkerd-proxy    1m           7Mi
linkerd-web-796b57984f-9g8dp              web              1m           15Mi
@kforsthoevel thanks for the quick reply!
It looks like one of the destination containers is 10x the size of the others:
linkerd-controller-667fcb657-552q5        destination      1m           344Mi
linkerd-controller-667fcb657-6565t        destination      2m           40Mi
linkerd-controller-667fcb657-xnttb        destination      2m           38Mi
Is there anything notable in the output of :; kubectl logs -n linkerd -c destination linkerd-controller-667fcb657-552q5?
olix0r
on 11 Jun 2019
Also, I should note that we edge-19.6.1 included substantial changes to the destination controller's internals. If it's not too disruptive, I'd be curious if you can replicate this behavior on last week's edge release? In the meantime, I'll see if I can replicate anything like this in our test clusters.
olix0r
on 11 Jun 2019
There are a lot of messages like this:
level=error msg="Failed to send address update: rpc error: code = Canceled desc = context canceled" component=endpoint-listener namespace=default service=<SERVICE_NAME>
And a few of these:
level=error msg="[100.96.4.65 <POD>.default] failed to lookup pod: pod \"<POD>\" not found" component=service-port id=<POD>.default target-port=http
kforsthoevel
on 11 Jun 2019
@kforsthoevel Okay, thanks. That's helpful. I have a guess at what's going on; and that code path has, indeed, changed a lot since the 2.3 branch. If you have a chance, it would be good to confirm whether this behavior is still present on last week's edge; but I think that gives us enough data to start looking into this on our side as well. Thanks!
olix0r
on 11 Jun 2019
BTW, no errors in log for linkerd-controller-667fcb657-6565t but a lot of rpc error messages in linkerd-controller-667fcb657-xnttb. No error messages about failed to lookup pod.
kforsthoevel
on 11 Jun 2019
FYI - I got some errors where one application couldn't reach another application. Found this in the logs of the linkerd-proxy:
WARN [ 1251.767033s] proxy={server=out listen=127.0.0.1:4140 remote=100.96.128.119:37123} linkerd2_proxy::app::errors request aborted because it reached the configured dispatch deadline
After killing the linkerd-controller pod w/ high memory, everything was fine again.
kforsthoevel
on 11 Jun 2019
@olix0r We have had the same error again yesterday. Outbound communications stops, same error messages in destination and linkerd-proxy. But no significant increase in memory.
After restarting the linkerd-controller pod, everything works fine again.
I have switched to edge-19.6.1 afterwards.
kforsthoevel
on 13 Jun 2019
@kforsthoevel thanks for the updates. If you see this issue again, can you try to snapshot the proxy's metrics:
linkerd metrics -n linkerd deploy/linkerd-controller
linkerd metrics -n $yourns pod/$pod-logging-errors
note: you may want to redact hostnames or send it to me on slack if it's sensitive
thanks!
olix0r
on 13 Jun 2019
Hi @kforsthoevel. Just following up, any luck testing/reproducing this with the latest edge-19.6.3? Or even edge-19.6.1?
 siggy
on 24 Jun 2019
siggy
on 24 Jun 2019
Hi @siggy. We haven't run into the issue again. We have upgraded to edge-16.6.3.
kforsthoevel
on 26 Jun 2019
@kforsthoevel That's great to hear! I'm going to close this issue for now, please re-open if you encounter the issue again.
siggy
on 26 Jun 2019
It happend again. All communication from linkerd injected pod to other pods stopped. Killing all linkerd-controller pods solved the problem instantly. We are running edge-19.7.3. @olix0r could you help us please?
kforsthoevel
on 17 Jul 2019
Hey @kforsthoevel! In edge-19.7.3 and later we added some better metrics to the destination service that should make this kind of thing easier to debug. When you experience a destination container in this state, can you grab a snapshot of its metrics?
kubectl -n linkerd port-forward <controller pod> 9996
curl http://localhost:9996/metrics
 adleong
on 17 Jul 2019
adleong
on 17 Jul 2019
@kforsthoevel When you have a moment, please try the newly released linkerd 2.5.0
The 2.5.0 release includes a fix which ensures that the proxy cancels destination resolutions: https://github.com/linkerd/linkerd2-proxy/pull/307
 cpretzer
on 21 Aug 2019
cpretzer
on 21 Aug 2019
I have just upgraded to stable-2.5.0.
kforsthoevel
on 21 Aug 2019
@kforsthoevel that's great to hear. Please let us know whether you can reproduce the high memory scenario in the destination controller.
cpretzer
on 21 Aug 2019
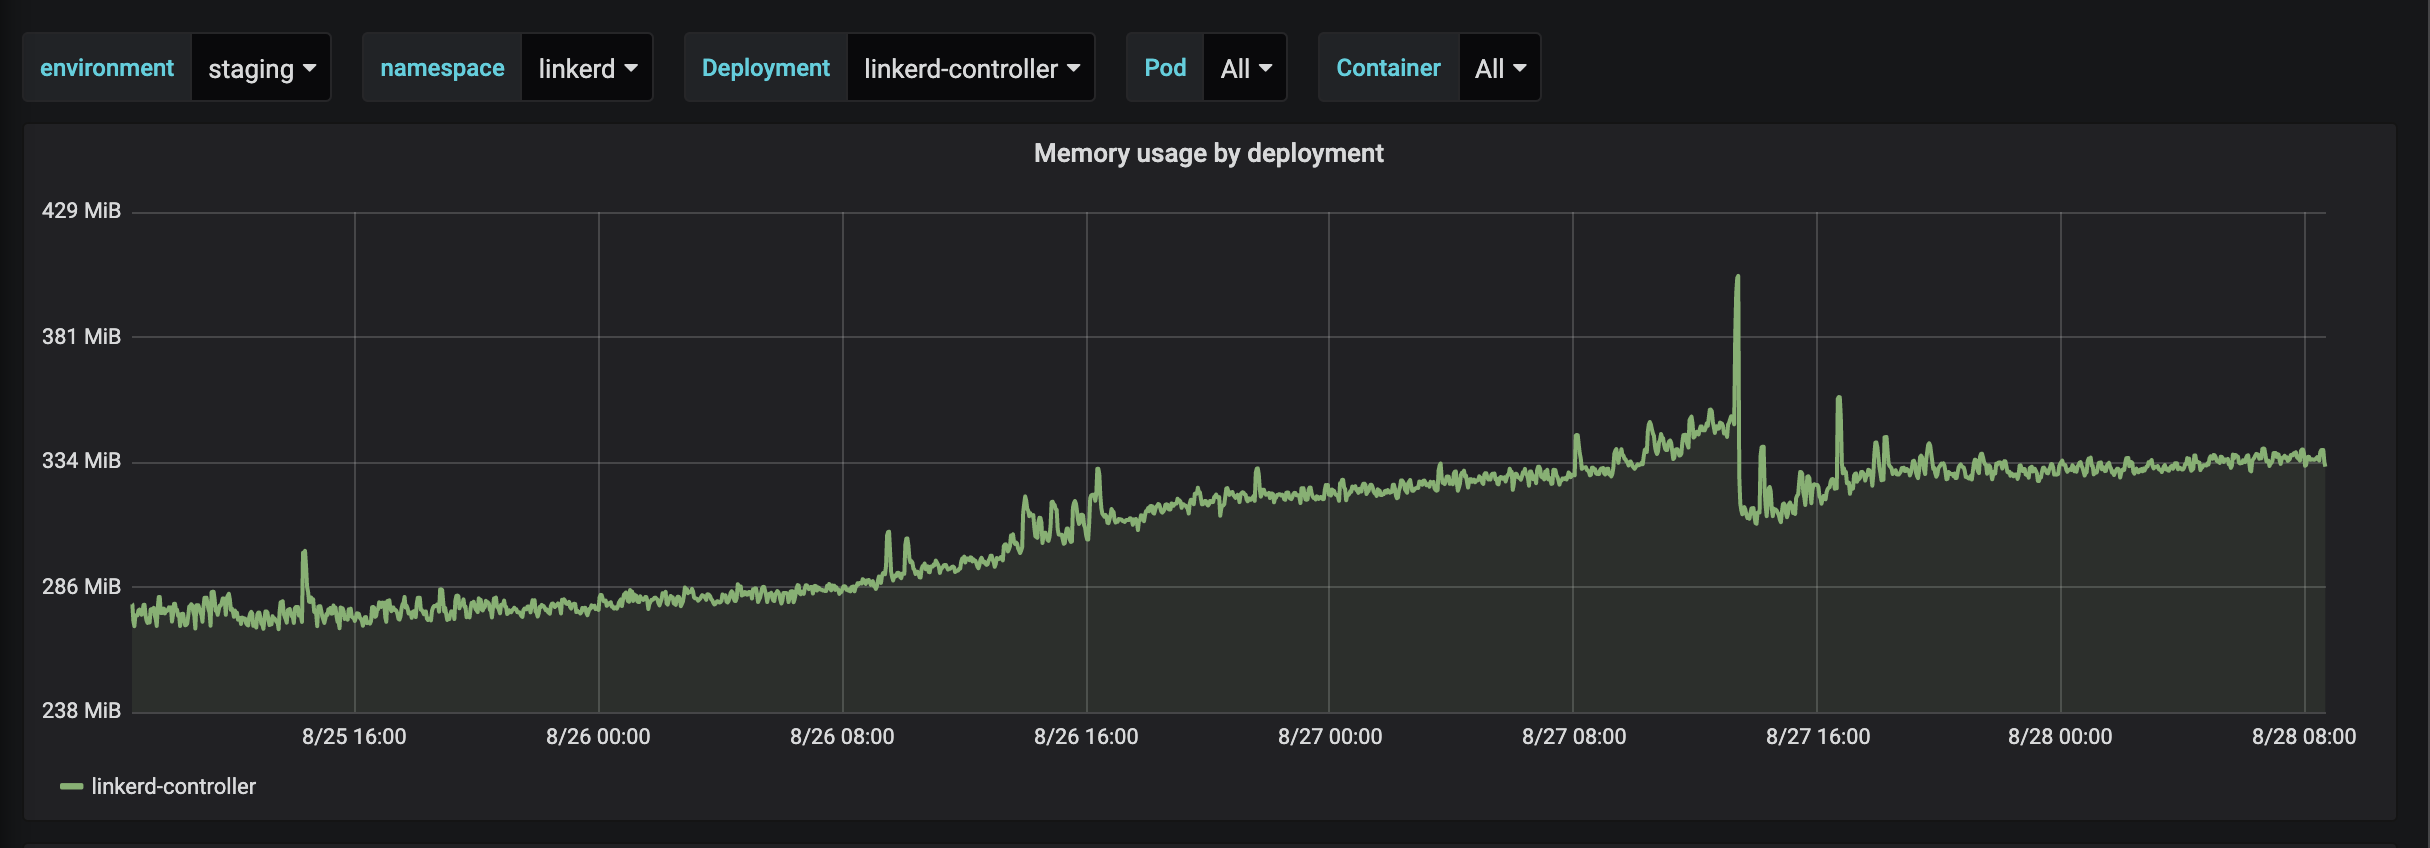
@cpretzer Linkerd stable-2.5.0 on kubernetes v1.13.10 (AWS w/ kops)
kforsthoevel
on 28 Aug 2019
@kforsthoevel Thanks, that's good information.
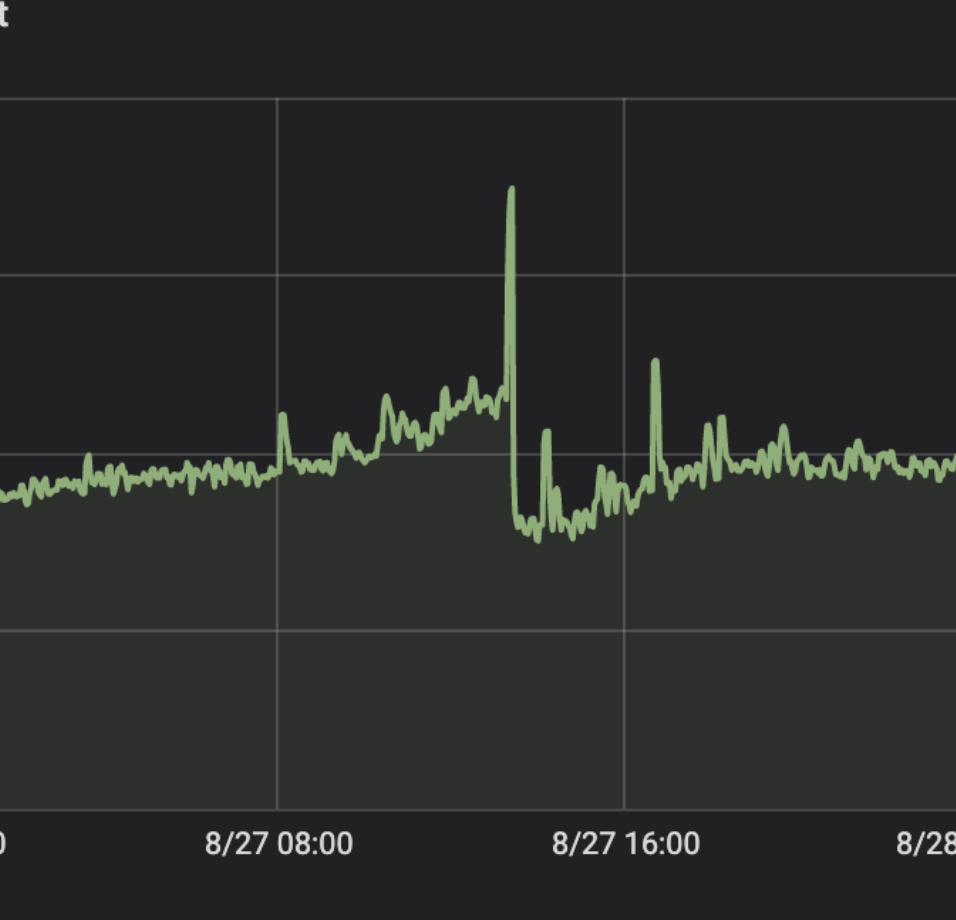
Do you have details about the conditions under which this happens? The graph shows just about three days of data. Is there any additional data around the time of the memory spike on the 27th?
We observed the original behavior by creating 100 pods, then deleting them using the kubectl delete command. Said another way, that means that we killed the pods down in an ungraceful manner. Is there a lot of pod scaling going on in that environment?
In addition the metrics for the destination controller will be helpful to collect because that's what we used to debug the issue for #3235
kubectl -n linkerd port-forward deploy/linkerd-controller 9996 &
curl localhost:9996/metrics
# HELP endpoints_exists A gauge which is 1 if the endpoints exists and 0 if it does not.
# TYPE endpoints_exists gauge
endpoints_exists{hostname="",namespace="default",port="80",service="h-agent-status-api"} 1
endpoints_exists{hostname="",namespace="default",port="80",service="h-auth"} 1
endpoints_exists{hostname="",namespace="default",port="80",service="h-events-api"} 1
endpoints_exists{hostname="",namespace="default",port="80",service="h-forecast"} 1
endpoints_exists{hostname="",namespace="default",port="80",service="h-forecast-model-selector"} 1
endpoints_exists{hostname="",namespace="default",port="80",service="h-integrations-configuration"} 1
endpoints_exists{hostname="",namespace="default",port="80",service="h-iwfm-api"} 1
endpoints_exists{hostname="",namespace="default",port="80",service="h-iwfm-hosts"} 1
endpoints_exists{hostname="",namespace="default",port="80",service="h-onboarding-api"} 1
endpoints_exists{hostname="",namespace="default",port="80",service="h-public-holidays-api"} 1
endpoints_exists{hostname="",namespace="default",port="80",service="h-queue-store-api"} 1
endpoints_exists{hostname="",namespace="default",port="80",service="h-staff-requirements"} 1
endpoints_exists{hostname="",namespace="default",port="80",service="h-workload-holidayregion-mapper"} 1
endpoints_exists{hostname="",namespace="default",port="80",service="h-workload-mode-tracker"} 1
endpoints_exists{hostname="",namespace="default",port="80",service="h-workloads-api"} 1
endpoints_exists{hostname="",namespace="default",port="8080",service="h-forecast"} 1
endpoints_exists{hostname="",namespace="default",port="8080",service="h-queue-elements"} 1
endpoints_exists{hostname="",namespace="default",port="8080",service="h-queue-metadata"} 1
endpoints_exists{hostname="",namespace="default",port="8080",service="h-queue-store-api"} 1
endpoints_exists{hostname="",namespace="linkerd",port="8085",service="linkerd-controller-api"} 1
# HELP endpoints_pods A gauge for the current number of pods in a endpoints.
# TYPE endpoints_pods gauge
endpoints_pods{hostname="",namespace="default",port="80",service="h-agent-status-api"} 2
endpoints_pods{hostname="",namespace="default",port="80",service="h-auth"} 2
endpoints_pods{hostname="",namespace="default",port="80",service="h-events-api"} 2
endpoints_pods{hostname="",namespace="default",port="80",service="h-forecast"} 2
endpoints_pods{hostname="",namespace="default",port="80",service="h-forecast-model-selector"} 2
endpoints_pods{hostname="",namespace="default",port="80",service="h-integrations-configuration"} 2
endpoints_pods{hostname="",namespace="default",port="80",service="h-iwfm-api"} 2
endpoints_pods{hostname="",namespace="default",port="80",service="h-iwfm-hosts"} 2
endpoints_pods{hostname="",namespace="default",port="80",service="h-onboarding-api"} 2
endpoints_pods{hostname="",namespace="default",port="80",service="h-public-holidays-api"} 2
endpoints_pods{hostname="",namespace="default",port="80",service="h-queue-store-api"} 2
endpoints_pods{hostname="",namespace="default",port="80",service="h-staff-requirements"} 2
endpoints_pods{hostname="",namespace="default",port="80",service="h-workload-holidayregion-mapper"} 2
endpoints_pods{hostname="",namespace="default",port="80",service="h-workload-mode-tracker"} 2
endpoints_pods{hostname="",namespace="default",port="80",service="h-workloads-api"} 2
endpoints_pods{hostname="",namespace="default",port="8080",service="h-forecast"} 2
endpoints_pods{hostname="",namespace="default",port="8080",service="h-queue-elements"} 1
endpoints_pods{hostname="",namespace="default",port="8080",service="h-queue-metadata"} 1
endpoints_pods{hostname="",namespace="default",port="8080",service="h-queue-store-api"} 2
endpoints_pods{hostname="",namespace="linkerd",port="8085",service="linkerd-controller-api"} 3
# HELP endpoints_subscribers A gauge for the current number of subscribers to a endpoints.
# TYPE endpoints_subscribers gauge
endpoints_subscribers{hostname="",namespace="default",port="80",service="h-agent-status-api"} 1
endpoints_subscribers{hostname="",namespace="default",port="80",service="h-auth"} 9
endpoints_subscribers{hostname="",namespace="default",port="80",service="h-events-api"} 2
endpoints_subscribers{hostname="",namespace="default",port="80",service="h-forecast"} 1
endpoints_subscribers{hostname="",namespace="default",port="80",service="h-forecast-model-selector"} 3
endpoints_subscribers{hostname="",namespace="default",port="80",service="h-integrations-configuration"} 7
endpoints_subscribers{hostname="",namespace="default",port="80",service="h-iwfm-api"} 2
endpoints_subscribers{hostname="",namespace="default",port="80",service="h-iwfm-hosts"} 3
endpoints_subscribers{hostname="",namespace="default",port="80",service="h-onboarding-api"} 1
endpoints_subscribers{hostname="",namespace="default",port="80",service="h-public-holidays-api"} 2
endpoints_subscribers{hostname="",namespace="default",port="80",service="h-queue-store-api"} 4
endpoints_subscribers{hostname="",namespace="default",port="80",service="h-staff-requirements"} 1
endpoints_subscribers{hostname="",namespace="default",port="80",service="h-workload-holidayregion-mapper"} 2
endpoints_subscribers{hostname="",namespace="default",port="80",service="h-workload-mode-tracker"} 1
endpoints_subscribers{hostname="",namespace="default",port="80",service="h-workloads-api"} 6
endpoints_subscribers{hostname="",namespace="default",port="8080",service="h-forecast"} 1
endpoints_subscribers{hostname="",namespace="default",port="8080",service="h-queue-elements"} 2
endpoints_subscribers{hostname="",namespace="default",port="8080",service="h-queue-metadata"} 2
endpoints_subscribers{hostname="",namespace="default",port="8080",service="h-queue-store-api"} 5
endpoints_subscribers{hostname="",namespace="linkerd",port="8085",service="linkerd-controller-api"} 1
# HELP endpoints_updates A counter for number of updates to a endpoints.
# TYPE endpoints_updates counter
endpoints_updates{hostname="",namespace="default",port="80",service="h-agent-status-api"} 425
endpoints_updates{hostname="",namespace="default",port="80",service="h-auth"} 1174
endpoints_updates{hostname="",namespace="default",port="80",service="h-events-api"} 534
endpoints_updates{hostname="",namespace="default",port="80",service="h-forecast"} 533
endpoints_updates{hostname="",namespace="default",port="80",service="h-forecast-model-selector"} 27
endpoints_updates{hostname="",namespace="default",port="80",service="h-integrations-configuration"} 1277
endpoints_updates{hostname="",namespace="default",port="80",service="h-iwfm-api"} 471
endpoints_updates{hostname="",namespace="default",port="80",service="h-iwfm-hosts"} 1215
endpoints_updates{hostname="",namespace="default",port="80",service="h-onboarding-api"} 440
endpoints_updates{hostname="",namespace="default",port="80",service="h-public-holidays-api"} 440
endpoints_updates{hostname="",namespace="default",port="80",service="h-queue-store-api"} 1185
endpoints_updates{hostname="",namespace="default",port="80",service="h-staff-requirements"} 534
endpoints_updates{hostname="",namespace="default",port="80",service="h-workload-holidayregion-mapper"} 427
endpoints_updates{hostname="",namespace="default",port="80",service="h-workload-mode-tracker"} 4
endpoints_updates{hostname="",namespace="default",port="80",service="h-workloads-api"} 1205
endpoints_updates{hostname="",namespace="default",port="8080",service="h-forecast"} 408
endpoints_updates{hostname="",namespace="default",port="8080",service="h-queue-elements"} 93
endpoints_updates{hostname="",namespace="default",port="8080",service="h-queue-metadata"} 144
endpoints_updates{hostname="",namespace="default",port="8080",service="h-queue-store-api"} 1211
endpoints_updates{hostname="",namespace="linkerd",port="8085",service="linkerd-controller-api"} 1107
# HELP go_gc_duration_seconds A summary of the GC invocation durations.
# TYPE go_gc_duration_seconds summary
go_gc_duration_seconds{quantile="0"} 1.263e-05
go_gc_duration_seconds{quantile="0.25"} 1.9559e-05
go_gc_duration_seconds{quantile="0.5"} 3.2724e-05
go_gc_duration_seconds{quantile="0.75"} 5.9953e-05
go_gc_duration_seconds{quantile="1"} 0.000950081
go_gc_duration_seconds_sum 0.463055774
go_gc_duration_seconds_count 6046
# HELP go_goroutines Number of goroutines that currently exist.
# TYPE go_goroutines gauge
go_goroutines 283
# HELP go_info Information about the Go environment.
# TYPE go_info gauge
go_info{version="go1.12.7"} 1
# HELP go_memstats_alloc_bytes Number of bytes allocated and still in use.
# TYPE go_memstats_alloc_bytes gauge
go_memstats_alloc_bytes 2.6110704e+07
# HELP go_memstats_alloc_bytes_total Total number of bytes allocated, even if freed.
# TYPE go_memstats_alloc_bytes_total counter
go_memstats_alloc_bytes_total 4.6831761288e+10
# HELP go_memstats_buck_hash_sys_bytes Number of bytes used by the profiling bucket hash table.
# TYPE go_memstats_buck_hash_sys_bytes gauge
go_memstats_buck_hash_sys_bytes 2.028376e+06
# HELP go_memstats_frees_total Total number of frees.
# TYPE go_memstats_frees_total counter
go_memstats_frees_total 3.84204311e+08
# HELP go_memstats_gc_cpu_fraction The fraction of this program's available CPU time used by the GC since the program started.
# TYPE go_memstats_gc_cpu_fraction gauge
go_memstats_gc_cpu_fraction 2.335249728579783e-05
# HELP go_memstats_gc_sys_bytes Number of bytes used for garbage collection system metadata.
# TYPE go_memstats_gc_sys_bytes gauge
go_memstats_gc_sys_bytes 2.635776e+06
# HELP go_memstats_heap_alloc_bytes Number of heap bytes allocated and still in use.
# TYPE go_memstats_heap_alloc_bytes gauge
go_memstats_heap_alloc_bytes 2.6110704e+07
# HELP go_memstats_heap_idle_bytes Number of heap bytes waiting to be used.
# TYPE go_memstats_heap_idle_bytes gauge
go_memstats_heap_idle_bytes 3.05152e+07
# HELP go_memstats_heap_inuse_bytes Number of heap bytes that are in use.
# TYPE go_memstats_heap_inuse_bytes gauge
go_memstats_heap_inuse_bytes 3.3906688e+07
# HELP go_memstats_heap_objects Number of allocated objects.
# TYPE go_memstats_heap_objects gauge
go_memstats_heap_objects 245757
# HELP go_memstats_heap_released_bytes Number of heap bytes released to OS.
# TYPE go_memstats_heap_released_bytes gauge
go_memstats_heap_released_bytes 2.699264e+07
# HELP go_memstats_heap_sys_bytes Number of heap bytes obtained from system.
# TYPE go_memstats_heap_sys_bytes gauge
go_memstats_heap_sys_bytes 6.4421888e+07
# HELP go_memstats_last_gc_time_seconds Number of seconds since 1970 of last garbage collection.
# TYPE go_memstats_last_gc_time_seconds gauge
go_memstats_last_gc_time_seconds 1.5671496945915468e+09
# HELP go_memstats_lookups_total Total number of pointer lookups.
# TYPE go_memstats_lookups_total counter
go_memstats_lookups_total 0
# HELP go_memstats_mallocs_total Total number of mallocs.
# TYPE go_memstats_mallocs_total counter
go_memstats_mallocs_total 3.84450068e+08
# HELP go_memstats_mcache_inuse_bytes Number of bytes in use by mcache structures.
# TYPE go_memstats_mcache_inuse_bytes gauge
go_memstats_mcache_inuse_bytes 6944
# HELP go_memstats_mcache_sys_bytes Number of bytes used for mcache structures obtained from system.
# TYPE go_memstats_mcache_sys_bytes gauge
go_memstats_mcache_sys_bytes 16384
# HELP go_memstats_mspan_inuse_bytes Number of bytes in use by mspan structures.
# TYPE go_memstats_mspan_inuse_bytes gauge
go_memstats_mspan_inuse_bytes 514656
# HELP go_memstats_mspan_sys_bytes Number of bytes used for mspan structures obtained from system.
# TYPE go_memstats_mspan_sys_bytes gauge
go_memstats_mspan_sys_bytes 638976
# HELP go_memstats_next_gc_bytes Number of heap bytes when next garbage collection will take place.
# TYPE go_memstats_next_gc_bytes gauge
go_memstats_next_gc_bytes 4.5308768e+07
# HELP go_memstats_other_sys_bytes Number of bytes used for other system allocations.
# TYPE go_memstats_other_sys_bytes gauge
go_memstats_other_sys_bytes 841120
# HELP go_memstats_stack_inuse_bytes Number of bytes in use by the stack allocator.
# TYPE go_memstats_stack_inuse_bytes gauge
go_memstats_stack_inuse_bytes 2.686976e+06
# HELP go_memstats_stack_sys_bytes Number of bytes obtained from system for stack allocator.
# TYPE go_memstats_stack_sys_bytes gauge
go_memstats_stack_sys_bytes 2.686976e+06
# HELP go_memstats_sys_bytes Number of bytes obtained from system.
# TYPE go_memstats_sys_bytes gauge
go_memstats_sys_bytes 7.3269496e+07
# HELP go_threads Number of OS threads created.
# TYPE go_threads gauge
go_threads 14
# HELP grpc_server_handled_total Total number of RPCs completed on the server, regardless of success or failure.
# TYPE grpc_server_handled_total counter
grpc_server_handled_total{grpc_code="OK",grpc_method="Get",grpc_service="io.linkerd.proxy.destination.Destination",grpc_type="server_stream"} 28044
grpc_server_handled_total{grpc_code="OK",grpc_method="GetProfile",grpc_service="io.linkerd.proxy.destination.Destination",grpc_type="server_stream"} 51777
# HELP grpc_server_handling_seconds Histogram of response latency (seconds) of gRPC that had been application-level handled by the server.
# TYPE grpc_server_handling_seconds histogram
grpc_server_handling_seconds_bucket{grpc_method="Get",grpc_service="io.linkerd.proxy.destination.Destination",grpc_type="server_stream",le="0.005"} 0
grpc_server_handling_seconds_bucket{grpc_method="Get",grpc_service="io.linkerd.proxy.destination.Destination",grpc_type="server_stream",le="0.01"} 0
grpc_server_handling_seconds_bucket{grpc_method="Get",grpc_service="io.linkerd.proxy.destination.Destination",grpc_type="server_stream",le="0.025"} 1
grpc_server_handling_seconds_bucket{grpc_method="Get",grpc_service="io.linkerd.proxy.destination.Destination",grpc_type="server_stream",le="0.05"} 2
grpc_server_handling_seconds_bucket{grpc_method="Get",grpc_service="io.linkerd.proxy.destination.Destination",grpc_type="server_stream",le="0.1"} 3
grpc_server_handling_seconds_bucket{grpc_method="Get",grpc_service="io.linkerd.proxy.destination.Destination",grpc_type="server_stream",le="0.25"} 5
grpc_server_handling_seconds_bucket{grpc_method="Get",grpc_service="io.linkerd.proxy.destination.Destination",grpc_type="server_stream",le="0.5"} 10
grpc_server_handling_seconds_bucket{grpc_method="Get",grpc_service="io.linkerd.proxy.destination.Destination",grpc_type="server_stream",le="1"} 17
grpc_server_handling_seconds_bucket{grpc_method="Get",grpc_service="io.linkerd.proxy.destination.Destination",grpc_type="server_stream",le="2.5"} 28
grpc_server_handling_seconds_bucket{grpc_method="Get",grpc_service="io.linkerd.proxy.destination.Destination",grpc_type="server_stream",le="5"} 53
grpc_server_handling_seconds_bucket{grpc_method="Get",grpc_service="io.linkerd.proxy.destination.Destination",grpc_type="server_stream",le="10"} 113
grpc_server_handling_seconds_bucket{grpc_method="Get",grpc_service="io.linkerd.proxy.destination.Destination",grpc_type="server_stream",le="+Inf"} 28044
grpc_server_handling_seconds_sum{grpc_method="Get",grpc_service="io.linkerd.proxy.destination.Destination",grpc_type="server_stream"} 2.24843088872508e+07
grpc_server_handling_seconds_count{grpc_method="Get",grpc_service="io.linkerd.proxy.destination.Destination",grpc_type="server_stream"} 28044
grpc_server_handling_seconds_bucket{grpc_method="GetProfile",grpc_service="io.linkerd.proxy.destination.Destination",grpc_type="server_stream",le="0.005"} 0
grpc_server_handling_seconds_bucket{grpc_method="GetProfile",grpc_service="io.linkerd.proxy.destination.Destination",grpc_type="server_stream",le="0.01"} 0
grpc_server_handling_seconds_bucket{grpc_method="GetProfile",grpc_service="io.linkerd.proxy.destination.Destination",grpc_type="server_stream",le="0.025"} 1
grpc_server_handling_seconds_bucket{grpc_method="GetProfile",grpc_service="io.linkerd.proxy.destination.Destination",grpc_type="server_stream",le="0.05"} 2
grpc_server_handling_seconds_bucket{grpc_method="GetProfile",grpc_service="io.linkerd.proxy.destination.Destination",grpc_type="server_stream",le="0.1"} 3
grpc_server_handling_seconds_bucket{grpc_method="GetProfile",grpc_service="io.linkerd.proxy.destination.Destination",grpc_type="server_stream",le="0.25"} 5
grpc_server_handling_seconds_bucket{grpc_method="GetProfile",grpc_service="io.linkerd.proxy.destination.Destination",grpc_type="server_stream",le="0.5"} 9
grpc_server_handling_seconds_bucket{grpc_method="GetProfile",grpc_service="io.linkerd.proxy.destination.Destination",grpc_type="server_stream",le="1"} 16
grpc_server_handling_seconds_bucket{grpc_method="GetProfile",grpc_service="io.linkerd.proxy.destination.Destination",grpc_type="server_stream",le="2.5"} 27
grpc_server_handling_seconds_bucket{grpc_method="GetProfile",grpc_service="io.linkerd.proxy.destination.Destination",grpc_type="server_stream",le="5"} 52
grpc_server_handling_seconds_bucket{grpc_method="GetProfile",grpc_service="io.linkerd.proxy.destination.Destination",grpc_type="server_stream",le="10"} 113
grpc_server_handling_seconds_bucket{grpc_method="GetProfile",grpc_service="io.linkerd.proxy.destination.Destination",grpc_type="server_stream",le="+Inf"} 51777
grpc_server_handling_seconds_sum{grpc_method="GetProfile",grpc_service="io.linkerd.proxy.destination.Destination",grpc_type="server_stream"} 2.8493616737835772e+07
grpc_server_handling_seconds_count{grpc_method="GetProfile",grpc_service="io.linkerd.proxy.destination.Destination",grpc_type="server_stream"} 51777
# HELP grpc_server_msg_received_total Total number of RPC stream messages received on the server.
# TYPE grpc_server_msg_received_total counter
grpc_server_msg_received_total{grpc_method="Get",grpc_service="io.linkerd.proxy.destination.Destination",grpc_type="server_stream"} 28100
grpc_server_msg_received_total{grpc_method="GetProfile",grpc_service="io.linkerd.proxy.destination.Destination",grpc_type="server_stream"} 51842
# HELP grpc_server_msg_sent_total Total number of gRPC stream messages sent by the server.
# TYPE grpc_server_msg_sent_total counter
grpc_server_msg_sent_total{grpc_method="Get",grpc_service="io.linkerd.proxy.destination.Destination",grpc_type="server_stream"} 28688
grpc_server_msg_sent_total{grpc_method="GetProfile",grpc_service="io.linkerd.proxy.destination.Destination",grpc_type="server_stream"} 111091
# HELP grpc_server_started_total Total number of RPCs started on the server.
# TYPE grpc_server_started_total counter
grpc_server_started_total{grpc_method="Get",grpc_service="io.linkerd.proxy.destination.Destination",grpc_type="server_stream"} 28100
grpc_server_started_total{grpc_method="GetProfile",grpc_service="io.linkerd.proxy.destination.Destination",grpc_type="server_stream"} 51842
# HELP http_client_in_flight_requests A gauge of in-flight requests for the wrapped client.
# TYPE http_client_in_flight_requests gauge
http_client_in_flight_requests{client="k8s"} 0
http_client_in_flight_requests{client="sp"} 0
http_client_in_flight_requests{client="ts"} 0
# HELP http_client_request_latency_seconds A histogram of request latencies.
# TYPE http_client_request_latency_seconds histogram
http_client_request_latency_seconds_bucket{client="k8s",code="200",method="get",le="0.01"} 6341
http_client_request_latency_seconds_bucket{client="k8s",code="200",method="get",le="0.02"} 6445
http_client_request_latency_seconds_bucket{client="k8s",code="200",method="get",le="0.03"} 6469
http_client_request_latency_seconds_bucket{client="k8s",code="200",method="get",le="0.04"} 6476
http_client_request_latency_seconds_bucket{client="k8s",code="200",method="get",le="0.05"} 6485
http_client_request_latency_seconds_bucket{client="k8s",code="200",method="get",le="0.1"} 6486
http_client_request_latency_seconds_bucket{client="k8s",code="200",method="get",le="0.2"} 6486
http_client_request_latency_seconds_bucket{client="k8s",code="200",method="get",le="0.30000000000000004"} 6486
http_client_request_latency_seconds_bucket{client="k8s",code="200",method="get",le="0.4"} 6486
http_client_request_latency_seconds_bucket{client="k8s",code="200",method="get",le="0.5"} 6486
http_client_request_latency_seconds_bucket{client="k8s",code="200",method="get",le="1"} 6486
http_client_request_latency_seconds_bucket{client="k8s",code="200",method="get",le="2"} 6486
http_client_request_latency_seconds_bucket{client="k8s",code="200",method="get",le="3"} 6486
http_client_request_latency_seconds_bucket{client="k8s",code="200",method="get",le="4"} 6486
http_client_request_latency_seconds_bucket{client="k8s",code="200",method="get",le="5"} 6486
http_client_request_latency_seconds_bucket{client="k8s",code="200",method="get",le="10"} 6486
http_client_request_latency_seconds_bucket{client="k8s",code="200",method="get",le="20"} 6486
http_client_request_latency_seconds_bucket{client="k8s",code="200",method="get",le="30"} 6486
http_client_request_latency_seconds_bucket{client="k8s",code="200",method="get",le="40"} 6486
http_client_request_latency_seconds_bucket{client="k8s",code="200",method="get",le="50"} 6486
http_client_request_latency_seconds_bucket{client="k8s",code="200",method="get",le="+Inf"} 6486
http_client_request_latency_seconds_sum{client="k8s",code="200",method="get"} 29.897404542999997
http_client_request_latency_seconds_count{client="k8s",code="200",method="get"} 6486
http_client_request_latency_seconds_bucket{client="k8s",code="201",method="post",le="0.01"} 2
http_client_request_latency_seconds_bucket{client="k8s",code="201",method="post",le="0.02"} 2
http_client_request_latency_seconds_bucket{client="k8s",code="201",method="post",le="0.03"} 2
http_client_request_latency_seconds_bucket{client="k8s",code="201",method="post",le="0.04"} 2
http_client_request_latency_seconds_bucket{client="k8s",code="201",method="post",le="0.05"} 2
http_client_request_latency_seconds_bucket{client="k8s",code="201",method="post",le="0.1"} 2
http_client_request_latency_seconds_bucket{client="k8s",code="201",method="post",le="0.2"} 2
http_client_request_latency_seconds_bucket{client="k8s",code="201",method="post",le="0.30000000000000004"} 2
http_client_request_latency_seconds_bucket{client="k8s",code="201",method="post",le="0.4"} 2
http_client_request_latency_seconds_bucket{client="k8s",code="201",method="post",le="0.5"} 2
http_client_request_latency_seconds_bucket{client="k8s",code="201",method="post",le="1"} 2
http_client_request_latency_seconds_bucket{client="k8s",code="201",method="post",le="2"} 2
http_client_request_latency_seconds_bucket{client="k8s",code="201",method="post",le="3"} 2
http_client_request_latency_seconds_bucket{client="k8s",code="201",method="post",le="4"} 2
http_client_request_latency_seconds_bucket{client="k8s",code="201",method="post",le="5"} 2
http_client_request_latency_seconds_bucket{client="k8s",code="201",method="post",le="10"} 2
http_client_request_latency_seconds_bucket{client="k8s",code="201",method="post",le="20"} 2
http_client_request_latency_seconds_bucket{client="k8s",code="201",method="post",le="30"} 2
http_client_request_latency_seconds_bucket{client="k8s",code="201",method="post",le="40"} 2
http_client_request_latency_seconds_bucket{client="k8s",code="201",method="post",le="50"} 2
http_client_request_latency_seconds_bucket{client="k8s",code="201",method="post",le="+Inf"} 2
http_client_request_latency_seconds_sum{client="k8s",code="201",method="post"} 0.007943179
http_client_request_latency_seconds_count{client="k8s",code="201",method="post"} 2
http_client_request_latency_seconds_bucket{client="sp",code="200",method="get",le="0.01"} 1574
http_client_request_latency_seconds_bucket{client="sp",code="200",method="get",le="0.02"} 1602
http_client_request_latency_seconds_bucket{client="sp",code="200",method="get",le="0.03"} 1607
http_client_request_latency_seconds_bucket{client="sp",code="200",method="get",le="0.04"} 1611
http_client_request_latency_seconds_bucket{client="sp",code="200",method="get",le="0.05"} 1611
http_client_request_latency_seconds_bucket{client="sp",code="200",method="get",le="0.1"} 1614
http_client_request_latency_seconds_bucket{client="sp",code="200",method="get",le="0.2"} 1614
http_client_request_latency_seconds_bucket{client="sp",code="200",method="get",le="0.30000000000000004"} 1614
http_client_request_latency_seconds_bucket{client="sp",code="200",method="get",le="0.4"} 1614
http_client_request_latency_seconds_bucket{client="sp",code="200",method="get",le="0.5"} 1614
http_client_request_latency_seconds_bucket{client="sp",code="200",method="get",le="1"} 1614
http_client_request_latency_seconds_bucket{client="sp",code="200",method="get",le="2"} 1614
http_client_request_latency_seconds_bucket{client="sp",code="200",method="get",le="3"} 1614
http_client_request_latency_seconds_bucket{client="sp",code="200",method="get",le="4"} 1614
http_client_request_latency_seconds_bucket{client="sp",code="200",method="get",le="5"} 1614
http_client_request_latency_seconds_bucket{client="sp",code="200",method="get",le="10"} 1614
http_client_request_latency_seconds_bucket{client="sp",code="200",method="get",le="20"} 1614
http_client_request_latency_seconds_bucket{client="sp",code="200",method="get",le="30"} 1614
http_client_request_latency_seconds_bucket{client="sp",code="200",method="get",le="40"} 1614
http_client_request_latency_seconds_bucket{client="sp",code="200",method="get",le="50"} 1614
http_client_request_latency_seconds_bucket{client="sp",code="200",method="get",le="+Inf"} 1614
http_client_request_latency_seconds_sum{client="sp",code="200",method="get"} 7.536066579999996
http_client_request_latency_seconds_count{client="sp",code="200",method="get"} 1614
http_client_request_latency_seconds_bucket{client="ts",code="200",method="get",le="0.01"} 1579
http_client_request_latency_seconds_bucket{client="ts",code="200",method="get",le="0.02"} 1610
http_client_request_latency_seconds_bucket{client="ts",code="200",method="get",le="0.03"} 1620
http_client_request_latency_seconds_bucket{client="ts",code="200",method="get",le="0.04"} 1625
http_client_request_latency_seconds_bucket{client="ts",code="200",method="get",le="0.05"} 1625
http_client_request_latency_seconds_bucket{client="ts",code="200",method="get",le="0.1"} 1625
http_client_request_latency_seconds_bucket{client="ts",code="200",method="get",le="0.2"} 1625
http_client_request_latency_seconds_bucket{client="ts",code="200",method="get",le="0.30000000000000004"} 1625
http_client_request_latency_seconds_bucket{client="ts",code="200",method="get",le="0.4"} 1625
http_client_request_latency_seconds_bucket{client="ts",code="200",method="get",le="0.5"} 1625
http_client_request_latency_seconds_bucket{client="ts",code="200",method="get",le="1"} 1625
http_client_request_latency_seconds_bucket{client="ts",code="200",method="get",le="2"} 1625
http_client_request_latency_seconds_bucket{client="ts",code="200",method="get",le="3"} 1625
http_client_request_latency_seconds_bucket{client="ts",code="200",method="get",le="4"} 1625
http_client_request_latency_seconds_bucket{client="ts",code="200",method="get",le="5"} 1625
http_client_request_latency_seconds_bucket{client="ts",code="200",method="get",le="10"} 1625
http_client_request_latency_seconds_bucket{client="ts",code="200",method="get",le="20"} 1625
http_client_request_latency_seconds_bucket{client="ts",code="200",method="get",le="30"} 1625
http_client_request_latency_seconds_bucket{client="ts",code="200",method="get",le="40"} 1625
http_client_request_latency_seconds_bucket{client="ts",code="200",method="get",le="50"} 1625
http_client_request_latency_seconds_bucket{client="ts",code="200",method="get",le="+Inf"} 1625
http_client_request_latency_seconds_sum{client="ts",code="200",method="get"} 7.616266757999999
http_client_request_latency_seconds_count{client="ts",code="200",method="get"} 1625
# HELP http_client_requests_total A counter for requests from the wrapped client.
# TYPE http_client_requests_total counter
http_client_requests_total{client="k8s",code="200",method="get"} 6486
http_client_requests_total{client="k8s",code="201",method="post"} 2
http_client_requests_total{client="sp",code="200",method="get"} 1614
http_client_requests_total{client="ts",code="200",method="get"} 1625
# HELP process_cpu_seconds_total Total user and system CPU time spent in seconds.
# TYPE process_cpu_seconds_total counter
process_cpu_seconds_total 942.92
# HELP process_max_fds Maximum number of open file descriptors.
# TYPE process_max_fds gauge
process_max_fds 1.048576e+06
# HELP process_open_fds Number of open file descriptors.
# TYPE process_open_fds gauge
process_open_fds 45
# HELP process_resident_memory_bytes Resident memory size in bytes.
# TYPE process_resident_memory_bytes gauge
process_resident_memory_bytes 5.0835456e+07
# HELP process_start_time_seconds Start time of the process since unix epoch in seconds.
# TYPE process_start_time_seconds gauge
process_start_time_seconds 1.56642320113e+09
# HELP process_virtual_memory_bytes Virtual memory size in bytes.
# TYPE process_virtual_memory_bytes gauge
process_virtual_memory_bytes 1.41385728e+08
# HELP process_virtual_memory_max_bytes Maximum amount of virtual memory available in bytes.
# TYPE process_virtual_memory_max_bytes gauge
process_virtual_memory_max_bytes -1
# HELP profile_subscribers A gauge for the current number of subscribers to a profile.
# TYPE profile_subscribers gauge
profile_subscribers{namespace="default",profile="h-agent-status-api.default.svc.cluster.local"} 2
profile_subscribers{namespace="default",profile="h-auth.default.svc.cluster.local"} 18
profile_subscribers{namespace="default",profile="h-csv-importer.default.svc.cluster.local"} 0
profile_subscribers{namespace="default",profile="h-events-api.default.svc.cluster.local"} 4
profile_subscribers{namespace="default",profile="h-forecast-model-selector.default.svc.cluster.local"} 6
profile_subscribers{namespace="default",profile="h-forecast.default.svc.cluster.local"} 4
profile_subscribers{namespace="default",profile="h-integrations-configuration.default.svc.cluster.local"} 14
profile_subscribers{namespace="default",profile="h-iwfm-api.default.svc.cluster.local"} 4
profile_subscribers{namespace="default",profile="h-iwfm-hosts.default.svc.cluster.local"} 6
profile_subscribers{namespace="default",profile="h-onboarding-api.default.svc.cluster.local"} 2
profile_subscribers{namespace="default",profile="h-public-holidays-api.default.svc.cluster.local"} 4
profile_subscribers{namespace="default",profile="h-queue-elements.default.svc.cluster.local"} 6
profile_subscribers{namespace="default",profile="h-queue-metadata.default.svc.cluster.local"} 6
profile_subscribers{namespace="default",profile="h-queue-store-api.default.svc.cluster.local"} 22
profile_subscribers{namespace="default",profile="h-staff-requirements.default.svc.cluster.local"} 2
profile_subscribers{namespace="default",profile="h-workload-holidayregion-mapper.default.svc.cluster.local"} 4
profile_subscribers{namespace="default",profile="h-workload-mode-tracker.default.svc.cluster.local"} 2
profile_subscribers{namespace="default",profile="h-workloads-api.default.svc.cluster.local"} 16
profile_subscribers{namespace="linkerd",profile="linkerd-controller-api.linkerd.svc.cluster.local"} 2
profile_subscribers{namespace="linkerd",profile="linkerd-destination.linkerd.svc.cluster.local"} 2
profile_subscribers{namespace="linkerd",profile="linkerd-identity.linkerd.svc.cluster.local"} 4
profile_subscribers{namespace="linkerd",profile="linkerd-prometheus.linkerd.svc.cluster.local"} 0
# HELP profile_updates A counter for number of updates to a profile.
# TYPE profile_updates counter
profile_updates{namespace="default",profile="h-agent-status-api.default.svc.cluster.local"} 0
profile_updates{namespace="default",profile="h-auth.default.svc.cluster.local"} 1211
profile_updates{namespace="default",profile="h-csv-importer.default.svc.cluster.local"} 0
profile_updates{namespace="default",profile="h-events-api.default.svc.cluster.local"} 0
profile_updates{namespace="default",profile="h-forecast-model-selector.default.svc.cluster.local"} 0
profile_updates{namespace="default",profile="h-forecast.default.svc.cluster.local"} 0
profile_updates{namespace="default",profile="h-integrations-configuration.default.svc.cluster.local"} 0
profile_updates{namespace="default",profile="h-iwfm-api.default.svc.cluster.local"} 0
profile_updates{namespace="default",profile="h-iwfm-hosts.default.svc.cluster.local"} 0
profile_updates{namespace="default",profile="h-onboarding-api.default.svc.cluster.local"} 0
profile_updates{namespace="default",profile="h-public-holidays-api.default.svc.cluster.local"} 0
profile_updates{namespace="default",profile="h-queue-elements.default.svc.cluster.local"} 0
profile_updates{namespace="default",profile="h-queue-metadata.default.svc.cluster.local"} 0
profile_updates{namespace="default",profile="h-queue-store-api.default.svc.cluster.local"} 0
profile_updates{namespace="default",profile="h-staff-requirements.default.svc.cluster.local"} 0
profile_updates{namespace="default",profile="h-workload-holidayregion-mapper.default.svc.cluster.local"} 0
profile_updates{namespace="default",profile="h-workload-mode-tracker.default.svc.cluster.local"} 0
profile_updates{namespace="default",profile="h-workloads-api.default.svc.cluster.local"} 0
profile_updates{namespace="linkerd",profile="linkerd-controller-api.linkerd.svc.cluster.local"} 0
profile_updates{namespace="linkerd",profile="linkerd-destination.linkerd.svc.cluster.local"} 0
profile_updates{namespace="linkerd",profile="linkerd-identity.linkerd.svc.cluster.local"} 0
profile_updates{namespace="linkerd",profile="linkerd-prometheus.linkerd.svc.cluster.local"} 0
# HELP promhttp_metric_handler_requests_in_flight Current number of scrapes being served.
# TYPE promhttp_metric_handler_requests_in_flight gauge
promhttp_metric_handler_requests_in_flight 1
# HELP promhttp_metric_handler_requests_total Total number of scrapes by HTTP status code.
# TYPE promhttp_metric_handler_requests_total counter
promhttp_metric_handler_requests_total{code="200"} 72598
promhttp_metric_handler_requests_total{code="500"} 0
promhttp_metric_handler_requests_total{code="503"} 0
# HELP trafficsplit_subscribers A gauge for the current number of subscribers to a trafficsplit.
# TYPE trafficsplit_subscribers gauge
trafficsplit_subscribers{namespace="default",service="h-agent-status-api"} 1
trafficsplit_subscribers{namespace="default",service="h-auth"} 9
trafficsplit_subscribers{namespace="default",service="h-csv-importer"} 0
trafficsplit_subscribers{namespace="default",service="h-events-api"} 2
trafficsplit_subscribers{namespace="default",service="h-forecast"} 2
trafficsplit_subscribers{namespace="default",service="h-forecast-model-selector"} 3
trafficsplit_subscribers{namespace="default",service="h-integrations-configuration"} 7
trafficsplit_subscribers{namespace="default",service="h-iwfm-api"} 2
trafficsplit_subscribers{namespace="default",service="h-iwfm-hosts"} 3
trafficsplit_subscribers{namespace="default",service="h-onboarding-api"} 1
trafficsplit_subscribers{namespace="default",service="h-public-holidays-api"} 2
trafficsplit_subscribers{namespace="default",service="h-queue-elements"} 3
trafficsplit_subscribers{namespace="default",service="h-queue-metadata"} 3
trafficsplit_subscribers{namespace="default",service="h-queue-store-api"} 11
trafficsplit_subscribers{namespace="default",service="h-staff-requirements"} 1
trafficsplit_subscribers{namespace="default",service="h-workload-holidayregion-mapper"} 2
trafficsplit_subscribers{namespace="default",service="h-workload-mode-tracker"} 1
trafficsplit_subscribers{namespace="default",service="h-workloads-api"} 8
trafficsplit_subscribers{namespace="linkerd",service="linkerd-controller-api"} 1
trafficsplit_subscribers{namespace="linkerd",service="linkerd-destination"} 1
trafficsplit_subscribers{namespace="linkerd",service="linkerd-identity"} 2
trafficsplit_subscribers{namespace="linkerd",service="linkerd-prometheus"} 0
# HELP trafficsplit_updates A counter for number of updates to a trafficsplit.
# TYPE trafficsplit_updates counter
trafficsplit_updates{namespace="default",service="h-agent-status-api"} 0
trafficsplit_updates{namespace="default",service="h-auth"} 0
trafficsplit_updates{namespace="default",service="h-csv-importer"} 0
trafficsplit_updates{namespace="default",service="h-events-api"} 0
trafficsplit_updates{namespace="default",service="h-forecast"} 0
trafficsplit_updates{namespace="default",service="h-forecast-model-selector"} 0
trafficsplit_updates{namespace="default",service="h-integrations-configuration"} 0
trafficsplit_updates{namespace="default",service="h-iwfm-api"} 0
trafficsplit_updates{namespace="default",service="h-iwfm-hosts"} 0
trafficsplit_updates{namespace="default",service="h-onboarding-api"} 0
trafficsplit_updates{namespace="default",service="h-public-holidays-api"} 0
trafficsplit_updates{namespace="default",service="h-queue-elements"} 0
trafficsplit_updates{namespace="default",service="h-queue-metadata"} 0
trafficsplit_updates{namespace="default",service="h-queue-store-api"} 0
trafficsplit_updates{namespace="default",service="h-staff-requirements"} 0
trafficsplit_updates{namespace="default",service="h-workload-holidayregion-mapper"} 0
trafficsplit_updates{namespace="default",service="h-workload-mode-tracker"} 0
trafficsplit_updates{namespace="default",service="h-workloads-api"} 0
trafficsplit_updates{namespace="linkerd",service="linkerd-controller-api"} 0
trafficsplit_updates{namespace="linkerd",service="linkerd-destination"} 0
trafficsplit_updates{namespace="linkerd",service="linkerd-identity"} 0
trafficsplit_updates{namespace="linkerd",service="linkerd-prometheus"} 0
We have around 100 deployments in that environment. All but 4 deployments are pretty stable in terms of scaling. There are 4 deployments that use the HPA to scale from 1 to 50 pods based on CPU load.
kforsthoevel
on 30 Aug 2019
@kforsthoevel thanks for this information. Was the high memory scenario occurring when you requested this output?
Do you have any more information about events that occurred at the time of the spike in the graph? Perhaps heavier load or a deployment? Anything abnormal that we can correlate that with that event is helpful.
cpretzer
on 30 Aug 2019
No, I just requested the output this morning as soon as I read your message, sorry. Unfortunately, I can't correlate it to any specific event.
kforsthoevel
on 30 Aug 2019
@kforsthoevel no problem! Keep an eye on it and please do collect the event info and admin metrics data if it happens again.
The current metrics information that you pasted above looks healthy. Let's also keep an eye on the amount of scaling that is happening for those four services that you mentioned 👀
cpretzer
on 30 Aug 2019
This issue has been automatically marked as stale because it has not had recent activity. It will be closed in 14 days if no further activity occurs. Thank you for your contributions.
![stale[bot] picture](https://avatars3.githubusercontent.com/in/1724?v=4&s=40) stale[bot]
on 28 Nov 2019
stale[bot]
on 28 Nov 2019
@kforsthoevel stalebot is doing its job and trying to close this issue. Have you seen this behavior recently?
My attempts to reproduce the high memory conditions have not been successful so far. It would be great to understand what events occurred just before the spike in memory
cpretzer
on 28 Nov 2019
@cpretzer So far everything looks go. Since stable-2.6.0 things are running pretty stable.
kforsthoevel
on 2 Dec 2019
@kforsthoevel that's good news, thanks for the quick reply.
I'm going to close this issue for now. If you see the behavior again, feel free to reopen it.
cpretzer
on 2 Dec 2019
Related issues
 coleca
·
4Comments
coleca
·
4Comments
 ihcsim
·
4Comments
ihcsim
·
4Comments
 skalinets
·
3Comments
ihcsim
·
4Comments
skalinets
·
3Comments
ihcsim
·
4Comments
 vikas027
·
4Comments
vikas027
·
4Comments