Linkerd2: "Getting Started" Demo not working
Hello,
I've been working through the steps available at: https://conduit.io/getting-started/
My environment is on Docker for Mac with Kubernetes. Versions are as follows.
macOS: v10.13.3
Engine: 18.05.0-ce-rc1
Kubernetes: v1.9.6
There are a few things I'm seeing as not working. First is that the dashboard is showing none of the deployments being in the service mesh.
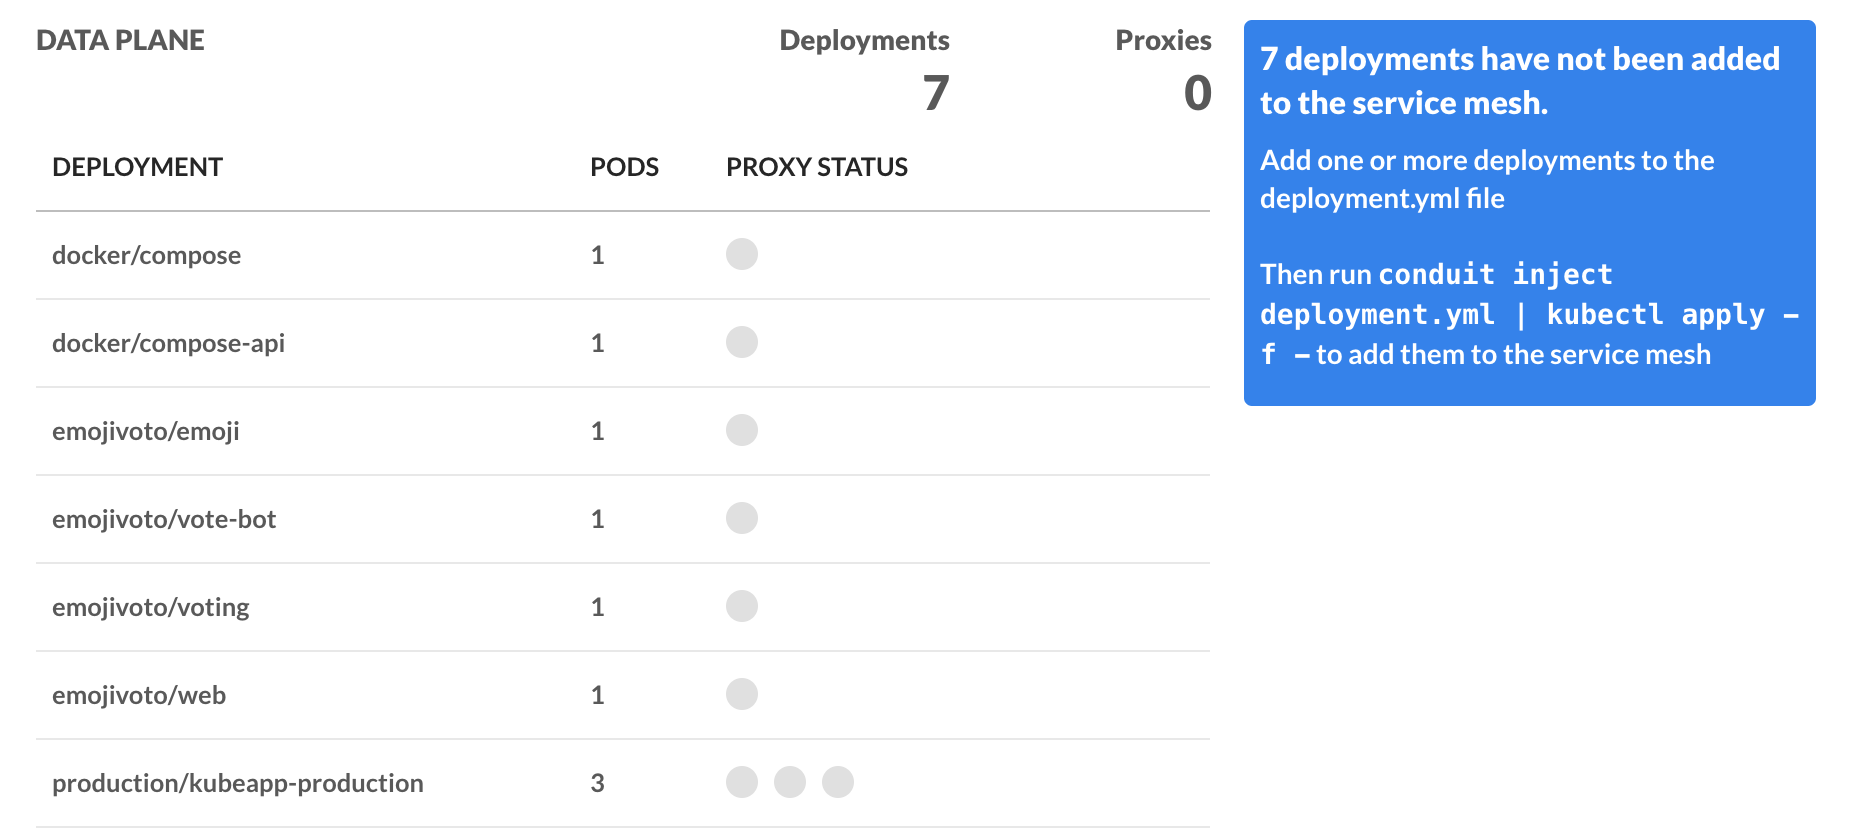
This is interesting since part of the Getting Started doc has the _emojivoto_ app installed with conduit inject.
The second portion is that the Deployments, Replication Controllers, and Pods tabs all don't load with the following message: Error getting data from server: Failed to fetch. Which I also envision is a similar reason why loading up the grafana dashboard also shows no data.
Here are logs per the output of kubectl -n emojivoto exec web-56b96dc8c6-2cmz5 --container web-svc curl localhost:4191/metrics: https://gist.github.com/streetmapp/3f97fb7b21ea6ccf61d6c8f9747ad01b
This was through some of the troubleshooting that was done over in the Conduit Slack.
 streetmapp
All 13 comments
Hmmm, interesting. Looks like there are metrics, but the api is returning an error. A couple questions:
- Does
conduit stat deployreturn stats? - Could you paste the logs of the controller pod running in the conduit namespace?
(e.g.kubectl logs <your controller pod name> -n conduit public-api)
 rmars
on 3 May 2018
rmars
on 3 May 2018
Nothing returns running conduit stat deploy.
Here is the output of the kubectl logs
kubectl logs controller-5b576d647b-hmd8j -n conduit public-api ✔ 2133 10:05:58
time="2018-05-02T18:15:38Z" level=info msg="running conduit version v0.4.1"
time="2018-05-02T18:15:38Z" level=info msg="serving scrapable metrics on :9995"
time="2018-05-02T18:15:38Z" level=info msg="starting HTTP server on :8085"
time="2018-05-02T18:15:38Z" level=info msg="waiting for caches to sync"
E0502 18:15:38.885594 1 reflector.go:205] k8s.io/client-go/informers/factory.go:86: Failed to list *v1.Namespace: Get https://10.96.0.1:443/api/v1/namespaces?limit=500&resourceVersion=0: dial tcp 10.96.0.1:443: connect: connection refused
E0502 18:15:38.886093 1 reflector.go:205] k8s.io/client-go/informers/factory.go:86: Failed to list *v1beta2.ReplicaSet: Get https://10.96.0.1:443/apis/apps/v1beta2/replicasets?limit=500&resourceVersion=0: dial tcp 10.96.0.1:443: connect: connection refused
E0502 18:15:38.887512 1 reflector.go:205] k8s.io/client-go/informers/factory.go:86: Failed to list *v1.Service: Get https://10.96.0.1:443/api/v1/services?limit=500&resourceVersion=0: dial tcp 10.96.0.1:443: connect: connection refused
E0502 18:15:38.887861 1 reflector.go:205] k8s.io/client-go/informers/factory.go:86: Failed to list *v1beta2.Deployment: Get https://10.96.0.1:443/apis/apps/v1beta2/deployments?limit=500&resourceVersion=0: dial tcp 10.96.0.1:443: connect: connection refused
E0502 18:15:38.888443 1 reflector.go:205] k8s.io/client-go/informers/factory.go:86: Failed to list *v1.Pod: Get https://10.96.0.1:443/api/v1/pods?limit=500&resourceVersion=0: dial tcp 10.96.0.1:443: connect: connection refused
E0502 18:15:38.889407 1 reflector.go:205] k8s.io/client-go/informers/factory.go:86: Failed to list *v1.ReplicationController: Get https://10.96.0.1:443/api/v1/replicationcontrollers?limit=500&resourceVersion=0: dial tcp 10.96.0.1:443: connect: connection refused
E0502 18:15:39.886959 1 reflector.go:205] k8s.io/client-go/informers/factory.go:86: Failed to list *v1.Namespace: Get https://10.96.0.1:443/api/v1/namespaces?limit=500&resourceVersion=0: dial tcp 10.96.0.1:443: connect: connection refused
E0502 18:15:39.888422 1 reflector.go:205] k8s.io/client-go/informers/factory.go:86: Failed to list *v1beta2.ReplicaSet: Get https://10.96.0.1:443/apis/apps/v1beta2/replicasets?limit=500&resourceVersion=0: dial tcp 10.96.0.1:443: connect: connection refused
E0502 18:15:39.892776 1 reflector.go:205] k8s.io/client-go/informers/factory.go:86: Failed to list *v1.Service: Get https://10.96.0.1:443/api/v1/services?limit=500&resourceVersion=0: dial tcp 10.96.0.1:443: connect: connection refused
E0502 18:15:39.894402 1 reflector.go:205] k8s.io/client-go/informers/factory.go:86: Failed to list *v1beta2.Deployment: Get https://10.96.0.1:443/apis/apps/v1beta2/deployments?limit=500&resourceVersion=0: dial tcp 10.96.0.1:443: connect: connection refused
E0502 18:15:39.895171 1 reflector.go:205] k8s.io/client-go/informers/factory.go:86: Failed to list *v1.Pod: Get https://10.96.0.1:443/api/v1/pods?limit=500&resourceVersion=0: dial tcp 10.96.0.1:443: connect: connection refused
E0502 18:15:39.896819 1 reflector.go:205] k8s.io/client-go/informers/factory.go:86: Failed to list *v1.ReplicationController: Get https://10.96.0.1:443/api/v1/replicationcontrollers?limit=500&resourceVersion=0: dial tcp 10.96.0.1:443: connect: connection refused
time="2018-05-02T18:15:40Z" level=info msg="caches synced"
Here has the same errors:
Kubernetes version:
> kubectl version --short
Client Version: v1.10.2
Server Version: v1.8.8
Conduit version
> conduit version
Client version: v0.4.1
Server version: v0.4.1
 dyxushuai
on 15 May 2018
dyxushuai
on 15 May 2018
Running into the same issue. First tried it on a newly spun up 1.9.7 cluster, provisioned by Kops with RBAC enabled. Can't get past the Service Mesh tab in the dashboard, the controller spits out a lot of connection refused logs as others have shared.
Tried again on a local docker-for-mac kubernetes cluster, running 1.9.6 and exactly the same result. I already tore down my kops cluster, but this is what the API pod of my local docker cluster looks like:
$ kubectl -n kube-system describe po (kubectl -n kube-system get po --selector=component=kube-apiserver -o jsonpath='{.items[*].metadata.name}')
Name:         kube-apiserver-docker-for-desktop
Namespace:    kube-system
Node:         docker-for-desktop/192.168.65.3
Start Time:   Wed, 16 May 2018 11:04:42 +0200
Labels:       component=kube-apiserver
              tier=control-plane
Annotations:  kubernetes.io/config.hash=43487545adf796a234cc85be274221bb
              kubernetes.io/config.mirror=43487545adf796a234cc85be274221bb
              kubernetes.io/config.seen=2018-05-16T09:04:42.305850939Z
              kubernetes.io/config.source=file
              scheduler.alpha.kubernetes.io/critical-pod=
Status:       Running
IP:           192.168.65.3
Containers:
  kube-apiserver:
    Container ID:  docker://8f98b60a70f8ad48be505cdce02015b432cfa3d6e7078dd890da7f44d68cd995
    Image:         gcr.io/google_containers/kube-apiserver-amd64:v1.9.6
    Image ID:      docker-pullable://gcr.io/google_containers/kube-apiserver-amd64@sha256:1bb16ddef9edd8142125ac2443e36986c051b0df808db907648ac9d68e0d5f23
    Port:          <none>
    Command:
      kube-apiserver
      --admission-control=Initializers,NamespaceLifecycle,LimitRanger,ServiceAccount,DefaultStorageClass,DefaultTolerationSeconds,NodeRestriction,MutatingAdmissionWebhook,ValidatingAdmissionWebhook,ResourceQuota
      --requestheader-username-headers=X-Remote-User
      --requestheader-group-headers=X-Remote-Group
      --advertise-address=192.168.65.3
      --requestheader-client-ca-file=/run/config/pki/front-proxy-ca.crt
      --insecure-port=0
      --allow-privileged=true
      --kubelet-preferred-address-types=InternalIP,ExternalIP,Hostname
      --requestheader-allowed-names=front-proxy-client
      --secure-port=6443
      --enable-bootstrap-token-auth=true
      --tls-private-key-file=/run/config/pki/apiserver.key
      --kubelet-client-certificate=/run/config/pki/apiserver-kubelet-client.crt
      --kubelet-client-key=/run/config/pki/apiserver-kubelet-client.key
      --proxy-client-cert-file=/run/config/pki/front-proxy-client.crt
      --proxy-client-key-file=/run/config/pki/front-proxy-client.key
      --requestheader-extra-headers-prefix=X-Remote-Extra-
      --service-cluster-ip-range=10.96.0.0/12
      --service-account-key-file=/run/config/pki/sa.pub
      --client-ca-file=/run/config/pki/ca.crt
      --tls-cert-file=/run/config/pki/apiserver.crt
      --authorization-mode=Node,RBAC
      --etcd-servers=http://127.0.0.1:2379
    State:          Running
      Started:      Wed, 16 May 2018 11:04:59 +0200
    Ready:          True
    Restart Count:  0
    Requests:
      cpu:        250m
    Liveness:     http-get https://192.168.65.3:6443/healthz delay=15s timeout=15s period=10s #success=1 #failure=8
    Environment:  <none>
    Mounts:
      /etc/ssl/certs from ca-certs (ro)
      /run/config/pki from k8s-certs (ro)
Conditions:
  Type           Status
  Initialized    True
  Ready          True
  PodScheduled   True
Volumes:
  k8s-certs:
    Type:          HostPath (bare host directory volume)
    Path:          /run/config/pki
    HostPathType:  DirectoryOrCreate
  ca-certs:
    Type:          HostPath (bare host directory volume)
    Path:          /etc/ssl/certs
    HostPathType:  DirectoryOrCreate
QoS Class:         Burstable
Node-Selectors:    <none>
Tolerations:       :NoExecute
Events:            <none>
~ $ kubectl get services
NAME         TYPE        CLUSTER-IP   EXTERNAL-IP   PORT(S)   AGE
kubernetes   ClusterIP   10.96.0.1    <none>        443/TCP   11m
EDIT: I just tried it on a third cluster, this one with Authorization mode AlwaysAllow, and even here it does not work.
 bcorijn
on 16 May 2018
bcorijn
on 16 May 2018
:+1:
 subicura
on 16 May 2018
subicura
on 16 May 2018
Hmm, I'm unfortunately not able to reproduce this issue on a 1.9 cluster with RBAC enabled (minikube).
$ kubectl version --short
Client Version: v1.8.6
Server Version: v1.9.4

$ conduit version
Client version: v0.4.1
Server version: v0.4.1
For folks who are able to reproduce, do your clusters have any network plugins installed, such as CNI, that would prevent the prometheus pod running in the "conduit" namespace from scraping proxies in injected pods in the "emojivoto" namespace? Also, what's the output of conduit check --verbose?
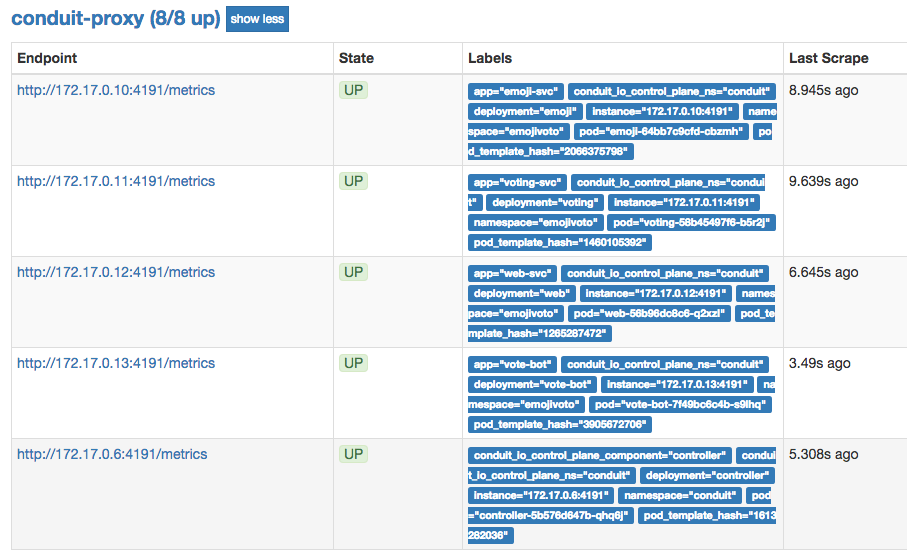
It would also be good to check prometheus directly, to see which targets it is successfully scraping. The easiest way to do this is to port-forward to the prometheus pod. Something like:
kubectl -n conduit port-forward `kubectl -n conduit get po | grep prometheus | cut -d ' ' -f1` 9090
And then load http://localhost:9090/targets in your browser. All of the "conduit-proxy" targets should be UP / green, e.g.:
 klingerf
on 17 May 2018
klingerf
on 17 May 2018
@klingerf I guess there's a bit two different scenarios in play here?
I will share debug info from my local docker-for-mac kubernetes as that is the easiest and most reproducable. So what I am running and seeing:
~ $ docker version
Client:
 Version:      18.05.0-ce-rc1
 API version:  1.37
 Go version:   go1.9.5
 Git commit:   33f00ce
 Built:        Thu Apr 26 00:58:56 2018
 OS/Arch:      darwin/amd64
 Experimental: true
 Orchestrator: kubernetes

Server:
 Engine:
  Version:      18.05.0-ce-rc1
  API version:  1.37 (minimum version 1.12)
  Go version:   go1.10.1
  Git commit:   33f00ce
  Built:        Thu Apr 26 01:06:49 2018
  OS/Arch:      linux/amd64
  Experimental: true
 Kubernetes:
  Version:     v1.9.6
  StackAPI:                   v1beta1
~ $ kubectl version
Client Version: version.Info{Major:"1", Minor:"9", GitVersion:"v1.9.6", GitCommit:"9f8ebd171479bec0ada837d7ee641dec2f8c6dd1", GitTreeState:"clean", BuildDate:"2018-03-21T15:21:50Z", GoVersion:"go1.9.3", Compiler:"gc", Platform:"darwin/amd64"}
Server Version: version.Info{Major:"1", Minor:"9", GitVersion:"v1.9.6", GitCommit:"9f8ebd171479bec0ada837d7ee641dec2f8c6dd1", GitTreeState:"clean", BuildDate:"2018-03-21T15:13:31Z", GoVersion:"go1.9.3", Compiler:"gc", Platform:"linux/amd64"}
~ $ conduit version
Client version: v0.4.1
Server version: v0.4.1
The kubectl is the one that docker puts in place, although replacing it with the proper upstream version does not change anything.
These installations are completely standard: fresh Docker edge install from yesterday, went into preferences and enabled Kubernetes as orchestrator, followed the Conduit getting started guide to get it installed.
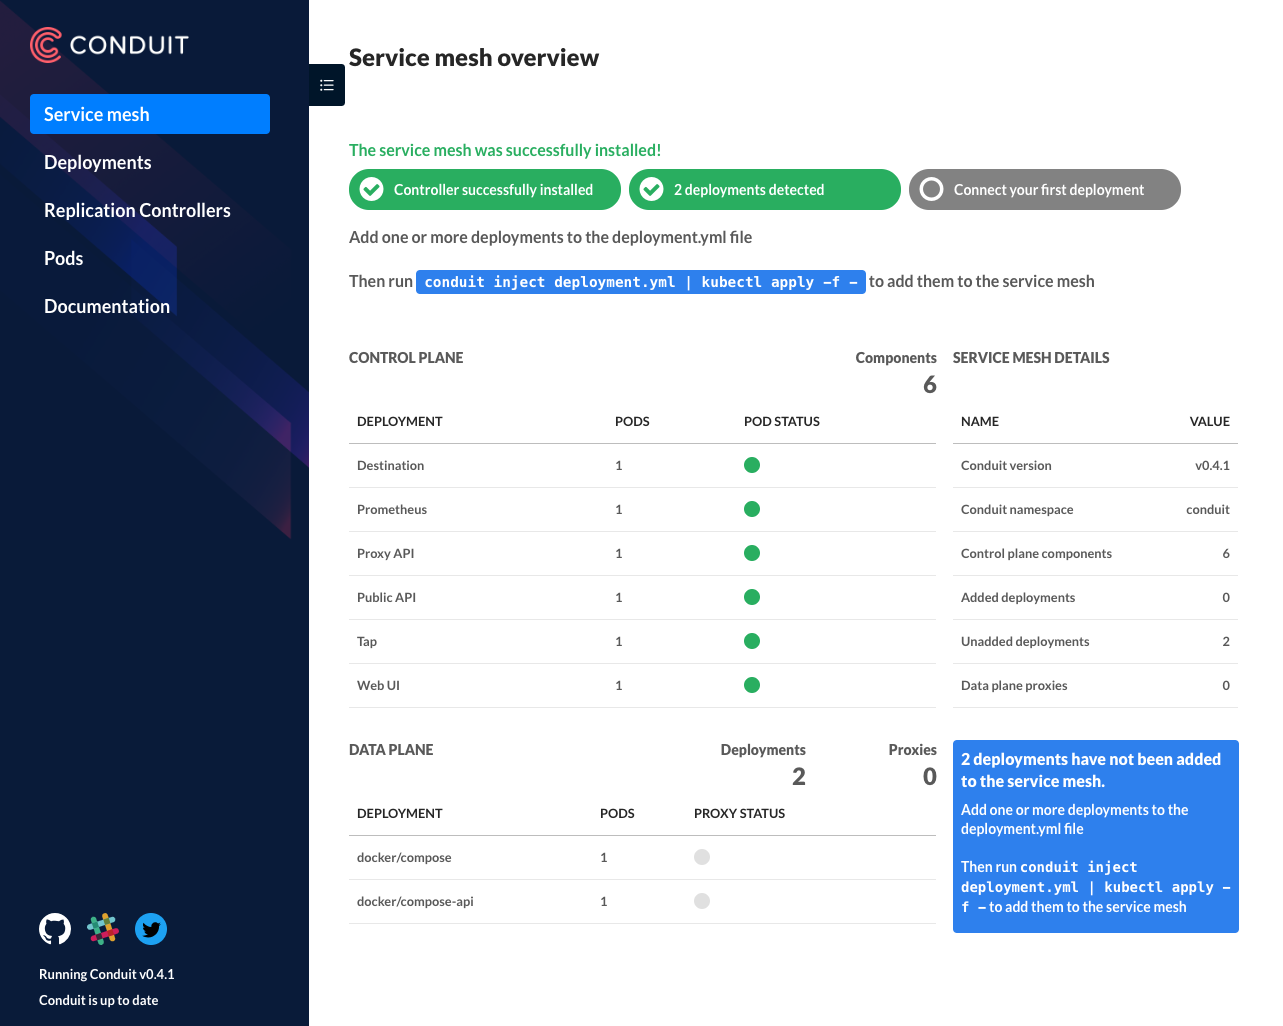
Opening the Conduit dashboard shows me this view at first:
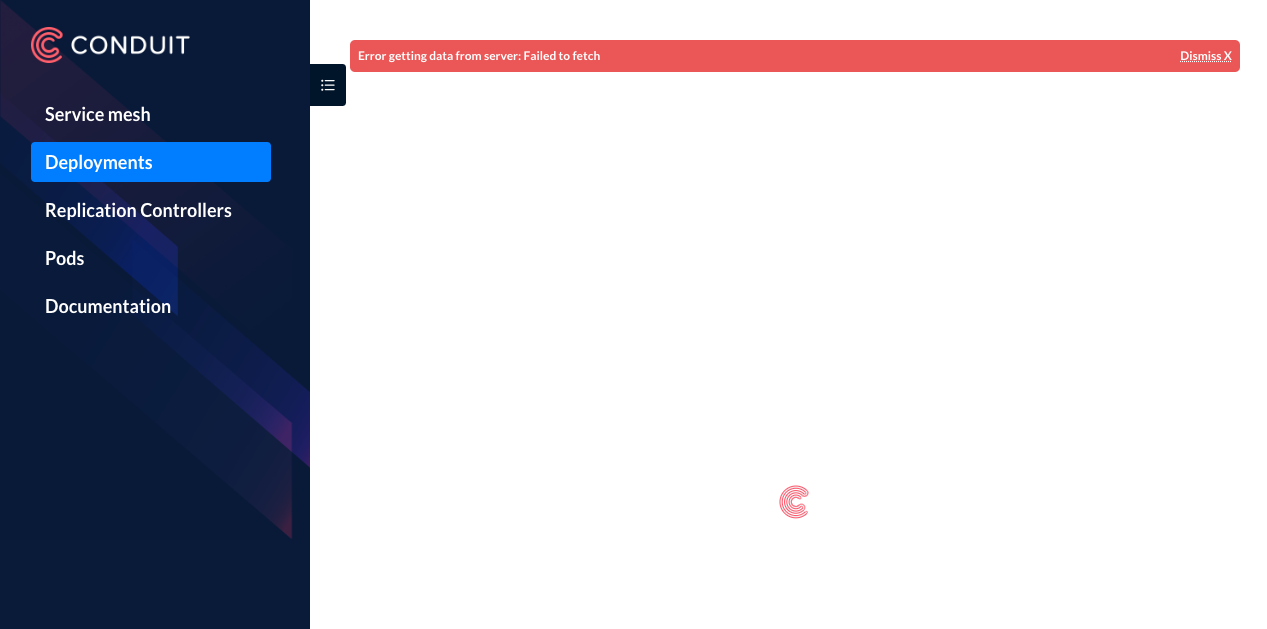
Clicking through to any of the other tabs shows me an error:
Which is also visible in the controller logs:
$ kubectl logs controller-5b576d647b-w62rq --namespace conduit public-api
time="2018-05-17T10:48:34Z" level=info msg="running conduit version v0.4.1"
time="2018-05-17T10:48:34Z" level=info msg="serving scrapable metrics on :9995"
time="2018-05-17T10:48:34Z" level=info msg="waiting for caches to sync"
time="2018-05-17T10:48:34Z" level=info msg="starting HTTP server on :8085"
E0517 10:48:35.214477       1 reflector.go:205] k8s.io/client-go/informers/factory.go:86: Failed to list *v1beta2.Deployment: Get https://10.96.0.1:443/apis/apps/v1beta2/deployments?limit=500&resourceVersion=0: read tcp 10.1.0.41:42956->10.96.0.1:443: read: connection reset by peer
E0517 10:48:35.239883       1 reflector.go:205] k8s.io/client-go/informers/factory.go:86: Failed to list *v1.ReplicationController: Get https://10.96.0.1:443/api/v1/replicationcontrollers?limit=500&resourceVersion=0: read tcp 10.1.0.41:42962->10.96.0.1:443: read: connection reset by peer
E0517 10:48:35.240231       1 reflector.go:205] k8s.io/client-go/informers/factory.go:86: Failed to list *v1.Pod: Get https://10.96.0.1:443/api/v1/pods?limit=500&resourceVersion=0: read tcp 10.1.0.41:42958->10.96.0.1:443: read: connection reset by peer
E0517 10:48:35.240290       1 reflector.go:205] k8s.io/client-go/informers/factory.go:86: Failed to list *v1beta2.ReplicaSet: Get https://10.96.0.1:443/apis/apps/v1beta2/replicasets?limit=500&resourceVersion=0: read tcp 10.1.0.41:42960->10.96.0.1:443: read: connection reset by peer
E0517 10:48:35.251622       1 reflector.go:205] k8s.io/client-go/informers/factory.go:86: Failed to list *v1.Namespace: Get https://10.96.0.1:443/api/v1/namespaces?limit=500&resourceVersion=0: read tcp 10.1.0.41:42966->10.96.0.1:443: read: connection reset by peer
E0517 10:48:35.256675       1 reflector.go:205] k8s.io/client-go/informers/factory.go:86: Failed to list *v1.Service: Get https://10.96.0.1:443/api/v1/services?limit=500&resourceVersion=0: read tcp 10.1.0.41:42978->10.96.0.1:443: read: connection reset by peer
time="2018-05-17T10:48:36Z" level=info msg="caches synced"
All the Conduit-proxy endpoints are green in Prometheus, similar to your screenshot.
Deploying the emojivoto app, my dashboard changes to this:
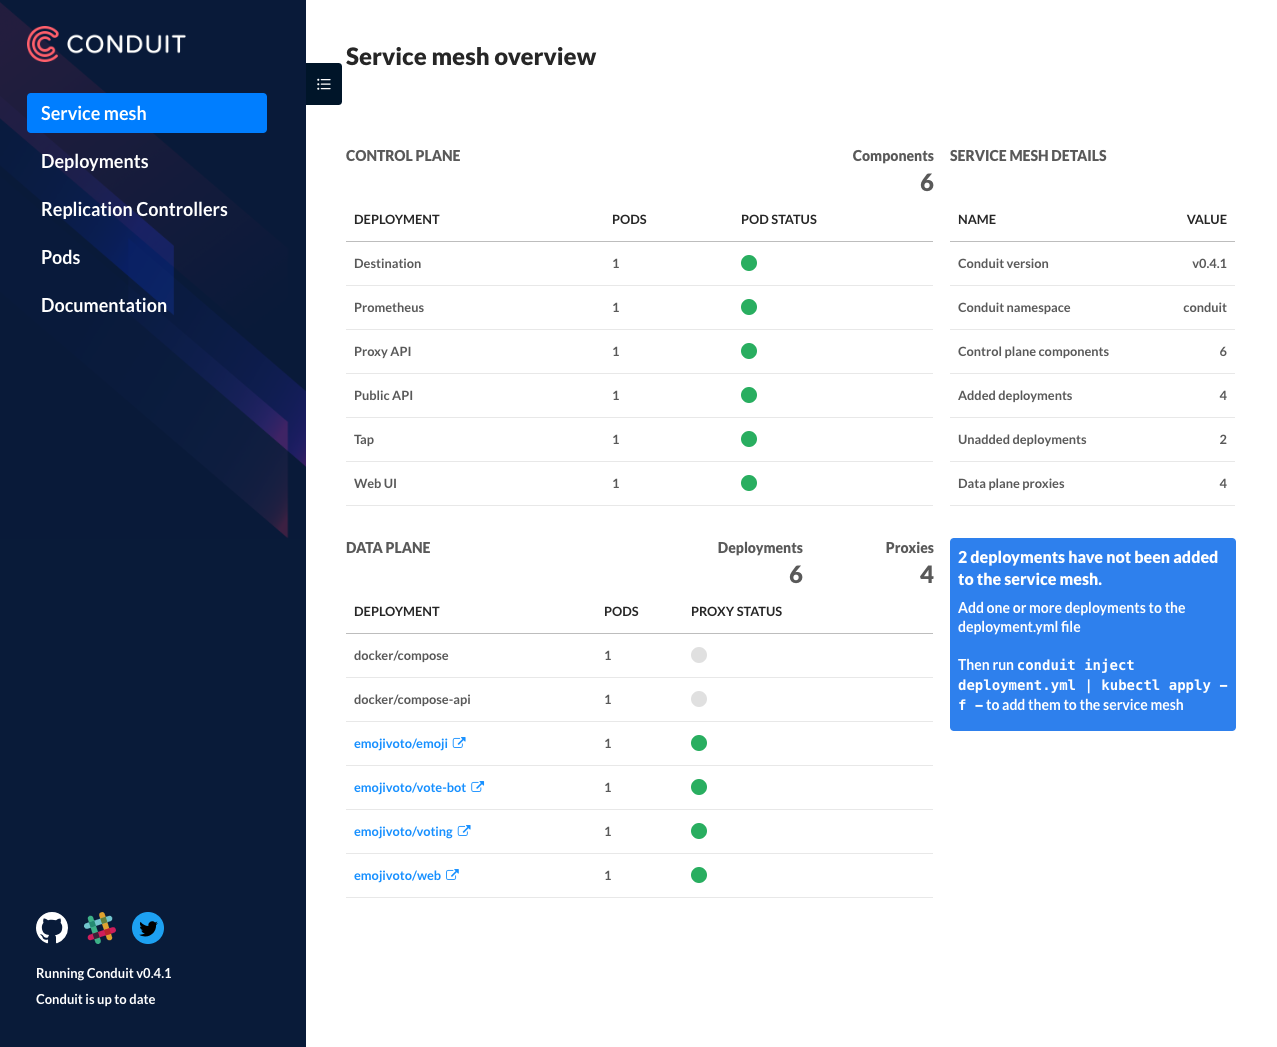
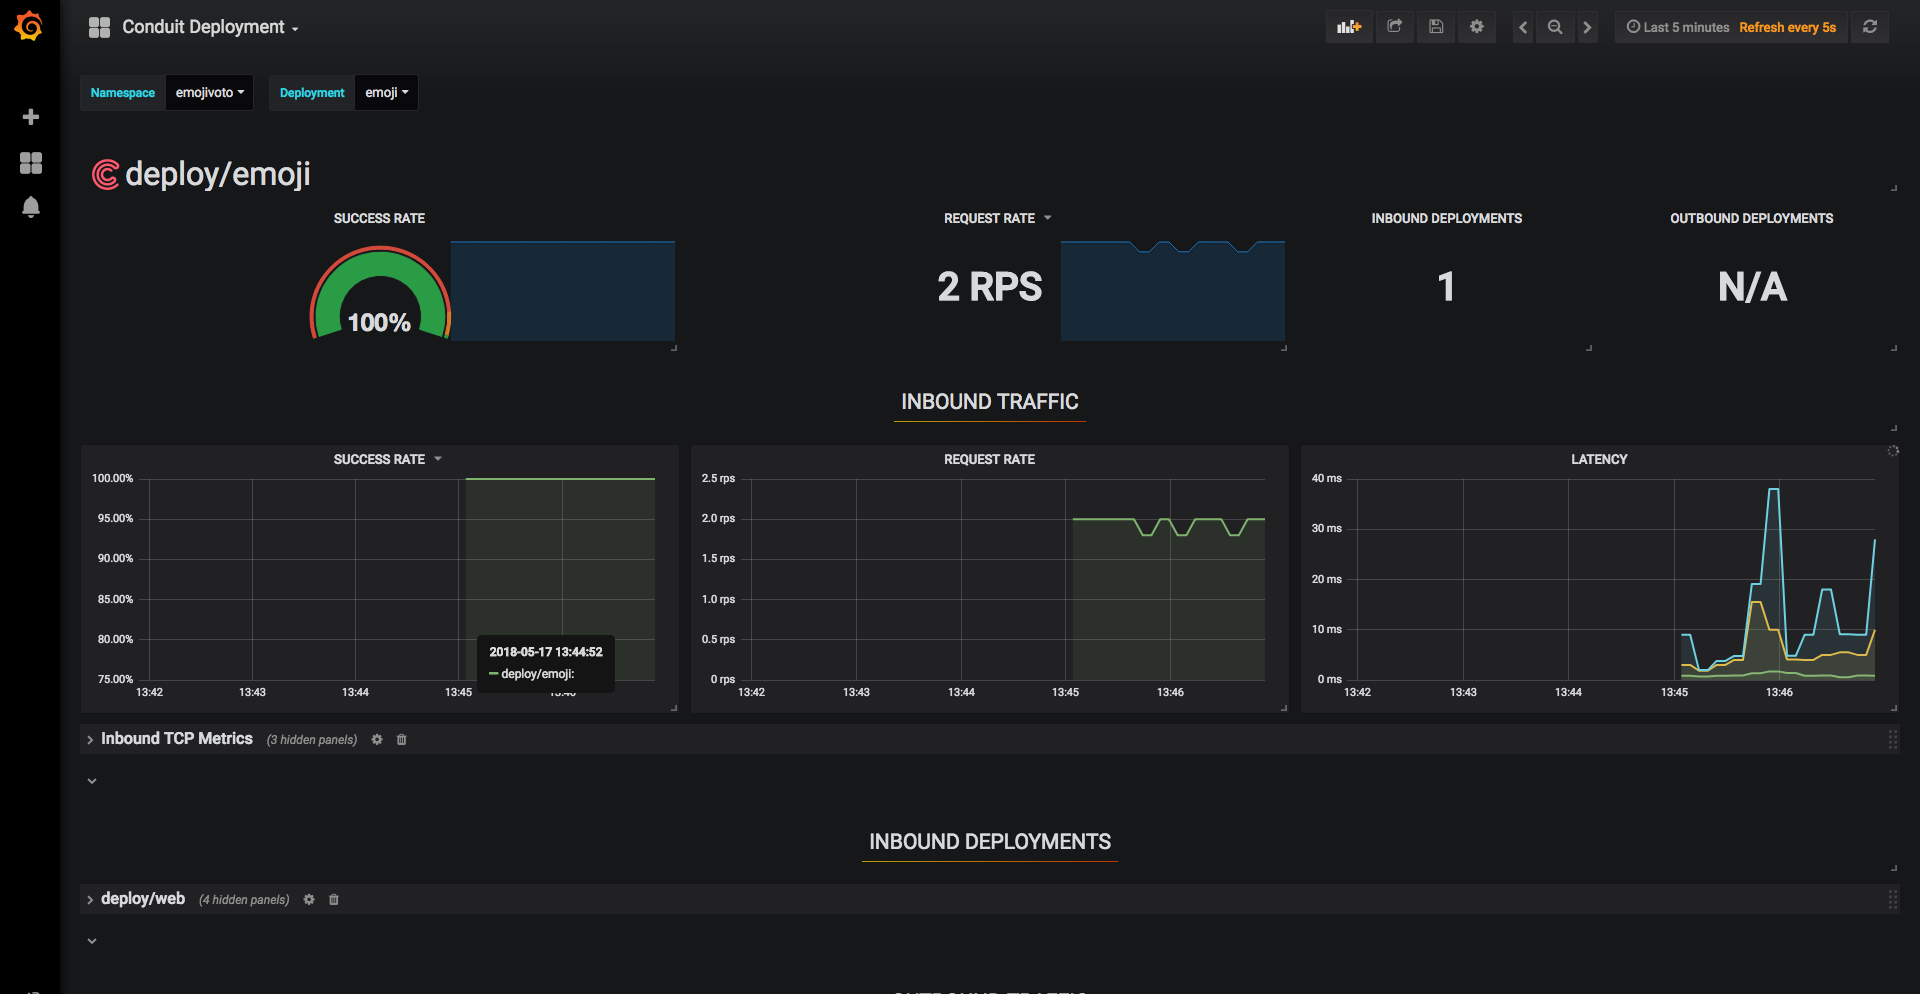
The grafana dashboard have data in them:
However, I still get the same errors as above on the conduit dashboard, and can get no stats out of conduit
~ $ conduit stat deploy
No traffic found.
~ $ conduit tap deploy emojivoto/voting
Error: deployment.apps "emojivoto/voting" not found
@bcorijn Thanks for the helpful writeup! All of these details are great. I agree that it seems like there are two separate issues:
- Injected pods are not being displayed as part of the service mesh in the web UI
- All of the sub-navigation pages in the web UI fail to load
Based on your feedback it looks like you're experiencing the second issue, and not the first. I think that the first issue is a result of prometheus failing to scrape the injected proxies, but you're seeing prometheus data in your setup, so that part seems to be working.
As far as the second issue goes, I still don't have a lot of leads on what might be causing it. Can you check the XHR response body from one of the failed fetch requests when navigating to another page, to see if it provides any additional error details? For instance, in Chrome, I would use:
I also included some more info below about some of the other details that you posted. Thanks again for such a thorough report.
Regarding the controller logs that you pasted, this log message is expected:
$ kubectl logs controller-5b576d647b-w62rq --namespace conduit public-api
...
E0517 10:48:35.214477       1 reflector.go:205] k8s.io/client-go/informers/factory.go:86: Failed to list *v1beta2.Deployment: Get https://10.96.0.1:443/apis/apps/v1beta2/deployments?limit=500&resourceVersion=0: read tcp 10.1.0.41:42956->10.96.0.1:443: read: connection reset by peer
...
time="2018-05-17T10:48:36Z" level=info msg="caches synced"
The issue here is that the public-api process tries to query the kubernetes API immediately on startup, but that initial query fails if the conduit proxy in the controller pod hasn't initialized yet. Fear not! The API calls are retried until they succeed. So as long as you see the "caches synced" message as the last message in the log, that means that the calls eventually succeed and the process is up and running as expected.
As an aide, those error message in the log are actually coming from glog statements in the k8s.io/apimachinery package, here. We're redirecting all glog output to stderr, so they show up in the container's log. If we find that the glog messages are distracting and not useful, we might want to consider discarding the glog messages instead. Relates to #664.
Regarding the conduit stat and conduit tap commands, I suspect that those command will return data in your environment, but as written they're not configured to point to the right namespace.
~ $ conduit stat deploy
No traffic found.
^ This command only displays stats for the "default" namespace, since you're not specifying the --namespace flag. In the case of the Getting Started guide, all emojivoto pods are running in the "emojivoto" namespace, so this command should return stats for you:
conduit stat deploy --namespace emojivoto
We also changed the way in which resource types and namespaces are handled in CLI command targets as part of conduit v0.4.1. So it's no longer valid to specify a target as <namespace>/<name>. You would need to specify the target as <resource-type>/<name>, and then use the --namespace flag.
~ $ conduit tap deploy emojivoto/voting
Error: deployment.apps "emojivoto/voting" not found
^ This command is attempting to tap a resource named "voting" of type "emojivoto" in the "default" namespace, which doesn't exist. I think this should work for you instead:
conduit tap deploy/voting --namespace emojivoto
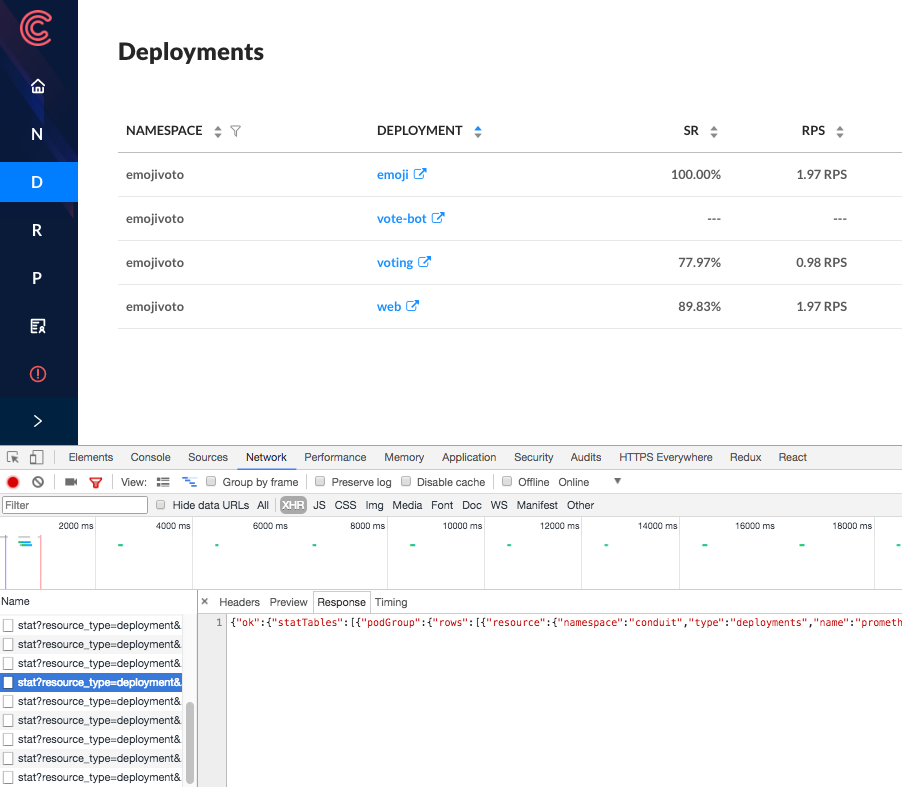
@klingerf Checking the XHR response answered the question immediately :) Chrome dev tools showed all XHR requests as ERR_BLOCKED_BY_CLIENT. Disabling my uBlock Origin adblocker made everything pop up as expected.
I hadn't suspected my adblocker for a local container, but apparently the api/stat? part of the url got flagged by an adblocker rule.
To answer your other remarks:
- Good to hear that as long as the caches get synced, everything is fine. It does look quite gloomy if you are not fully aware that it is expected behaviour.
- Specifying the namespace does make the tap/stats command work as well. I am not sure why I didn't think about specifying the namespace. Maybe seeing the dashboard throwing errors sent me on a side-track figuring out what was going on and got me distracted, or I accidentally landed on a doc page here in github of an older revision/tag and did not notice it was different.
In any case, apologies for sounding the alarm for what was user error.
bcorijn
on 18 May 2018
I wonder if we could use the same strategy that news sites use to detect ad blockers to at least warn users that the UI won't work well, and it's not due to ads.
 olix0r
on 18 May 2018
olix0r
on 18 May 2018
@bcorijn Ok great, glad you got it figured out! And thanks for bearing with us as we tracked it down. It will be really helpful going forward to know that the web UI doesn't work with adblockers enabled. I agree that it would be great if we could auto-detect and warn, and I opened #970 to track that.
I'll leave this issue open for a few more days to see if we have any additional reports of the other issue that's capture here:
- Injected pods are not being displayed as part of the service mesh in the web UI
klingerf
on 18 May 2018
@jakerobb reported a similar issue to this one in the #conduit channel of the linkerd slack. After quite a bit of debugging, we figured out that all requests from the conduit web pod to the public-api container in the conduit controller pod were failing. It appears that the conduit proxy in the web pod ended up in a state where it was unable to route outbound requests, and it was repeatedly logging the following error:
ERR! conduit_proxy turning Error caused by underlying HTTP/2 error: protocol error: unexpected internal error encountered into 500
The net effect of this problem was that all API requests from the web container to both the conduit API and the kubernetes API were failing, which resulted in the web UI looking like this:
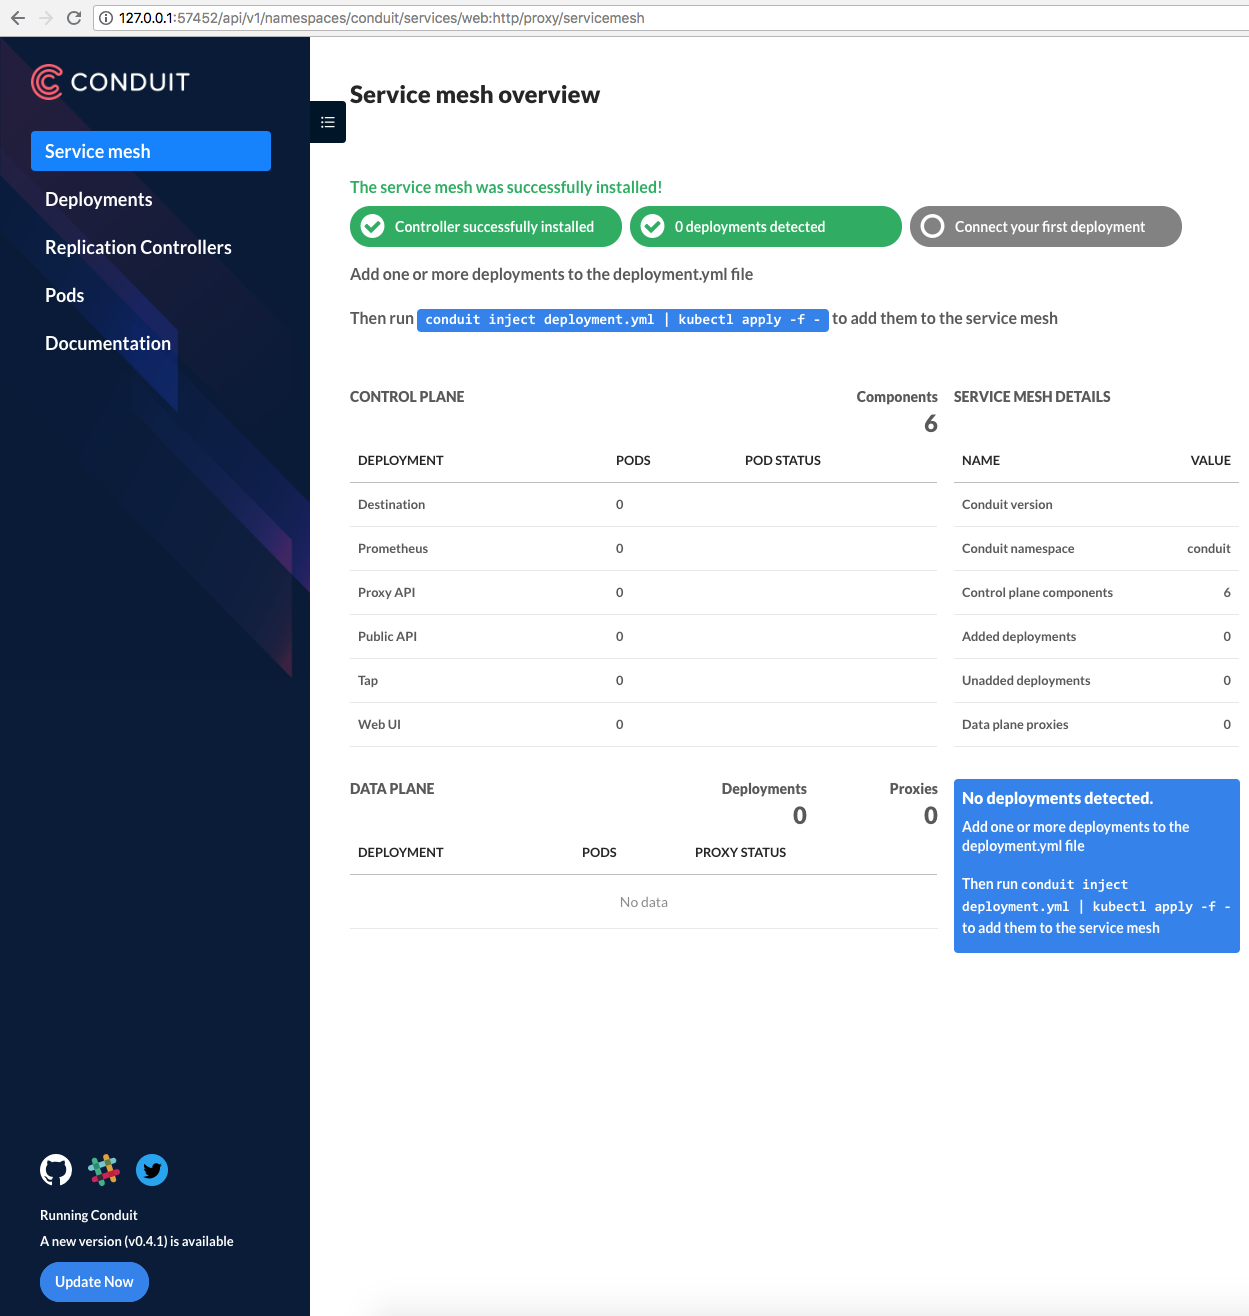
It's also worth noting that the latest version check in the sidebar was failing, prompting him to upgrade conduit even though he was running the latest version, since the version check relies on querying the currently running version from the conduit API. We might want to think about encoding the version information directly into the web server build, to avoid making an API call.
Restarting the web pod fixed the issue. If other folks encounter a similar problem, it would be helpful if they could grab the web pod's proxy log prior to restarting the pod, with:
kubectl -n conduit logs $(kubectl -n conduit get po | grep web | cut -f1 -d' ') conduit-proxy
I'm going to close this since there haven't been any new reports recently. The root cause of some of the original reports was the use of adblockers, and that was fixed in #1105.
klingerf
on 11 Jul 2018
Related issues
 skalinets
·
3Comments
skalinets
·
3Comments
 coleca
·
4Comments
coleca
·
4Comments
 briansmith
·
4Comments
briansmith
·
4Comments
 ihcsim
·
4Comments
ihcsim
·
4Comments
 steve-fraser
·
4Comments
steve-fraser
·
4Comments
Most helpful comment
I wonder if we could use the same strategy that news sites use to detect ad blockers to at least warn users that the UI won't work well, and it's not due to ads.