Lighthouse-ci: CI server dashboard unresponsive
Hi,
Firstly, thanks for all your work on Lighthouse-ci, it is amazing!
I noticed an issue when setting up that I wanted to report as it's a bit strange... When visiting the main dashboard page performance seems really poor. Opening the sidebar takes about 7 seconds and I only see about 3 frames of the animation. Hovering over a project card also makes it clear something odd is going on as the hover styles take a second or two to apply.
I don't think I've done anything weird, and have just setup LHCI server on AppEngine, although I see the same behaviour by just following the docs and running the server locally:
npm install -D @lhci/cli @lhci/server sqlite3
npx lhci server --storage.storageMethod=sql --storage.sqlDialect=sqlite --storage.sqlDatabasePath=./db.sql
My machine is a 15" MacBook Pro 2019.
Digging into this a bit:
Looking in DevTools I can see some really long RasterizePaint events (~7s):
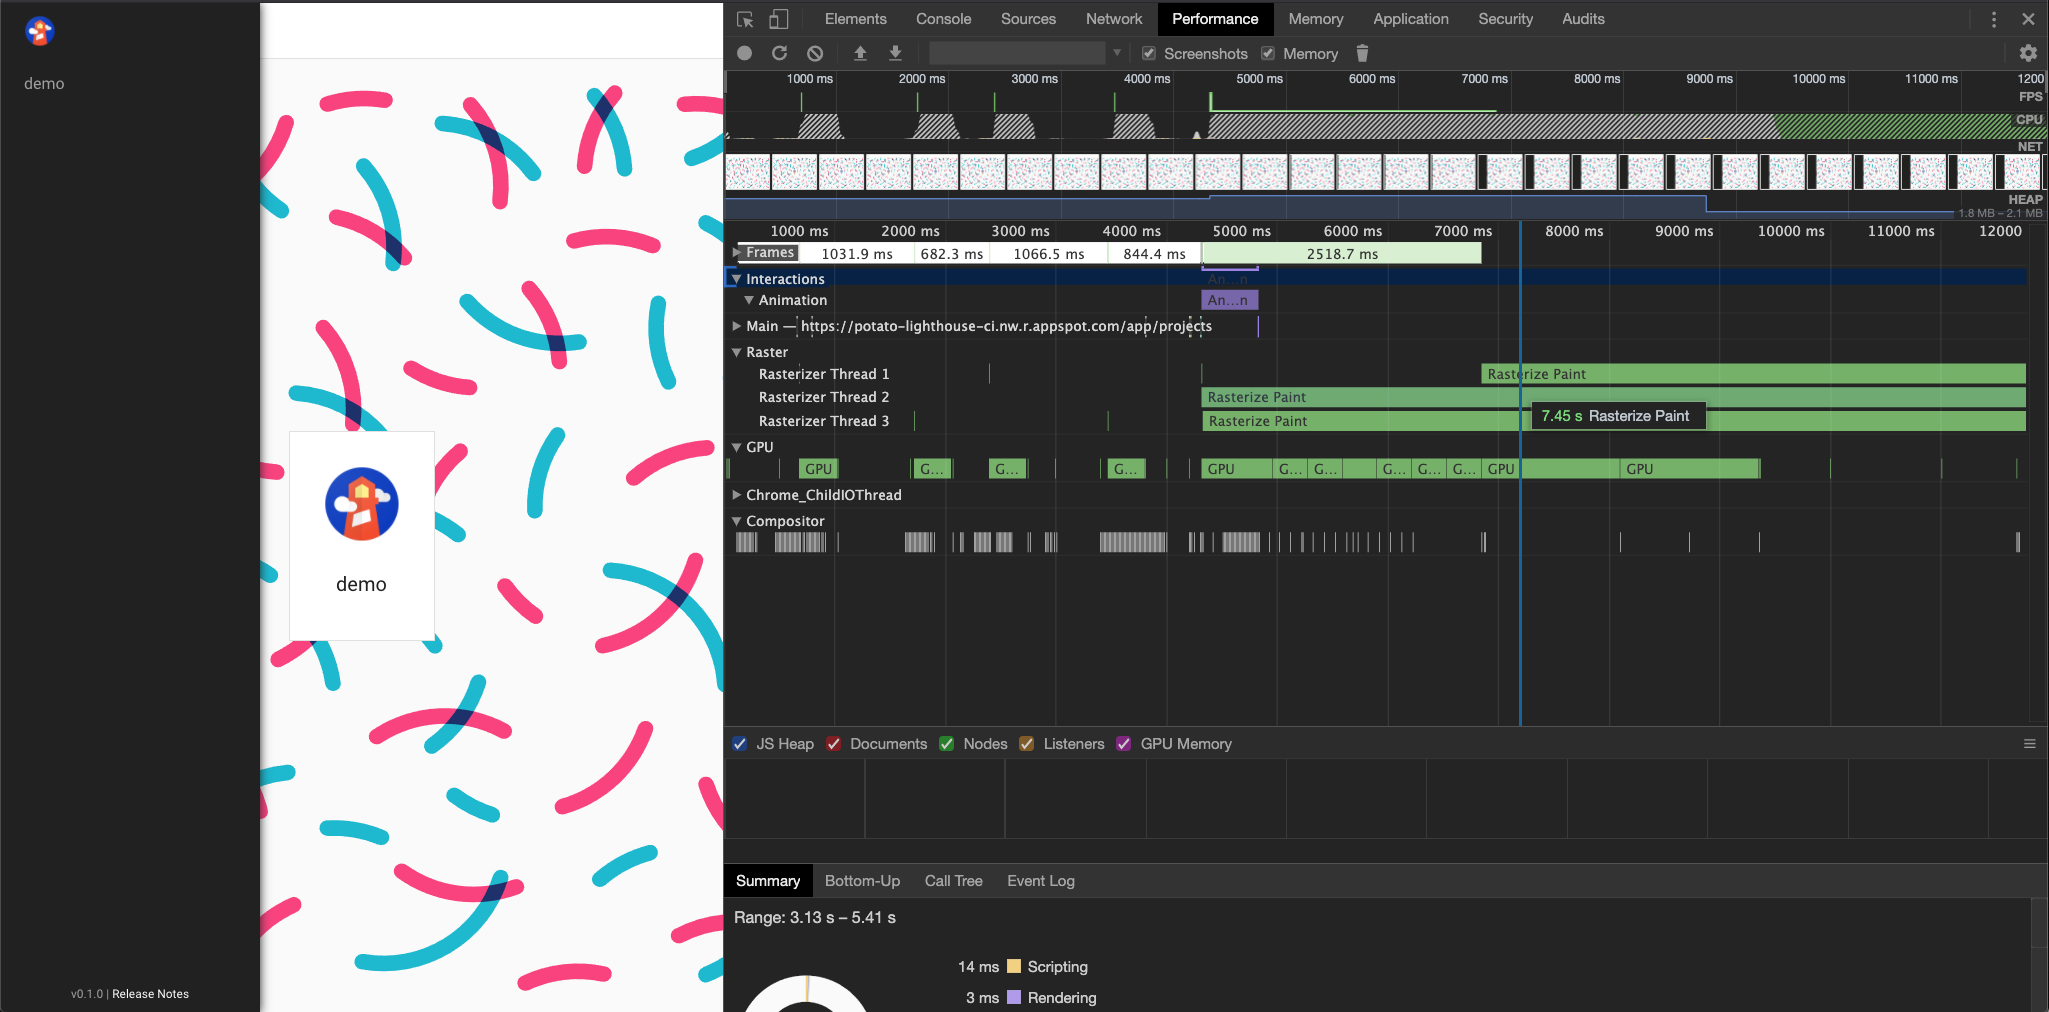
When I'm viewing a report diff view or lighthouse report I don't see this issue. It only seems to be a problem on the main dashboard page.
If I display: none the <div class="project-list__confetti-background"> the issue goes away. Looking into the SVG I see a that there is significant usage of mix-blend-mode:multiply, and removing this inline style from the source SVG fixes the performance problem (but obviously changes how the background appears):
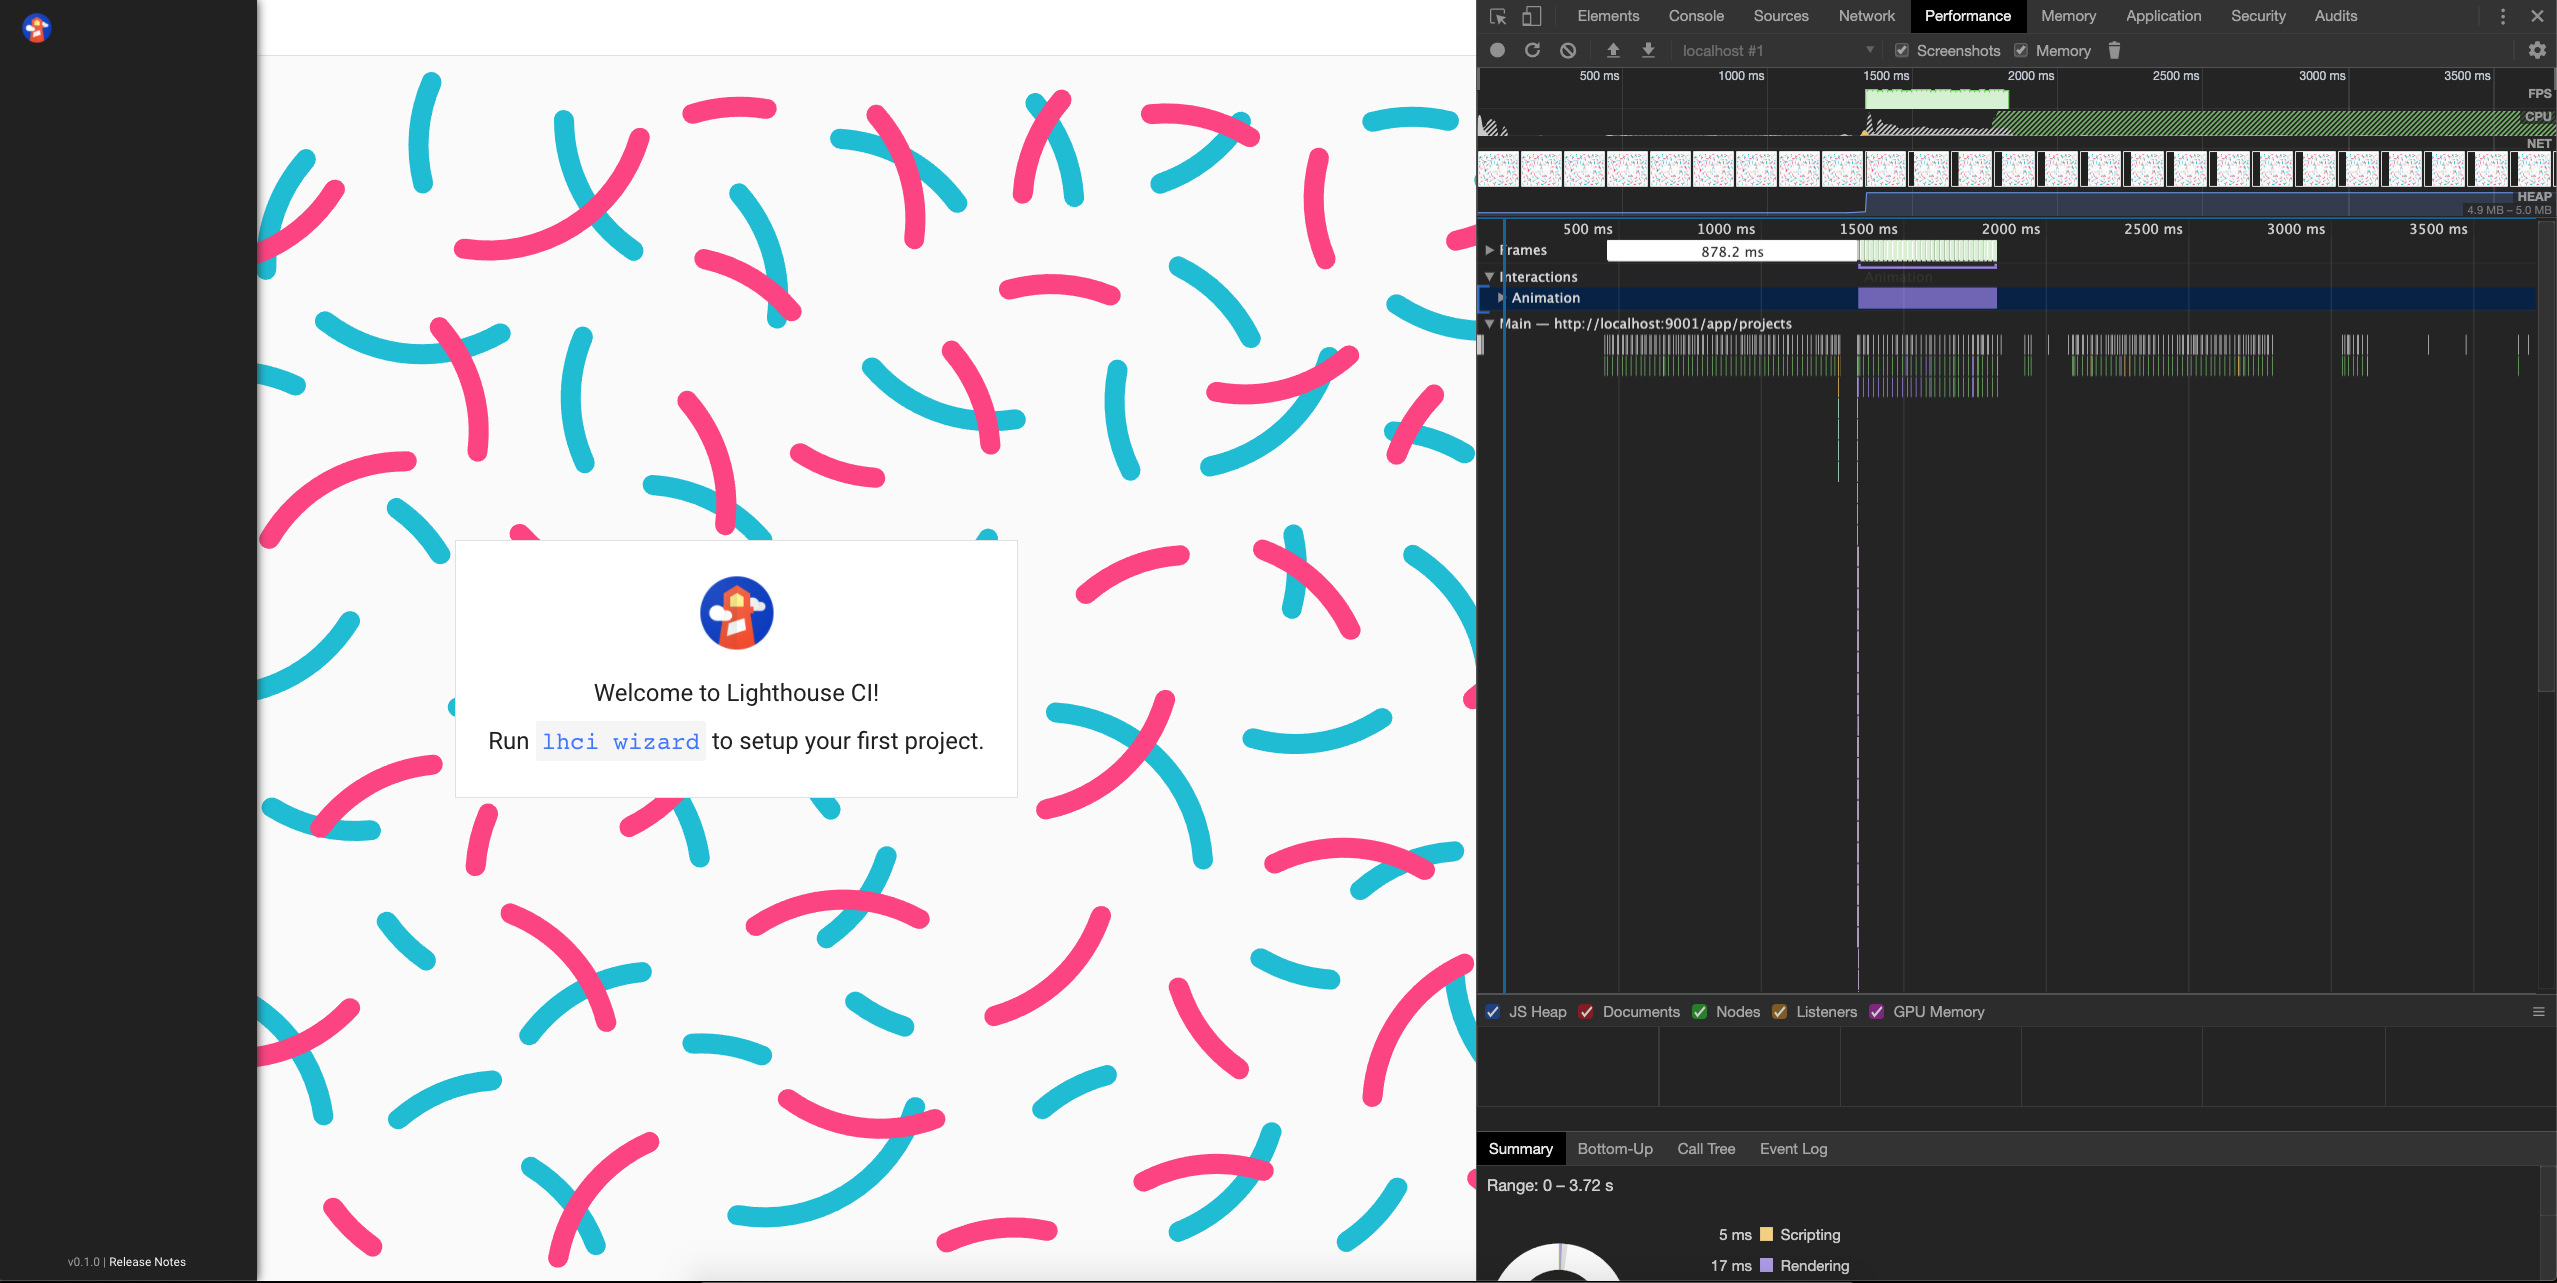
Perhaps we need to go easy on mix-blend-mode?
 WillsB3
All 5 comments
Thank you very much for this excellent report with great detail! You've certainly done Lighthouse CI proud we really appreciate your time on this :)
A few notes on what's going on here:
The "Rasterize Paint" times are unfortunately just broken in DevTools Performance panel and have been for a little while. Using chrome://tracing reveals that the actual raster tasks are just a few ms long but DevTools UI displays them as start tasks without an end and automatically extends them to the end of the trace. Even with your fix if I let the trace continue for 20s, then the "RasterizePaint" times are reported as... you guessed it 20s :)
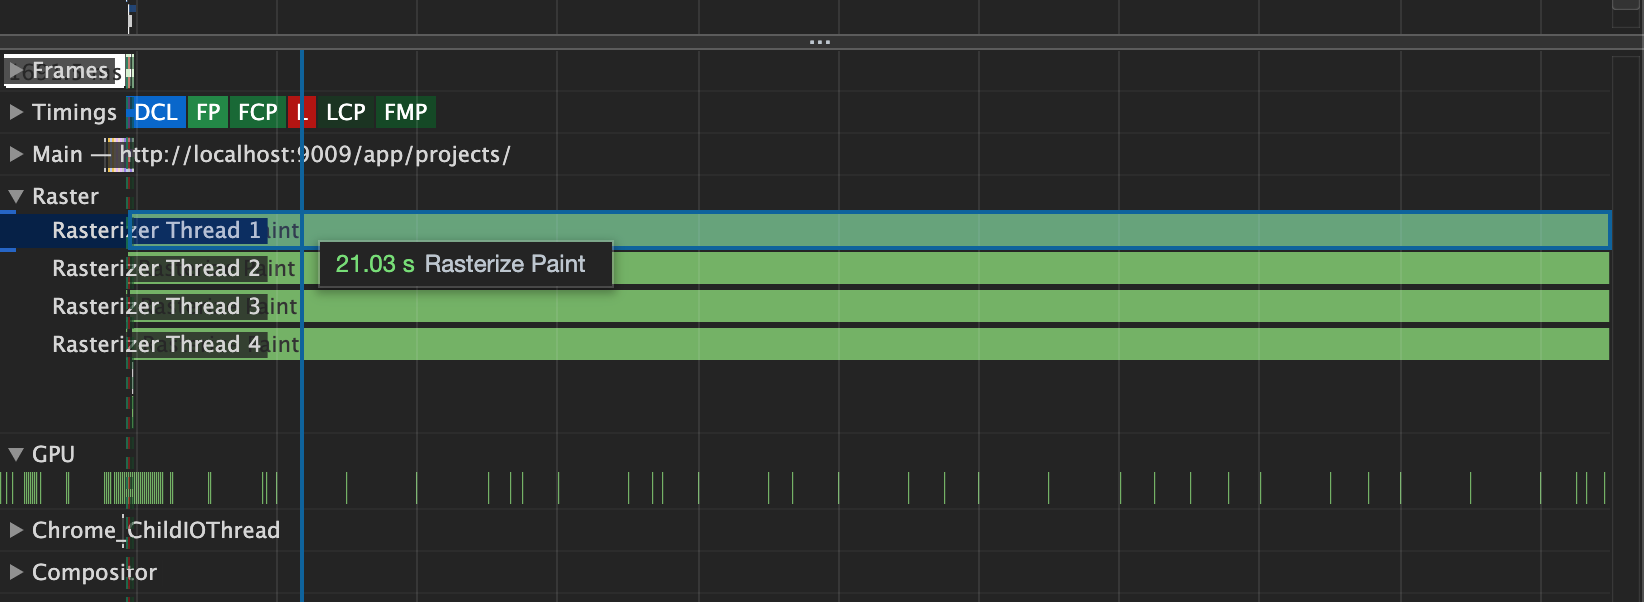
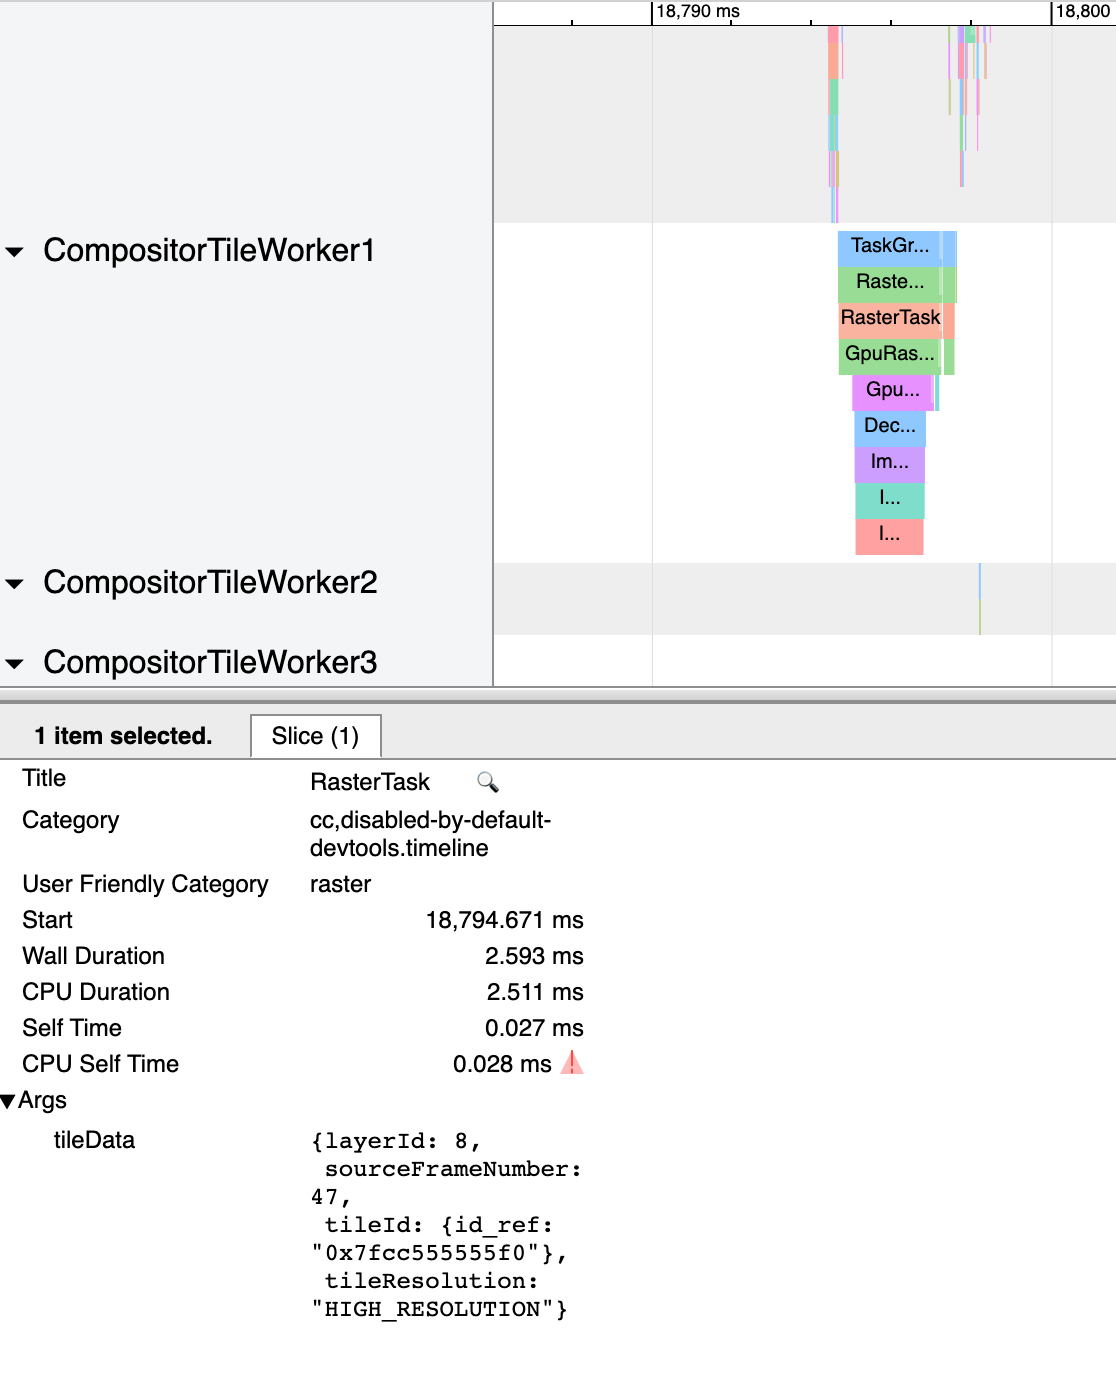
If rasterize paint isn't the problem then what's going on? I would assume, and traces seem to confirm, that multiply blend mode gets applied at the GPU. Having about 100 multiply blend modes on top of each other in the same compositor layer is a relatively taxing operation compared to normal layering (roughly 400x more taxing according to my traces, ~0.5ms -> ~200ms). Additionally, because it's happening on the GPU, DevTools CPU throttling doesn't appear to do anything to help simulate worse experiences. Because of this and the fact that my 2014 macbook is always plugged in to external monitors so I'm always in high-performance graphics mode, even my performance tests at 6x throttling don't recreate the behavior you describe.
This might be a good category to introduce to Lighthouse audits "long GPU tasks" and a candidate for improved simulation.
Long story short, IMO multiply is a nice touch but not an essential factor to the design here and not worth the performance cost, so we'll happily remove it.
 patrickhulce
on 20 Apr 2020
patrickhulce
on 20 Apr 2020
Thanks for the detailed reply - Today I learned!
Because of this and the fact that my 2014 macbook is always plugged in to external monitors so I'm always in high-performance graphics mode, even my performance tests at 6x throttling don't recreate the behavior you describe.
It's very strange that you can't recreate it with the scenario you specified, as I also ran the tests in a very similar setup (connected to an external (1x DPI) monitor, while being plugged into power - so I can only assume that my machine was using the internal Radeon Pro 555X 4 GB instead of the lower power Intel UHD Graphics 630 1536 MB). What I found strange is that it made my entire machine lag - almost like it was affecting more than just the page process, but I don't have any hard evidence of this yet…
Which GPU do you have when running in high-performance mode? Maybe there's something funny going on with my Radeon Pro.
WillsB3
on 20 Apr 2020
I built most of LHCI on the mid-2014 15" MBP w/NVIDIA GeForce GT 750M. I recently upgraded to the Late-2019 16" MBP w/AMD Radeon Pro 5500M and am unable to observe the behavior you describe on either. I mean, it's definitely slower than it should be to paint (~200-600ms on first raster) but not very noticeable outside of traces and certainly not impacting any animations later or the rest of my system.
What I found strange is that it made my entire machine lag - almost like it was affecting more than just the page process
Yikes! That sounds like something wonky with the GPU...
patrickhulce
on 20 Apr 2020
Just wanted to followup here that I recently used the project list page on a different, publicly available server, and YIKES! Immediate and MASSIVE difference in sluggishness. I have no clue what makes the difference between the server deployed on an internal IP and a web-accessible one and we've fixed it now anyway, but holy crap is it awful. Definitely not just your GPU @WillsB3!
patrickhulce
on 23 Apr 2020
😄 Thanks for the followup - Good to know it wasn't just me.
Good stuff on the fix 🎉
WillsB3
on 23 Apr 2020
Related issues
 WebCloud
·
4Comments
WebCloud
·
4Comments
 mansona
·
3Comments
mansona
·
3Comments
 mathiasbynens
·
4Comments
mathiasbynens
·
4Comments
 GreedyA1
·
3Comments
GreedyA1
·
3Comments
 xavierfoucrier
·
4Comments
xavierfoucrier
·
4Comments
Most helpful comment
Thank you very much for this excellent report with great detail! You've certainly done Lighthouse CI proud we really appreciate your time on this :)
A few notes on what's going on here:
The "Rasterize Paint" times are unfortunately just broken in DevTools Performance panel and have been for a little while. Using
chrome://tracingreveals that the actual raster tasks are just a few ms long but DevTools UI displays them as start tasks without an end and automatically extends them to the end of the trace. Even with your fix if I let the trace continue for 20s, then the "RasterizePaint" times are reported as... you guessed it 20s :)If rasterize paint isn't the problem then what's going on? I would assume, and traces seem to confirm, that multiply blend mode gets applied at the GPU. Having about 100 multiply blend modes on top of each other in the same compositor layer is a relatively taxing operation compared to normal layering (roughly 400x more taxing according to my traces, ~0.5ms -> ~200ms). Additionally, because it's happening on the GPU, DevTools CPU throttling doesn't appear to do anything to help simulate worse experiences. Because of this and the fact that my 2014 macbook is always plugged in to external monitors so I'm always in high-performance graphics mode, even my performance tests at 6x throttling don't recreate the behavior you describe.
This might be a good category to introduce to Lighthouse audits "long GPU tasks" and a candidate for improved simulation.
Long story short, IMO multiply is a nice touch but not an essential factor to the design here and not worth the performance cost, so we'll happily remove it.