Lens: Nothing is showing on dashboards, no errors
Describe the bug
I have a properly configured gcloud and kubectl CLI tools.
They all work just fine.
But when I have imported all the contexts from kubeconfig into Lens, there is no information at all.
To Reproduce
- Add a cluster from kubeconfig
- Connect to it
- No information, empty dashboards
Expected behavior
Some error that explains why this happened or better - data from kubernetes cluster.
Screenshots
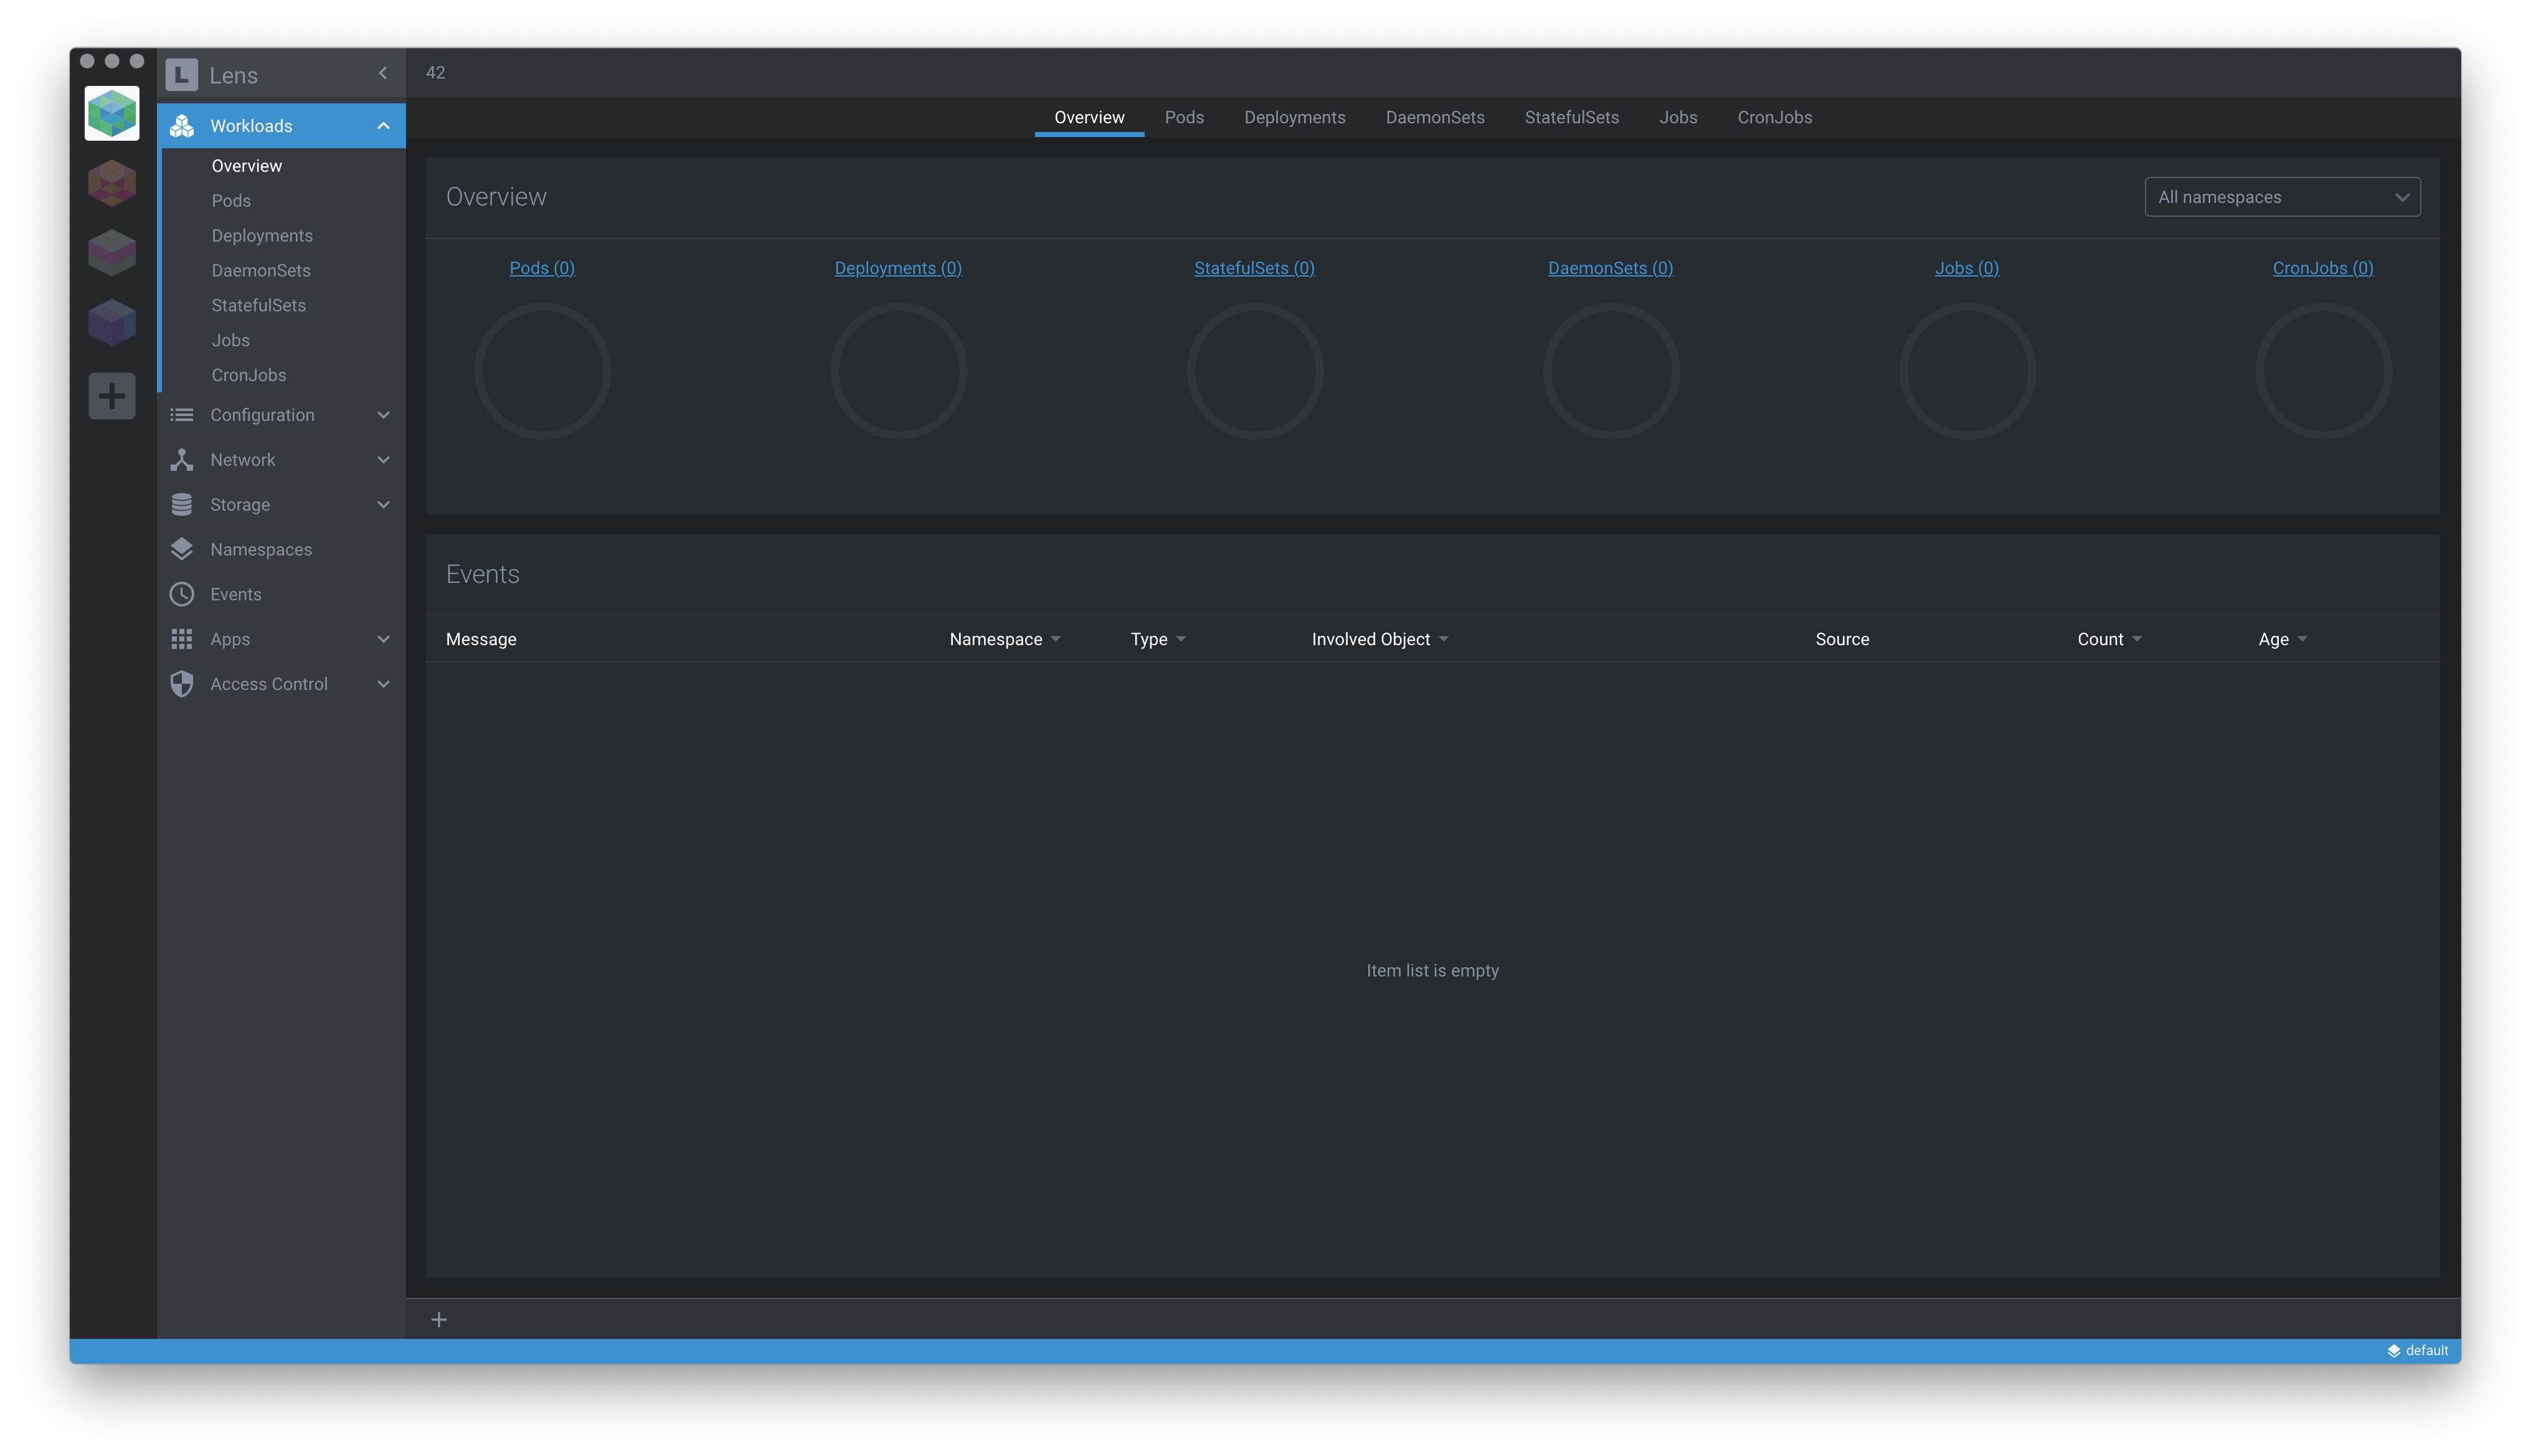
Environment (please complete the following information):
- Lens Version: 3.2.0
- OS: OSX
- Installation method: AppImage
Logs:
When you run the application executable from command line you will see some logging output. Please paste them here:
Not sure how to get logs from command line if I'm running an .app
Kubeconfig:
Quite often the problems are caused by malformed kubeconfig which the application tries to load. Please share your kubeconfig, remember to remove any secret and sensitive information.
apiVersion: v1
clusters:
- cluster:
    certificate-authority-data: DATA+OMITTED
    server: DATA+OMITTED
  name: "DATA+OMITTED"
contexts:
- context:
    cluster: "DATA+OMITTED"
    user: DATA+OMITTED
  name: "DATA+OMITTED"
current-context: "DATA+OMITTED"
kind: Config
preferences: {}
users:
- name: DATA+OMITTED
  user:
    auth-provider:
      config:
        client-id: DATA+OMITTED
        client-secret: DATA+OMITTED
        id-token: DATA+OMITTED
        idp-issuer-url: DATA+OMITTED
        refresh-token: DATA+OMITTED
      name: oidc
 ghaiklor-wix
All 10 comments
At least you get something, mine is blank after adding cluster from kubeconfig. It's a GKE cluster
Version: 3.2.0

 lihan
on 14 Apr 2020
lihan
on 14 Apr 2020
Mine also - completely blank after update to 3.2/3.3 - It shows "Connecting... Authentication proxy started" for a while then just has a blank screen. This happens for EKS, Local KIND, and Digital Ocean clusters. This is on Mac OS X 10.15.4
I can see the proxies running in the process list and can poke them on the right port with Host: header and they respond. Very odd.
For example with a KinD cluster:
/Users/sra/Library/Application Support/Lens/binaries/kubectl/1.17.4/kubectl proxy -p 49903 --kubeconfig /var/folders/k_/7k3hg40j2jldqbq24w_b8b7h0000gn/T//nzma20sqj6l-1lpqshy7qpy-kubeconfig --accept-hosts 127.0.0.1
$ http localhost:49903 Host:127.0.0.1
HTTP/1.1 200 OK
Content-Type: application/json
Date: Sat, 18 Apr 2020 11:48:37 GMT
Transfer-Encoding: chunked

{
    "paths": [
        "/api",
        "/api/v1",
        "/apis",
...
I can't seem to find any logs that can help figure out what the issue is. This is an electron app, there is normally a "show developer tools" menu that isn't there either. Might have to break down and try running in development mode! :)
 sra
on 18 Apr 2020
sra
on 18 Apr 2020
Yes, I suggest cloning this repo and running in dev mode. You might be able to see errors that are otherwise hidden.
 miskun
on 18 Apr 2020
miskun
on 18 Apr 2020
Starting in dev mode in the console is:
accessible watch, vals: true undefined
ClusterPage.vue?557e:93 lens loaded
/Users/sra/workspace/lens/node_modules/electron/dist/Electron.app/Contents/Resources/electron.asar/renderer/callbacks-registry.js:41 Uncaught (in promise) Error: Script failed to execute, this normally means an error was thrown. Check the renderer console for the error.
    at WebFrame.<computed> (/Users/sra/workspace/lens/node_modules/electron/dist/Electron.app/Contents/Resources/electron.asar/renderer/api/web-frame.js:64)
    at WebFrame.executeJavaScript (/Users/sra/workspace/lens/node_modules/electron/dist/Electron.app/Contents/Resources/electron.asar/common/api/deprecate.js:114)
    at /Users/sra/workspace/lens/node_modules/electron/dist/Electron.app/Contents/Resources/electron.asar/renderer/web-frame-init.js:11
    at /Users/sra/workspace/lens/node_modules/electron/dist/Electron.app/Contents/Resources/electron.asar/renderer/ipc-renderer-internal-utils.js:7
    at new Promise (<anonymous>)
    at EventEmitter.<anonymous> (/Users/sra/workspace/lens/node_modules/electron/dist/Electron.app/Contents/Resources/electron.asar/renderer/ipc-renderer-internal-utils.js:7)
    at EventEmitter.emit (events.js:200)
    at Object.onMessage (/Users/sra/workspace/lens/node_modules/electron/dist/Electron.app/Contents/Resources/electron.asar/renderer/init.js:42)
(anonymous) @ /Users/sra/workspace/lens/node_modules/electron/dist/Electron.app/Contents/Resources/electron.asar/renderer/api/remote.js:261
metaToPlainObject @ /Users/sra/workspace/lens/node_modules/electron/dist/Electron.app/Contents/Resources/electron.asar/renderer/api/remote.js:261
error @ /Users/sra/workspace/lens/node_modules/electron/dist/Electron.app/Contents/Resources/electron.asar/renderer/api/remote.js:217
metaToValue @ /Users/sra/workspace/lens/node_modules/electron/dist/Electron.app/Contents/Resources/electron.asar/renderer/api/remote.js:222
(anonymous) @ /Users/sra/workspace/lens/node_modules/electron/dist/Electron.app/Contents/Resources/electron.asar/renderer/api/remote.js:214
array @ /Users/sra/workspace/lens/node_modules/electron/dist/Electron.app/Contents/Resources/electron.asar/renderer/api/remote.js:214
metaToValue @ /Users/sra/workspace/lens/node_modules/electron/dist/Electron.app/Contents/Resources/electron.asar/renderer/api/remote.js:222
(anonymous) @ /Users/sra/workspace/lens/node_modules/electron/dist/Electron.app/Contents/Resources/electron.asar/renderer/api/remote.js:281
(anonymous) @ /Users/sra/workspace/lens/node_modules/electron/dist/Electron.app/Contents/Resources/electron.asar/renderer/api/remote.js:271
emit @ events.js:200
onMessage @ /Users/sra/workspace/lens/node_modules/electron/dist/Electron.app/Contents/Resources/electron.asar/renderer/init.js:42
Hi please could you test 3.6.0-beta.1. We've changed how the application handles kubeconfig files. Also dev console is visible now. To see application logs, you can start application from command line. DEBUG=true flag gives more verbose logging.
 nevalla
on 28 Aug 2020
nevalla
on 28 Aug 2020
I'm getting the same thing. Started lens, selected a cluster, nothing appears on the main pane.
Starting kontena-lens from the terminal lets me see the logs:
info: [CLUSTER]: refresh {"id":"0c7da5ae-3532-496b-8a96-13a2c7942d75","name":"<<<some-cluster-name>>>","initialized":true}
error: Local kubectl failed to run properly (Command failed: "/home/martin/snap/kontena-lens/119/.config/Lens/binaries/1.15.11/kubectl" version --client=true -o json
/bin/sh: 1: /home/martin/snap/kontena-lens/119/.config/Lens/binaries/1.15.11/kubectl: Permission denied
), unlinking
info: Downloading kubectl 1.15.11 from https://storage.googleapis.com/kubernetes-release/release/v1.15.11/bin/linux/amd64/kubectl to /home/martin/snap/kontena-lens/119/.config/Lens/binaries/1.15.11/kubectl
info: [CLUSTER]: refresh {"id":"0c7da5ae-3532-496b-8a96-13a2c7942d75","name":"some-cluster-name","initialized":true,"online":true,"accessible":true}
error: Failed to get a lock for 1.15.11
error: Lock file is already being held {"code":"ELOCKED","file":"/home/martin/snap/kontena-lens/119/.config/Lens/binaries/1.15.11"}
warn: PrometheusLens: failed to list services: services "prometheus" not found
I'm getting the same for both a local cluster and one on GKE (in fact, all clusters. The app just isn't working any more)
 MFAshby
on 18 Sep 2020
MFAshby
on 18 Sep 2020
Looks like it might be some problem with file system permissions, which I guess is controlled by the snap packaging?
MFAshby
on 18 Sep 2020
After a few minutes the problem went away... was it downloading something in the background?
info: Downloading kubectl 1.15.11 from https://storage.googleapis.com/kubernetes-release/release/v1.15.11/bin/linux/amd64/kubectl to /home/martin/snap/kontena-lens/119/.config/Lens/binaries/1.15.11/kubectl
Should it display something in the user interface to indicate this is happening?
MFAshby
on 18 Sep 2020
In a result, I've switched to k9s - https://k9scli.io
The best dashboard for kubernetes so far. Everything works right from the box. And yes, in my case, it is a great indicator, because our clusters are using more strict authz mechanism.
ghaiklor-wix
on 21 Sep 2020
After a few minutes the problem went away... was it downloading something in the background?
info: Downloading kubectl 1.15.11 from https://storage.googleapis.com/kubernetes-release/release/v1.15.11/bin/linux/amd64/kubectl to /home/martin/snap/kontena-lens/119/.config/Lens/binaries/1.15.11/kubectlShould it display something in the user interface to indicate this is happening?
Yes, this is a bug. Downloading kubectl should not block dashboard opening (#933). We will fix this ASAP.
nevalla
on 21 Sep 2020
Related issues
 geruetzel
·
6Comments
geruetzel
·
6Comments
 spyro2000
·
3Comments
spyro2000
·
3Comments
 jim-docker
·
5Comments
jim-docker
·
5Comments
 guilhem
·
4Comments
guilhem
·
4Comments
 kotcev
·
3Comments
kotcev
·
3Comments
Most helpful comment
Yes, this is a bug. Downloading
kubectlshould not block dashboard opening (#933). We will fix this ASAP.