Lens: Node memory capacity incorrect on graph
Describe the bug
The value for the overall capacity of memory of all kubernetes nodes is not correct on some cases. This only applies to the graph itself, in the table below the graph, the 'Capacity' is correct.
To Reproduce
I don't know how you can reproduce the problem, I only get it on one of my 4 clusters.
Expected behavior
For lens to show the correct memory capacity graph for a kubernetes node.
Screenshots
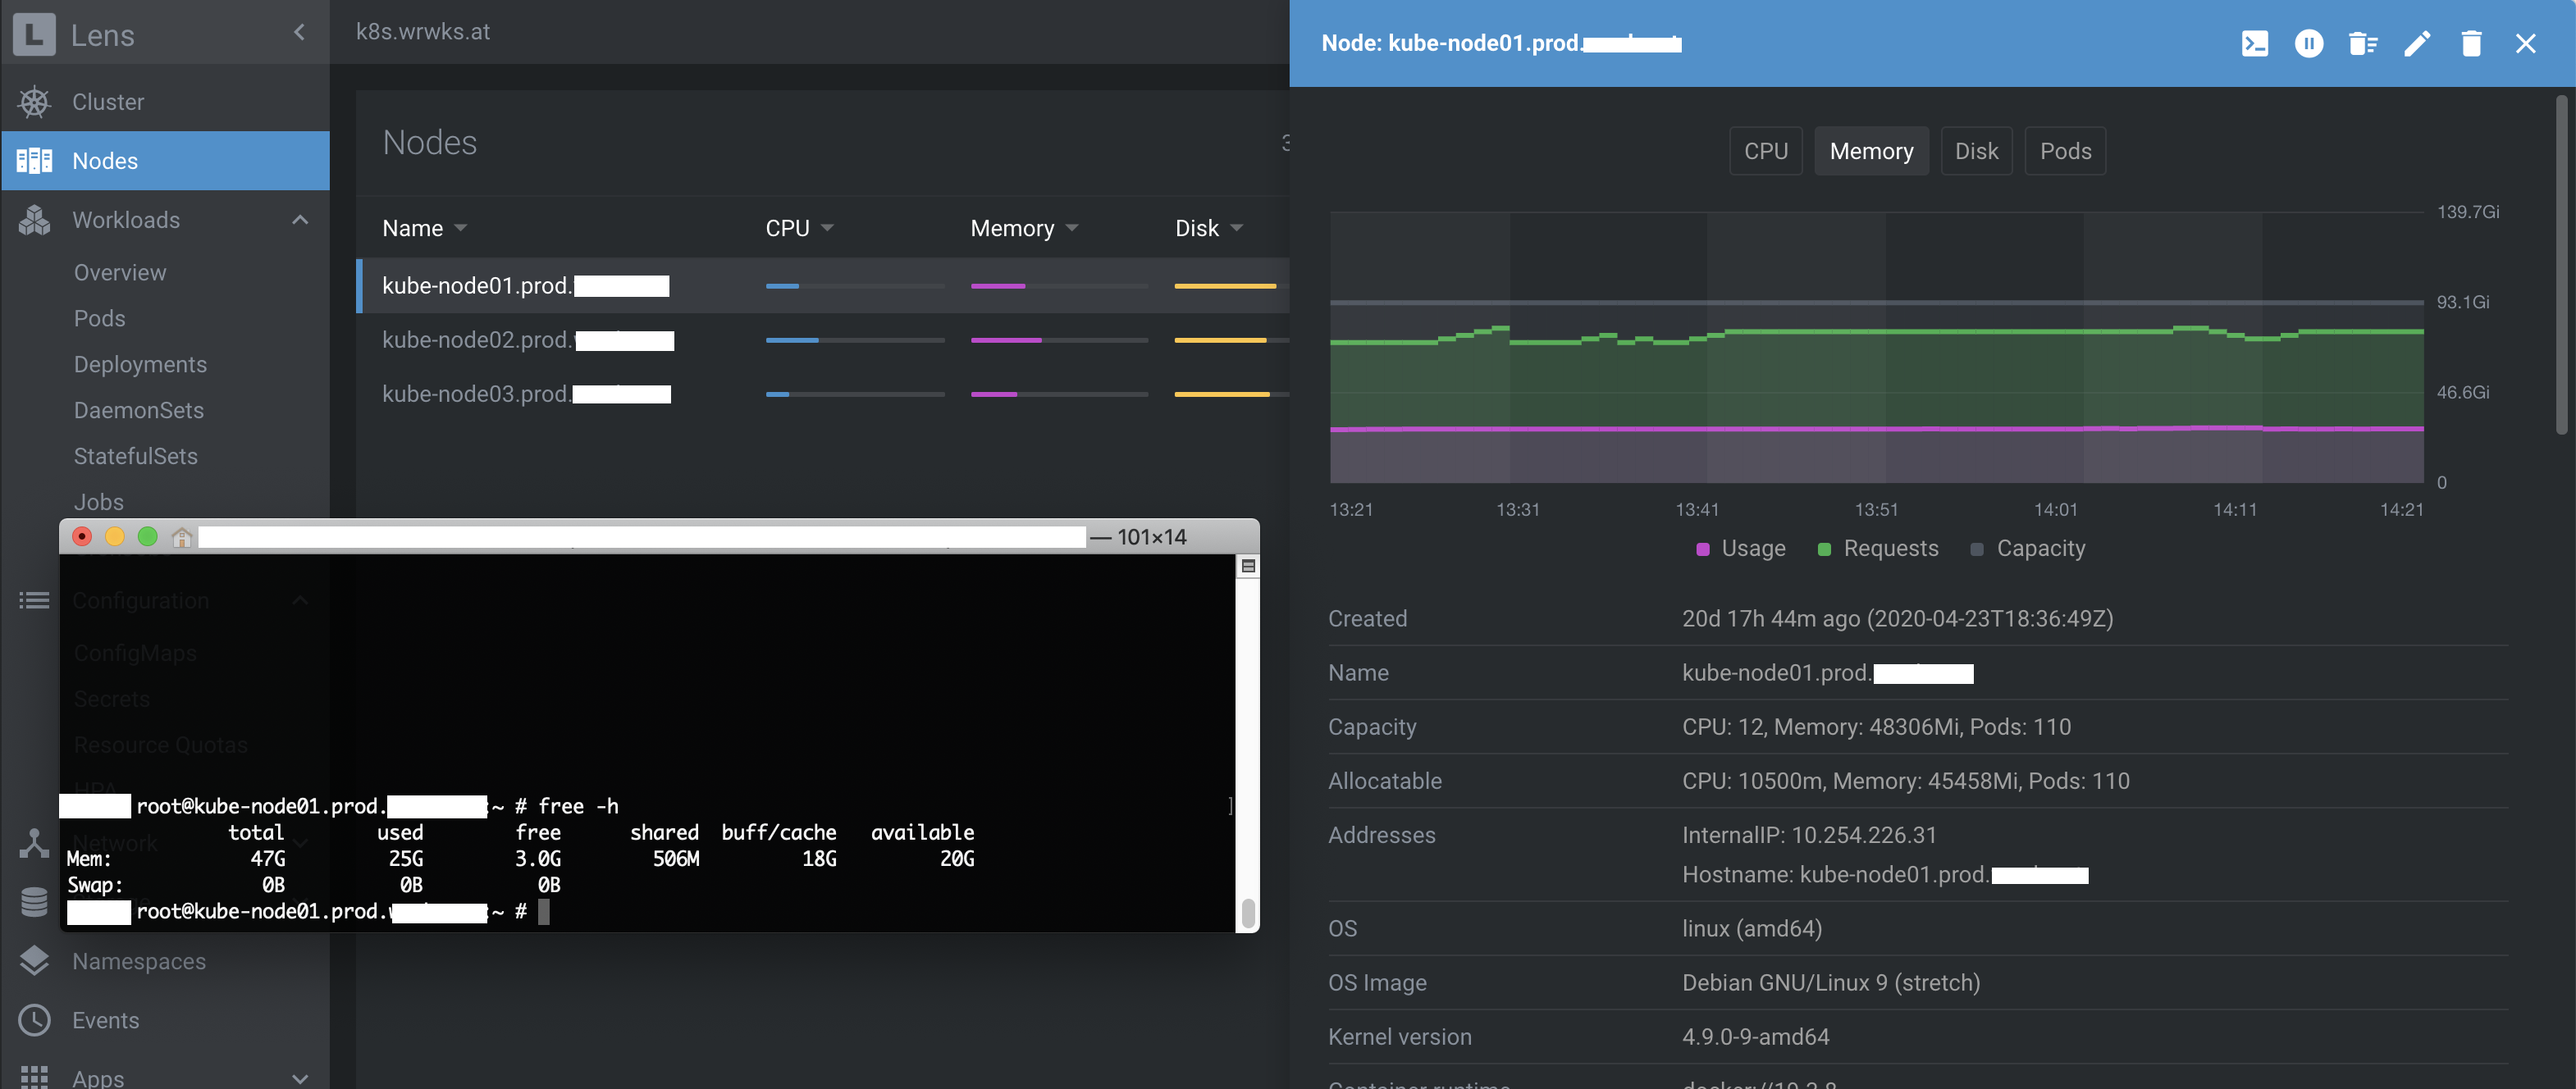
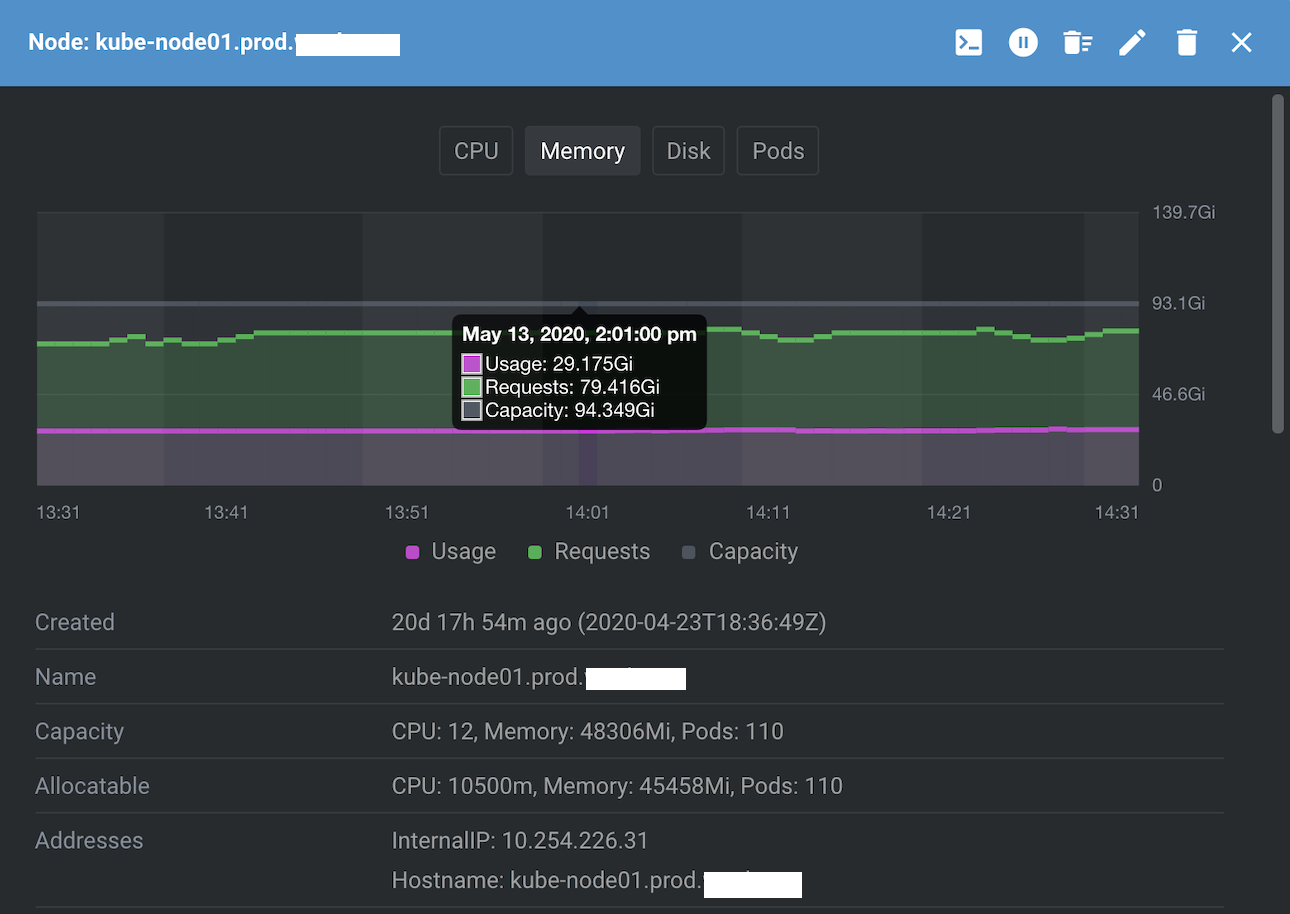
As you can see, the graph and the tooltip show about 94 GB of available memory for that node, which is wrong, as you can see in the table below the graph.
Environment (please complete the following information):
- Lens Version:
- OS: OSX
- Installation method: Image from Github
 geruetzel
All 6 comments
Same here and on the cluster View too.
Its on CPU Requests, CPU Limits and CPU Capacity, Memory Requested, Memory Limits, Memory Capacity.
It,s always factor 3, but not for CPU/Memory usage.
Environment:
OS: Windows
Version: 3.3.1/3.4.0
Cluster: Kubernetes on Azure (AKS), Version 1.5.7
Prometheus/Monitoring: fresh installed from lens (3.3.1)
 TweetyHH
on 13 May 2020
TweetyHH
on 13 May 2020
@TweetyHH yes, you are right. the capacity on cluster view is incorrect for me as well. my total available cluster resources should be
72 cpu
141 GB ram
330 Pods
but is:
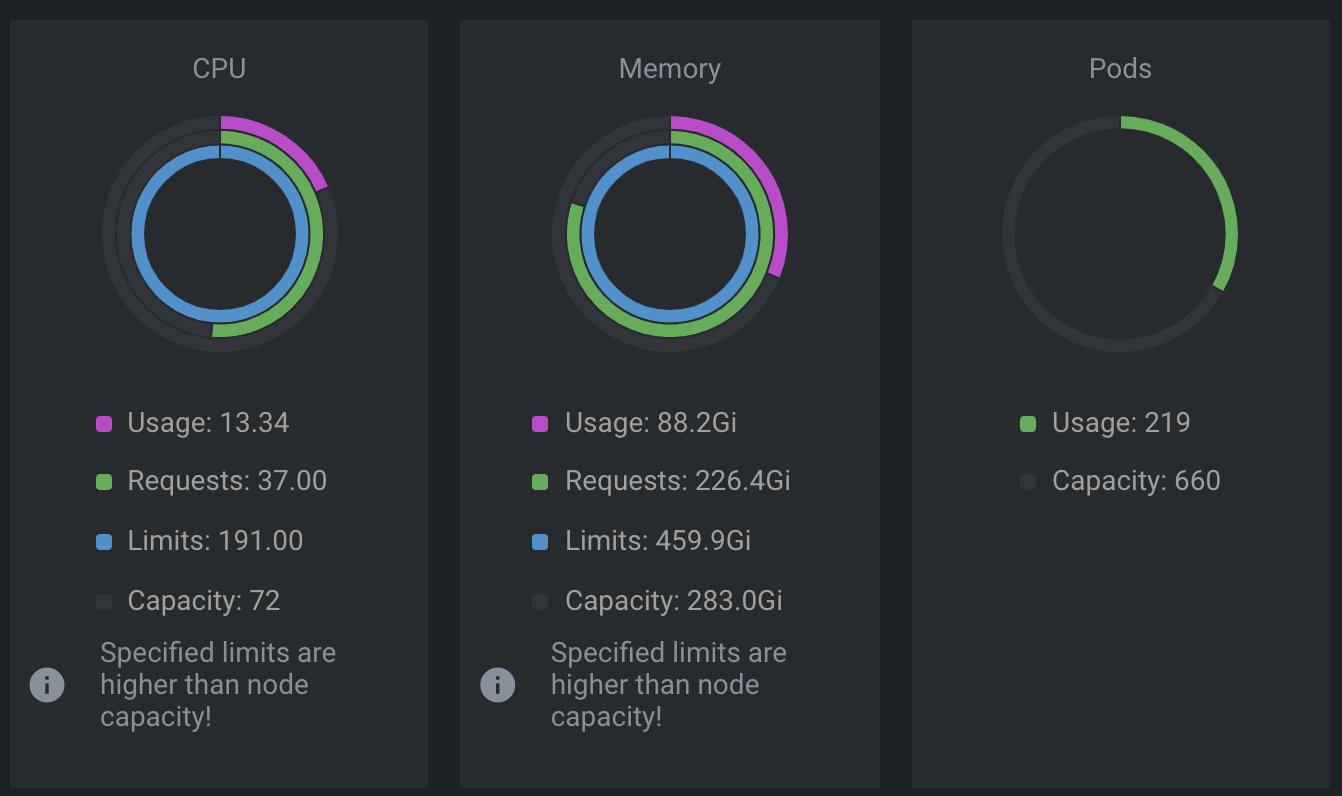
so only cpu is correct for me. ram and pods should be only a third of the given value. (i guess divided by the amount of available nodes?)
geruetzel
on 13 May 2020
@geruetzel I don't thinks its about number of the cluster nodes (worker). We have here 7 or 8 nodes. The same issue is on the diagrams of a pod.
Additional Question: Would it be possible to show the current usage of cpu/memory the pod view. On the node view is an indication of the current cpu/memory usage.
TweetyHH
on 13 May 2020
I am seeing something similar on deployment (pod) resource requests/limits; if set. It's off by a factor of 3. I see this on one of my clusters, but not the others. Lens will display a different value than what kubectl will report.
 matthewhembree
on 18 May 2020
matthewhembree
on 18 May 2020
@geruetzel @TweetyHH @matthewhembree could you check if prometheus has collected duplicate data (via Prometheus web UI or similar)?
 jakolehm
on 1 Jun 2020
jakolehm
on 1 Jun 2020
@jakolehm It looks like there is some kind of tripple data in the lens prometheus instance. In our setup we have our own prometheus/monitoring stack running, but additionally installed the lens prometheus/monitoring stack. I think they should work independently.
Here a screenshot for one node of kube_node_status_allocatable_cpu_cores

[edited better screenshot]
TweetyHH
on 1 Jun 2020
Related issues
 HristoA
·
6Comments
HristoA
·
6Comments
 adammw
·
4Comments
adammw
·
4Comments
 jtackaberry
·
6Comments
jtackaberry
·
6Comments
 ocdi
·
4Comments
ocdi
·
4Comments
 PhanSon95
·
4Comments
PhanSon95
·
4Comments