Label-studio: Time Series Improvements - Y axis Min max scaling etc
@hlomzik @deppp Great work guys! A couple of things from me: My electrical time series dataset has BIG outliers, so the tool isn't useful for me yet until the Y axis values are dynamic ( I can't actually see/label the small spikes in my data when the Y axis doesn't adjust to the min,max of the time series window - see first screenshot below). Exporting annotations - It would be super helpful if we could export as csv and it exports the raw data as a csv, with another column for the annotation (either categorical for the class or numerical e.g 0 = no category, 1 = Category A, 2 = Category B - see screenshot below). It would also be good to upload a csv with a pre-populated "annotation" column so we can use assisted annotation. Hope these functions can be incorporated in the near future! Best Regards, Sam. Images are in time_series.md merge/comments
 davodogster
All 24 comments
Thank you for your valuable response! We saved your points to our backlog.
 makseq
on 25 Nov 2020
makseq
on 25 Nov 2020
@makseq Thanks so much! When do you think you will be able to start implementing these features? Especially the y axis min/max point (the other one would be super helpful but is less essential).
EDIT: Also, are there shortcuts keys to move along the series (move the window across). I've tried control arrow keys and wasd but they don;t work. his is important if you have multiple series and you don't want to scroll down the page and manually drag the window across all the time (which is very slow) Cheers, Sam
davodogster
on 29 Nov 2020
@davodogster I think it will be in one-two months.
makseq
on 30 Nov 2020
@davodogster I think it will be in one-two months.
@makseq @hlomzik @deppp Thanks for letting me know! We were hoping the Y-axis auto adjustment would have an easy fix. Currently, it won't adjust to the min,max of the window so you can't label the data when outliers are present in the window because the signals ( / positive responses) are too small to see properly.
Cheers, Sam
davodogster
on 14 Dec 2020
Happy New Year @makseq and @hlomzik . Any time estimate on these couple of time series additional features?
Best Regards, Sam
davodogster
on 10 Jan 2021
@davodogster Thank you very much, Happy New Year too!
Right now we are working on a new data manager release (on this week). After this we will discuss this issue with our team.
makseq
on 12 Jan 2021
Hi @makseq and @hlomzik I'm still very keen to use the time series annotation tool once those two small changes are made - dynamic Y axis which auto scales the current window, and the other nice feature but not essential - to be able to upload pre-annotated data.
Do you have a time frame on either of these features? I want to use the tool to label my data for a project at work.
Best Regards,
Sam
davodogster
on 2 Feb 2021
Hi! It's glad to hear you are still keen to use LS :smiley:
We will discuss this feature on this week with our team.
makseq
on 2 Feb 2021
Hi, @davodogster! That took some time to get to TimeSeries, and I found a space for improvements and optimisation, but for this exact request I've made a solution: https://github.com/heartexlabs/label-studio-frontend/pull/168
There is fixedScale parameter, disabled by default, so now it works as you'd like — scales to fit only currently displayed values. Give it a try!
 hlomzik
on 10 Feb 2021
hlomzik
on 10 Feb 2021
@hlomzik Awesome, thank you! I'll give it a go!
davodogster
on 10 Feb 2021
@hlomzik I pip installed the latest label studio 0.9.0 and am using it in my Chrome browser on Windows. Will this new feature work in this ? I don't know how to activate it.
davodogster
on 11 Feb 2021
@davodogster sorry, but it is not yet included in 0.9 LSB. You should download the latest LS Frontend manually.
I recommend you to wait a little, the new LSF with this fix will be included into 0.9.1 release.
makseq
on 11 Feb 2021
Hi @makseq Awesome, thanks for your quick reply!, I will wait for 0.9.1, in the meantime I may try the LS Frontend if it's quick to setup. Is the upload annotations feature also available? e.g upload a time series csv with an extra column for pre-populated points/segments. Sorry - I may be asking a bit too much here! Thanks, Sam
davodogster
on 11 Feb 2021
@makseq
It won't read in my data - I'm not sure what I'm doing wrong ?
Data:
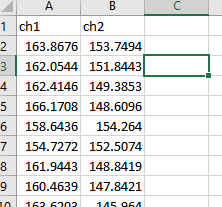
Config:
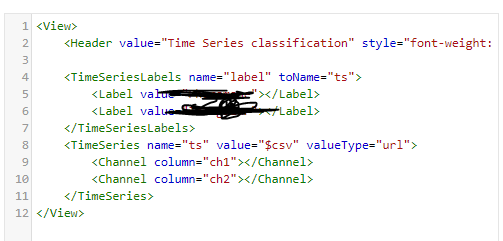
Result:
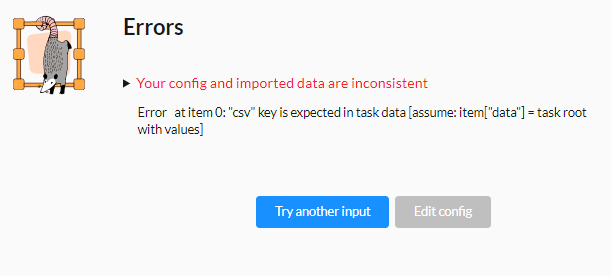
davodogster
on 12 Feb 2021
It seems you forgot to enable special checkbox about how to interpreter input file on the import step. Is it 0.9.1?
makseq
on 12 Feb 2021
@makseq I'm using 0.9.0 as 0.9.1 hasn't been released yet. I don't think there is any special checkbox
It appears that Time series no longer supports raw csv input, instead it can only be a url csv, else a Json.
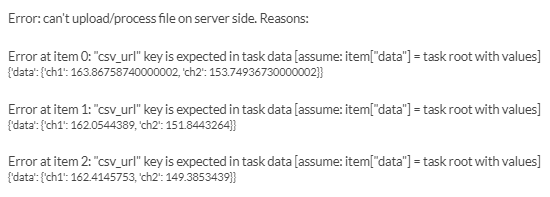
I had it working with the old config.xml format but it appears that has changed and I can't figure out the new format which is a bit frustrating
davodogster
on 12 Feb 2021
@davodogster It seems you really forget to use checkbox on import screen. Before LS 0.9.1 it was another much twisted text. And the correct import screen must look like this:
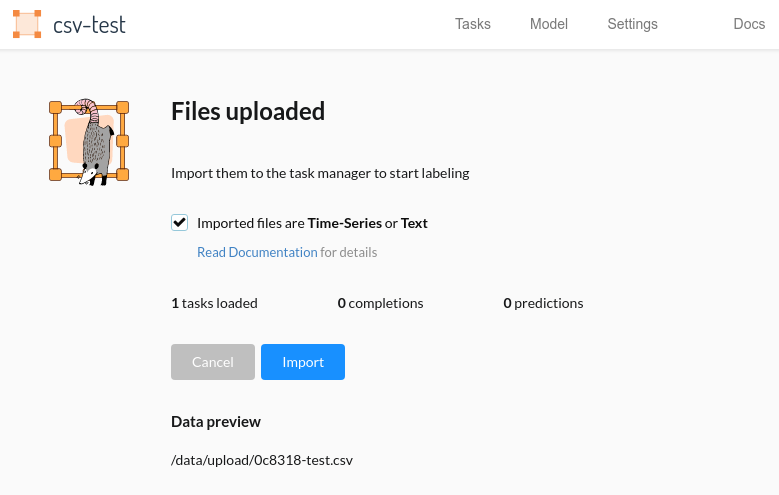
But I think there is another problem with previously created labeling config and its connection with previously imported/labeled data. Try to make the project from scratch and copy your old labeling config to the new LS project.
makseq
on 13 Feb 2021
@davodogster to use custom (or not yet included) build of labeling interface you can just replace it via simple command from our guide: https://labelstud.io/guide/frontend.html#Github-Artifacts (I think you may skip the GITHUB_TOKEN part as that repo is totally open, also you may skip <branch> param as it is already in master)
Or you can just download already built package from CI page (artifact "build label_studio/static
hlomzik
on 14 Feb 2021
about exporting labels as new column in csv — had no time for this yet, sorry. I hope, we'll investigate into this soon.
hlomzik
on 14 Feb 2021
@makseq yes it appears only the old time series config from months ago works worth 0.9.1 and the new config you guys created doesn't work. Also, there is no option to disable the fixed scale. Are you able to include that so next time I pip install I can use it.
EDIT: Awesome, I just noticed it's actually enabled by default and works well! Thank you!
davodogster
on 18 Feb 2021
@hlomzik Are you able to make it easier to upload multiple time series in one project? I can't get it to work, probably because I loaded the first one it and then edited the config file then tried to load another csv in.
This format seems to be outdated already:

My automatically generated task file looks like this format and I'm not sure how to enable multi CSV:

Cheers,
Sam
davodogster
on 18 Feb 2021
@davodogster Could you show a screenshot with an error while importing?
makseq
on 19 Feb 2021
Hi @makseq it seems to work!
My only concern now (apart from wanting to be able to export annotations as a single csv column beside the raw data .. haha) is that it might be doubling up?
For each task ID it shows both CSV's, so is it doubling up or am I doing something wrong? I don't want to annotate lots of time series and then export the annotations to find out I have done it wrong.
Here's what I did to get it working with multiple CSVs (and you still need the old config format)
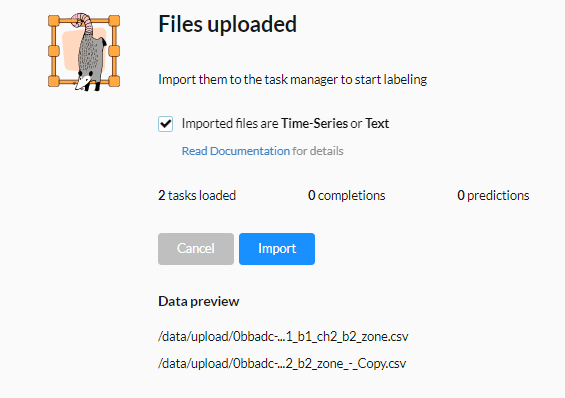
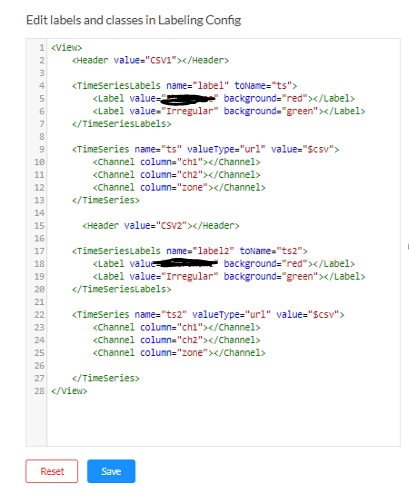
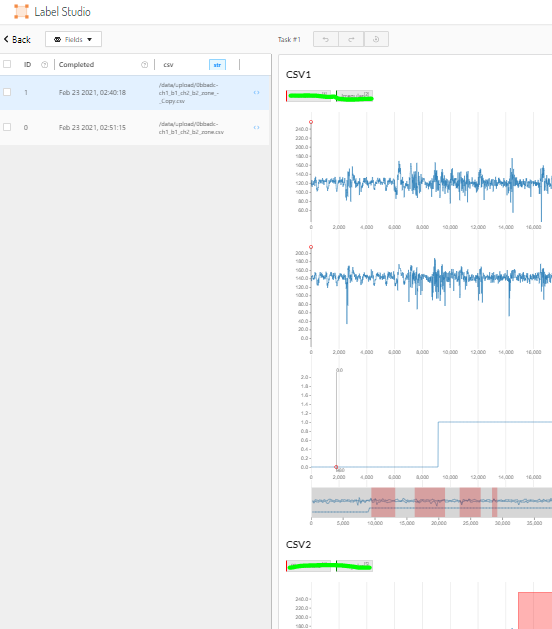
Cheers, Sam
davodogster
on 22 Feb 2021
@davodogster Hi! Yes, I think now everything must be correct. One LS task is equal to one csv file.
makseq
on 22 Feb 2021
Related issues
 cverluise
·
3Comments
makseq
·
6Comments
cverluise
·
3Comments
makseq
·
6Comments
 laynr
·
4Comments
laynr
·
4Comments
 Rishabh-hyperverge
·
6Comments
Rishabh-hyperverge
·
6Comments
 jthaloor
·
4Comments
jthaloor
·
4Comments