Kube-prometheus: High CPU throttling on kube-rbac-proxy containers with default installation
Using a reasonably small K8S cluster:
- 5 etcd nodes
- 3 master nodes
- 5 worker nodes
And deploying kube-prometheus using the jsonnet-bundler method at master, I immediately get alerts firing such as:
56% throttling of CPU in namespace monitoring for container
kube-rbac-proxy-selfin podkube-state-metrics-5bd984db7b-m66m6.
67% throttling of CPU in namespace monitoring for container
kube-rbac-proxy-mainin podkube-state-metrics-5bd984db7b-m66m6.
53% throttling of CPU in namespace runway-monitoring for container
kube-rbac-proxyin podnode-exporter-7jlrq.
The node-exporter alert is fired for all nodes (ie. all pods within the daemonset), so 13 times in my case.
Source code
The jsonnet libs in this repo have the following:
node-exporter
container.mixin.resources.withLimits({ cpu: '20m', memory: '40Mi' }) +
kube-state-metrics
container.mixin.resources.withLimits({ cpu: '20m', memory: '40Mi' });
Questions
- is this throttling alert _only_ caused by going over container cgroup limits or could this be external (ie. hypervisor side effects)
- are the containers behaving normally (ie. not doing more work than they should)
- is the
20mlimit realistic in real world scenarios? - the values are not configurable through
_config; can they be overridden nonetheless?
 bgagnon
All 36 comments
You should be able to configure it at least. See: https://github.com/kubernetes-monitoring/kubernetes-mixin/blob/master/config.libsonnet#L66
 sichvoge
on 17 Apr 2019
sichvoge
on 17 Apr 2019
I have the feeling that we increased these limits in the past, not sure what happened :eyes:
We should probably just increase the defaults on those containers, rather than patching the alert itself.
With such low limits the container is hold back from its CPU time a lot by the Linux cfs scheduler (https://en.wikipedia.org/wiki/Completely_Fair_Scheduler).
 metalmatze
on 17 Apr 2019
metalmatze
on 17 Apr 2019
All these values are just suggestions, we're unlikely to find a good default for everyone, I suggest to remove the limits from everything, look at the actual usage, and pin limits on around that + 20%.
 brancz
on 18 Apr 2019
brancz
on 18 Apr 2019
FWIW after having the same issues ended up removing the limits completely as OpenShift did: https://github.com/openshift/cluster-monitoring-operator/pull/19
 goll
on 18 Apr 2019
goll
on 18 Apr 2019
Do people feel that maybe the upstream should also disable requests/limits everywhere and have downstream handle it? Feels like an endless chase.
brancz
on 18 Apr 2019
@brancz I don't mind the curated requests and limits by the upstream projects. I find them quite useful actually, as it quickly tells me which pieces perform heavy work in a complex system.
I can setup info-level alerts for over-provisioned pods, just like I have alerts for under-provisioned pods, and over time adjust and tweak based on observed behavior.
The problem is in the lack of a _config value in the Jsonnet libs to adjust these limits. My Jsonnet knowledge is limited, but it seems like such overrides are quite cumbersome to do if there's no _config parameter for it.
bgagnon
on 18 Apr 2019
How about we add a specific section in our docs describing how to configure resources for each component?
brancz
on 18 Apr 2019
@brancz that sounds good!
bgagnon
on 24 Apr 2019
No progress on docs section?
 dimm0
on 30 Apr 2019
dimm0
on 30 Apr 2019
I don't think anyone has started this. Would you like to @dimm0 ?
brancz
on 30 Apr 2019
I can't figure out how to do it... If I can make it work, I can document what I did
dimm0
on 30 Apr 2019
https://gitlab.nautilus.optiputer.net/prp/monitoring here's my CI generating everything. I just switched to new repo, still don't see those configs anywhere. Do they go somewhere here https://gitlab.nautilus.optiputer.net/prp/monitoring/blob/master/monitoring/rules.jsonnet#L11 ?
dimm0
on 30 Apr 2019
They don't exist in the _config object. You need to apply jsonnet patches to set the resources.
brancz
on 30 Apr 2019
https://github.com/coreos/prometheus-operator/pull/2560/files how about this stuff? Where do these config params go?
dimm0
on 30 Apr 2019
Those are flags on the prometheus-operator, you'll need to modify the flags through jsonnet to set those.
brancz
on 30 Apr 2019
I'm getting this too for an out of the box baremetal kubespray cluster with kube-promtetheus. I'm relatively new to the kubernetes world, and struggling to get my head around what these limits mean.
An example node-exporter which is hitting this shows in grafana as follows:

But I'm struggling to understand what this means if I look at the source of the alert the graph looks like this:
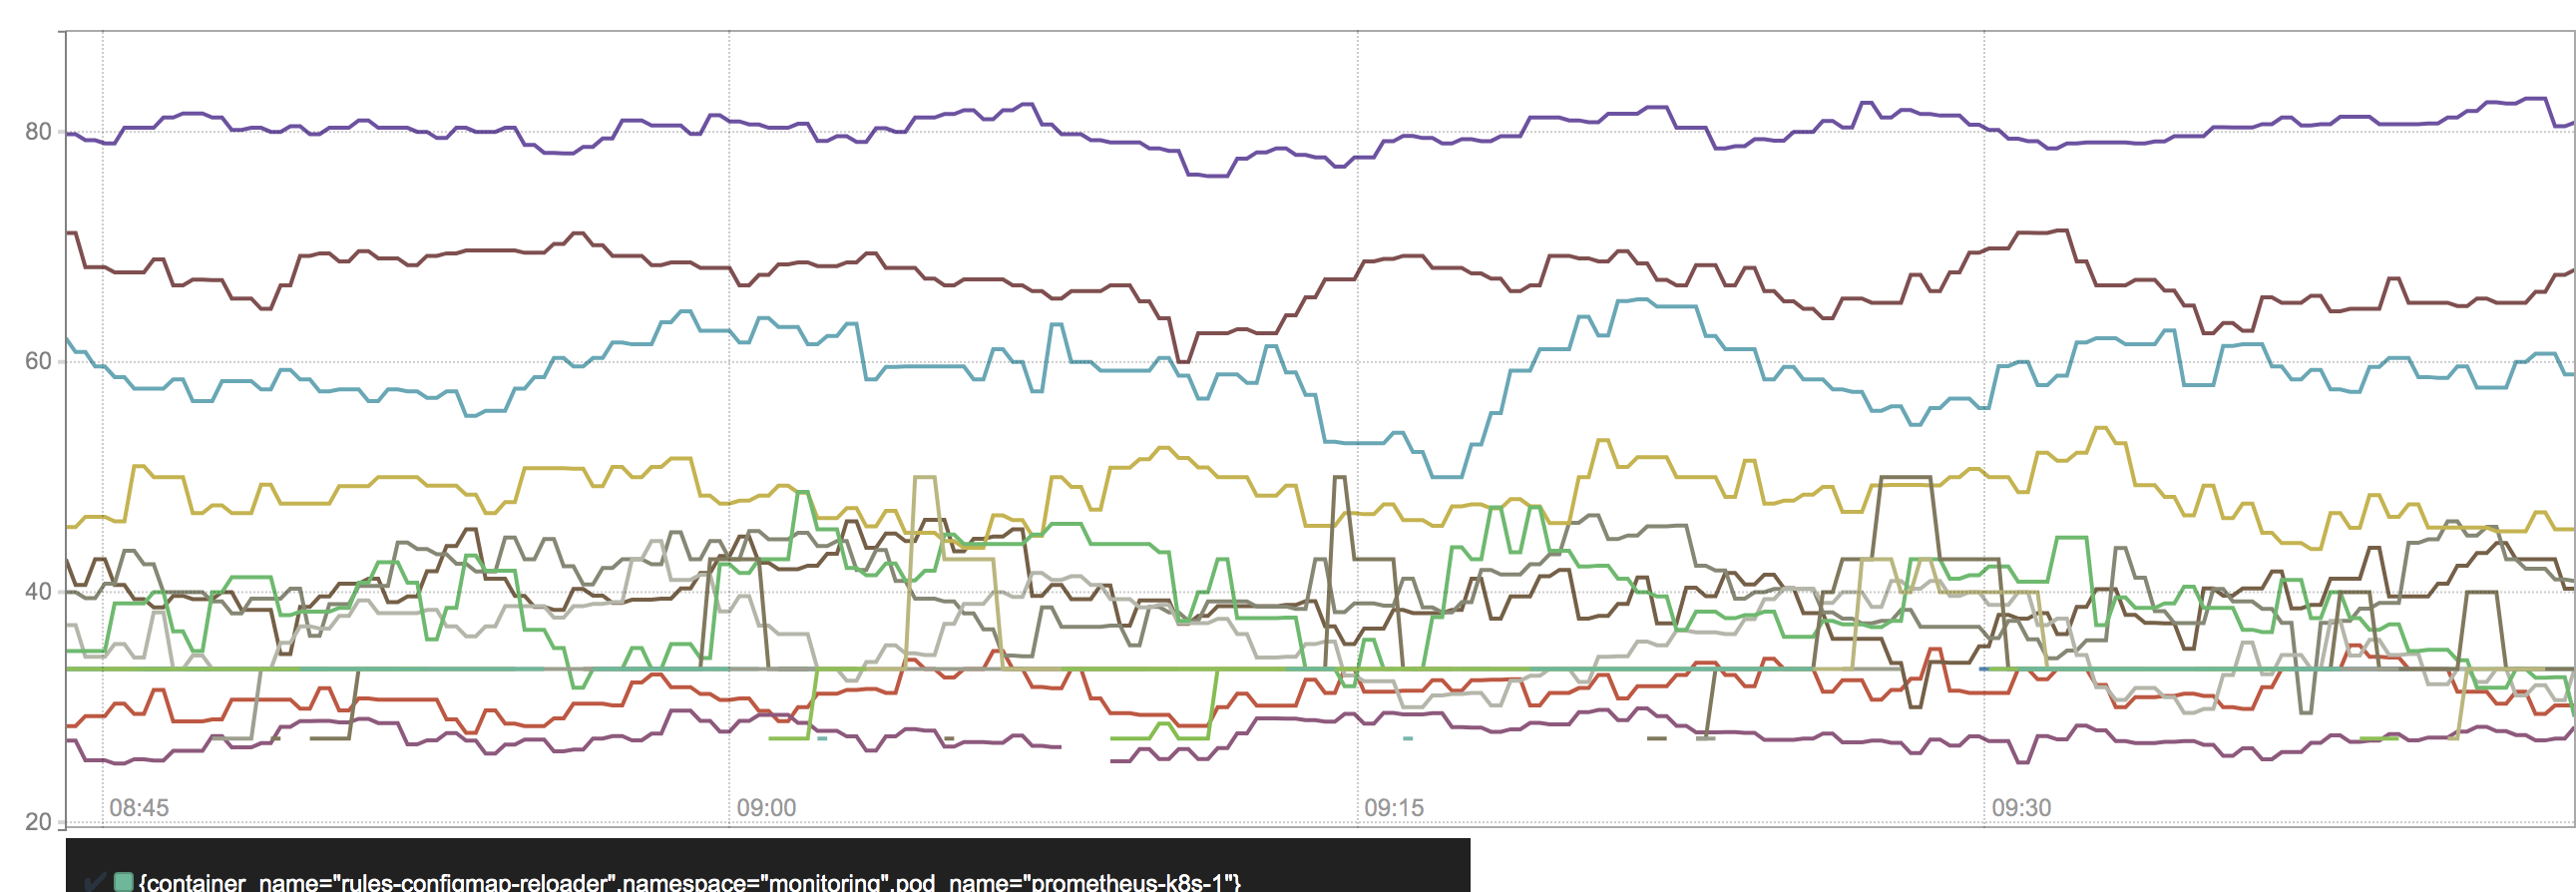
I could probably easily change the configuration ( at least for the node-export.libsonnet ) by adding params to config like this?
nodeExporter+:: {
port: 9100,
requestsCpuLimit: '102m',
requestsMemoryLimit: '180Mi',
cpuLimit: '250m',
memoryLimit: '180Mi',
},
And changing the mixins to
container.mixin.resources.withRequests({ cpu: $._config.nodeExporter.requestsCpuLimit, memory: $._config.nodeExporter.requestsMemoryLimit }) +
container.mixin.resources.withLimits({ cpu: $._config.nodeExporter.cpuLimit, memory: $._config.nodeExporter.memoryLimit });
but I'm still a bit unclear as to how to interpret the graphs and values.
Help appreciated :)
 Alan01252
on 2 May 2019
Alan01252
on 2 May 2019
The topmost line for example means that your process is getting CPU throttled 80% of the time, which is very high, and very likely a cause of very awkward problems.
brancz
on 2 May 2019
Interesting, so any idea why the current cpu limits were picked? Does the patch look acceptable? I can then tweak the CPU allowed for the node exporters which hopefully will fix these alerts :)
Alan01252
on 2 May 2019
The defaults were chosen based on usage when we first introduced these components, so it could very well be that they are not really applicable anymore. For what it's worth, we remove all limits in our setup, and only work with requests.
brancz
on 2 May 2019
That's very much appreciated. I am wondering how these are getting hit, the graphs and the alerts aren't making much sense to me but it's entirely possible that's due to my lack of understanding ;)
As example, that pod that's ( still ) reporting 85% throttling shows when viewing pods in grafana as nowhere near the requests/limits
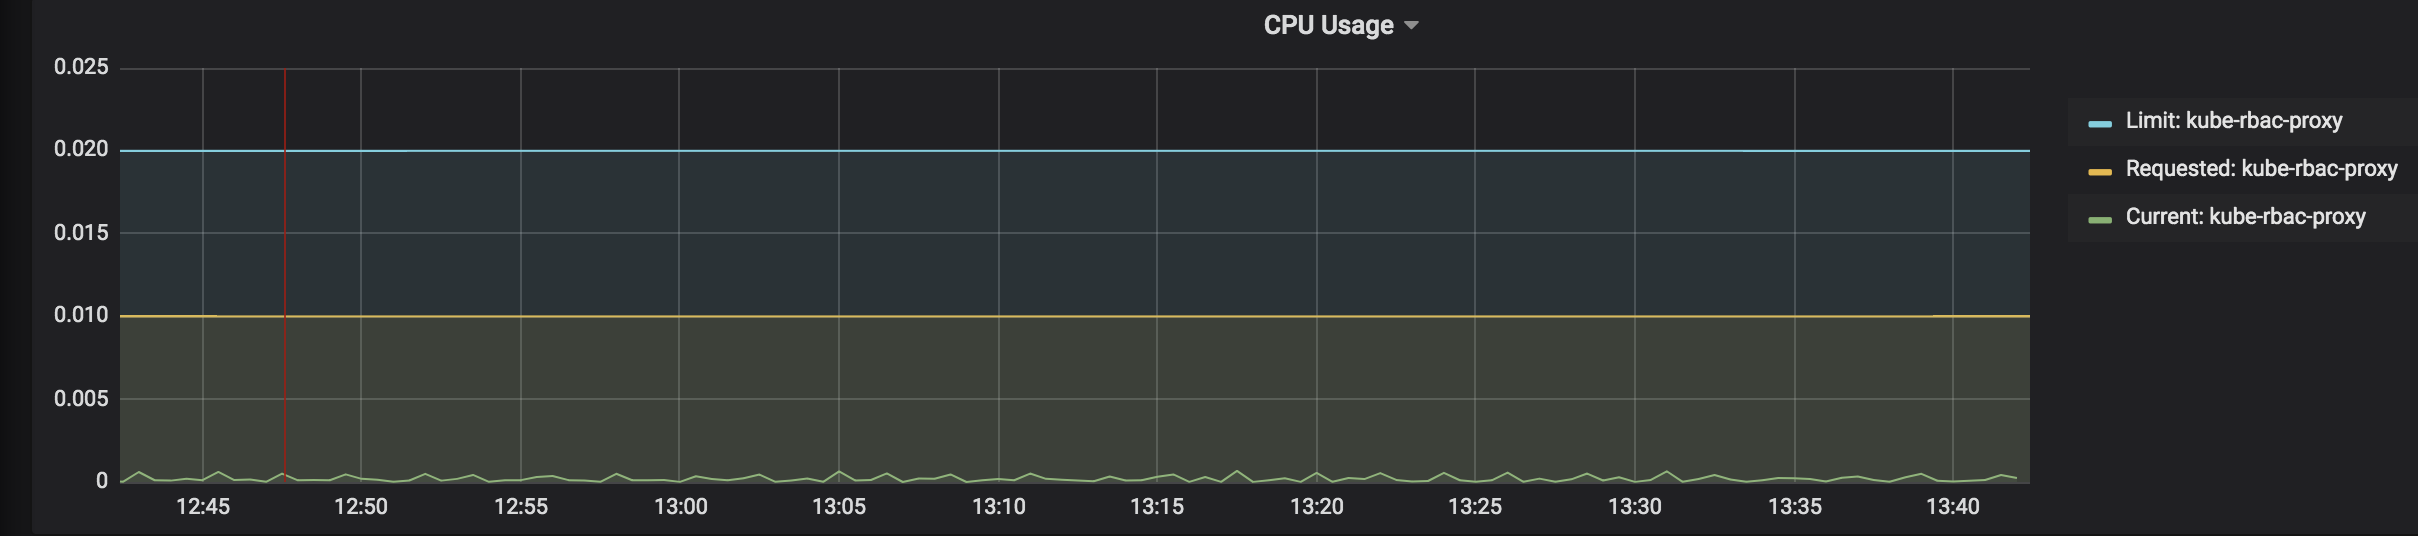
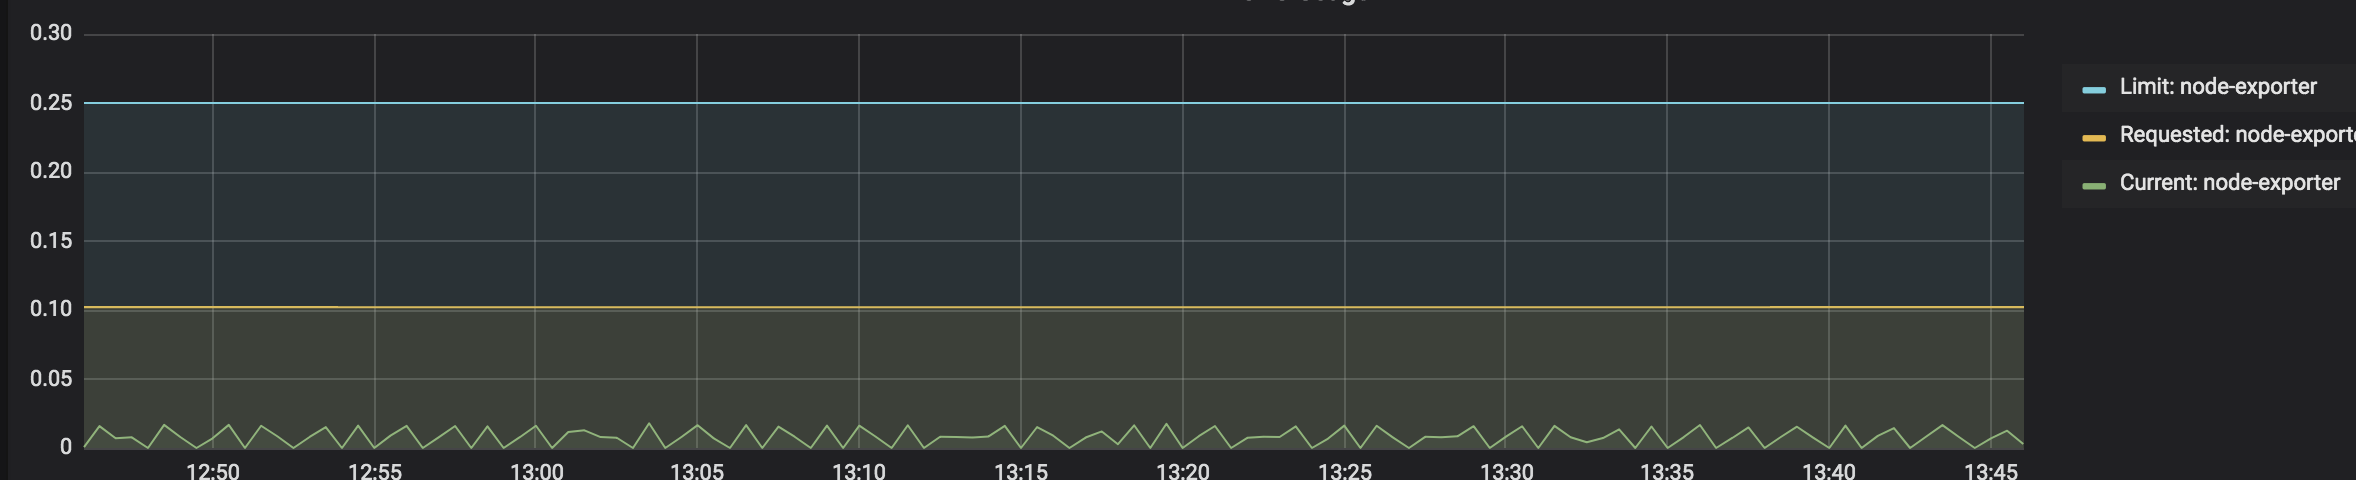
So I think I'm miss understanding exactly what the alert is trying to tell me?
Alan01252
on 2 May 2019
It might be related to https://github.com/kubernetes/kubernetes/issues/67577
brancz
on 2 May 2019
This does appear to be exactly what's happening :) Thank you for all your help. Very much appreciated.
Alan01252
on 2 May 2019
Here's my attempt at stripping limits from the problematic containers:
local stripLimits(podSpec, containerName) = podSpec + {
local containers = podSpec.containers,
local rbacProxyCtnr = std.filter(function(c) c.name == containerName, containers)[0] + {
resources+: {
limits: {},
},
},
local otherCtnrs = std.filter(function(c) c.name != containerName, containers),
containers: otherCtnrs + [rbacProxyCtnr],
};
// Strip spec.containers[].limits for certain containers
// https://github.com/coreos/kube-prometheus/issues/72
local kp = _kp + {
nodeExporter+: {
daemonset+: {
spec+: {
template+: {
spec:
stripLimits(
stripLimits(_kp.nodeExporter.daemonset.spec.template.spec,
'node-exporter'),
'kube-rbac-proxy'),
},
},
},
},
kubeStateMetrics+: {
deployment+: {
spec+: {
template+: {
spec:
stripLimits(
stripLimits(
stripLimits(_kp.kubeStateMetrics.deployment.spec.template.spec,
'kube-rbac-proxy-main'),
'kube-rbac-proxy-self'),
'addon-resizer'),
},
},
},
},
};
I am very much a novice at Jsonnet and this weird recursive function is the best I could come up with. Any improvement tips appreciated!
bgagnon
on 22 May 2019
@brancz seems like I would also need to use the new config-reloader-cpu flag on prometheus-operator introduced in coreos/prometheus-operator@0e403effb060368c80f5c0a16f78f1e36fcc3466
However, this is also not exposed as a _config param in kube-prometheus:
container.withArgs([
'--kubelet-service=kube-system/kubelet',
// Prometheus Operator is run with a read-only root file system. By
// default glog saves logfiles to /tmp. Make it log to stderr instead.
'--logtostderr=true',
'--config-reloader-image=' + $._config.imageRepos.configmapReloader + ':' + $._config.versions.configmapReloader,
'--prometheus-config-reloader=' + $._config.imageRepos.prometheusConfigReloader + ':' + $._config.versions.prometheusConfigReloader,
]) +
Therefore, an extra arg would need to be injected... I'll try doing that.
bgagnon
on 22 May 2019
Here's my patch for the --config-reloader-cpu=0 flag on prometheus-operator Deployment:
prometheusOperator+: {
deployment+: {
spec+: {
template+: {
spec+: {
containers: [
_kp.prometheusOperator.deployment.spec.template.spec.containers[0] + {
args+: [
'--config-reloader-cpu=0'
],
}
],
},
},
},
},
},
Is there a reason not to change the checked in code in the kube-prometheus repo to either
- increase the limits to a reasonable value
or - plumb through a
_configsetting for the various resource limits
or - remove the limits entirely
Having to manually hack the generated manifests is a pain, and the lack of a _config setting means either jsonnet gyrations or having to fork the kube-prometheus project.
 llamahunter
on 15 Jun 2019
llamahunter
on 15 Jun 2019
I’m perfectly happy with having a jsonnet patch that after the fact allows setting the values to any value users want. Having this in the config is just not very idiomatic jsonnet.
brancz
on 17 Jun 2019
Ok, what would be a non ugly “idiomatic” jsonnet patch?
llamahunter
on 17 Jun 2019
Something like what @bgagnon shared but parameterized through function parameters, probably one function for each component, but I’d also be ok with an additional one that configures all at once.
brancz
on 17 Jun 2019
I tried doing something like that, but due to the late binding nature of jsonnet, it kept getting into a recursive lookup loop and had stack overflows trying to patch existing output. Can you provide a working example?
llamahunter
on 17 Jun 2019
So far all patches I could come up with were replicating a large pieces of current code, which were 1. ugly 2. required changing the patch once the original code changes. I haven't found a way to patch the existing generated structures by only injecting the values (probably my lack of jsonnet experience).
dimm0
on 17 Jun 2019
Here's my revised self-contained Jsonnet patch. It can be imported at the top level with a single import 'strip-cpu-limits.jsonnet'.
@brancz what do you think, would this be good enough for a pull request?
// Strips spec.containers[].limits for certain containers
// https://github.com/coreos/kube-prometheus/issues/72
local k = import 'ksonnet/ksonnet.beta.4/k.libsonnet';
{
  nodeExporter+: {
    daemonset+: {
      spec+: {
        template+: {
          spec+: {
            local stripLimits(c) =
                if std.count([
                    'node-exporter',
                    'kube-rbac-proxy'
                ], c.name) > 0
                then c + {resources+: {limits: {}}}
                else c,
            containers: std.map(stripLimits, super.containers),
          },
        },
      },
    },
  },
  prometheusOperator+: {
    deployment+: {
      spec+: {
        template+: {
          spec+: {
            local addArgs(c) =
                if c.name == 'prometheus-operator'
                then c + {args+: ['--config-reloader-cpu=0']}
                else c,
            containers: std.map(addArgs, super.containers),
          },
        },
      },
    },
  },
  kubeStateMetrics+: {
    deployment+: {
      spec+: {
        template+: {
          spec+: {
            local stripLimits(c) =
                if std.count([
                    'kube-rbac-proxy-main',
                    'kube-rbac-proxy-self',
                    'addon-resizer'
                ], c.name) > 0
                then c + {resources+: {limits: {}}}
                else c,
            containers: std.map(stripLimits, super.containers),
          },
        },
      },
    },
  },
}
The key to getting a "clean" patch was the use of super.containers, which solves the recursive issue that @llamahunter was experiencing.
bgagnon
on 17 Jun 2019
Ahhh... super.containers is the trick! I had a very similar std.map() based implementation, except I used std.setMember() instead of std.count().
llamahunter
on 18 Jun 2019
Yes, I'd be happy to see something like that. As @llamahunter mentioned, std.setMember would be a better fit, but I'm happy to discuss on the PR :)
brancz
on 20 Jun 2019
@bgagnon may you raise a PR with your change? I'm having the issue
 dnascimento
on 24 Jun 2019
dnascimento
on 24 Jun 2019
The limits on kube-state-metrics containers does effect the prometheus scrape duration.
Per our test with 200 nodes, 8000 pods cluster months ago, the kube-state-metrics scrape duration increase to ~ 40 seconds.
After removing the limits , the kube-state-metrics scrape duration decreased to 1 ~ 2 seconds as I can remember.
kube-state-metrics version is 1.5+
Thanks for the PR
Ben
 benjaminhuo
on 29 Sep 2019
benjaminhuo
on 29 Sep 2019
Related issues
 RiRa12621
·
6Comments
RiRa12621
·
6Comments
 lilic
·
7Comments
lilic
·
7Comments
 rupadhya1
·
3Comments
rupadhya1
·
3Comments
 steinybot
·
3Comments
steinybot
·
3Comments
 Aracki
·
6Comments
Aracki
·
6Comments
Most helpful comment
Here's my revised self-contained Jsonnet patch. It can be imported at the top level with a single
import 'strip-cpu-limits.jsonnet'.@brancz what do you think, would this be good enough for a pull request?
The key to getting a "clean" patch was the use of
super.containers, which solves the recursive issue that @llamahunter was experiencing.