Kibana: [Bug][User Experience] Enhance the Page Load Duration metrics shown
Some of the metric labels are causing confusion, in that they are not all obvious in what they represent
- [x] Add a new column in the
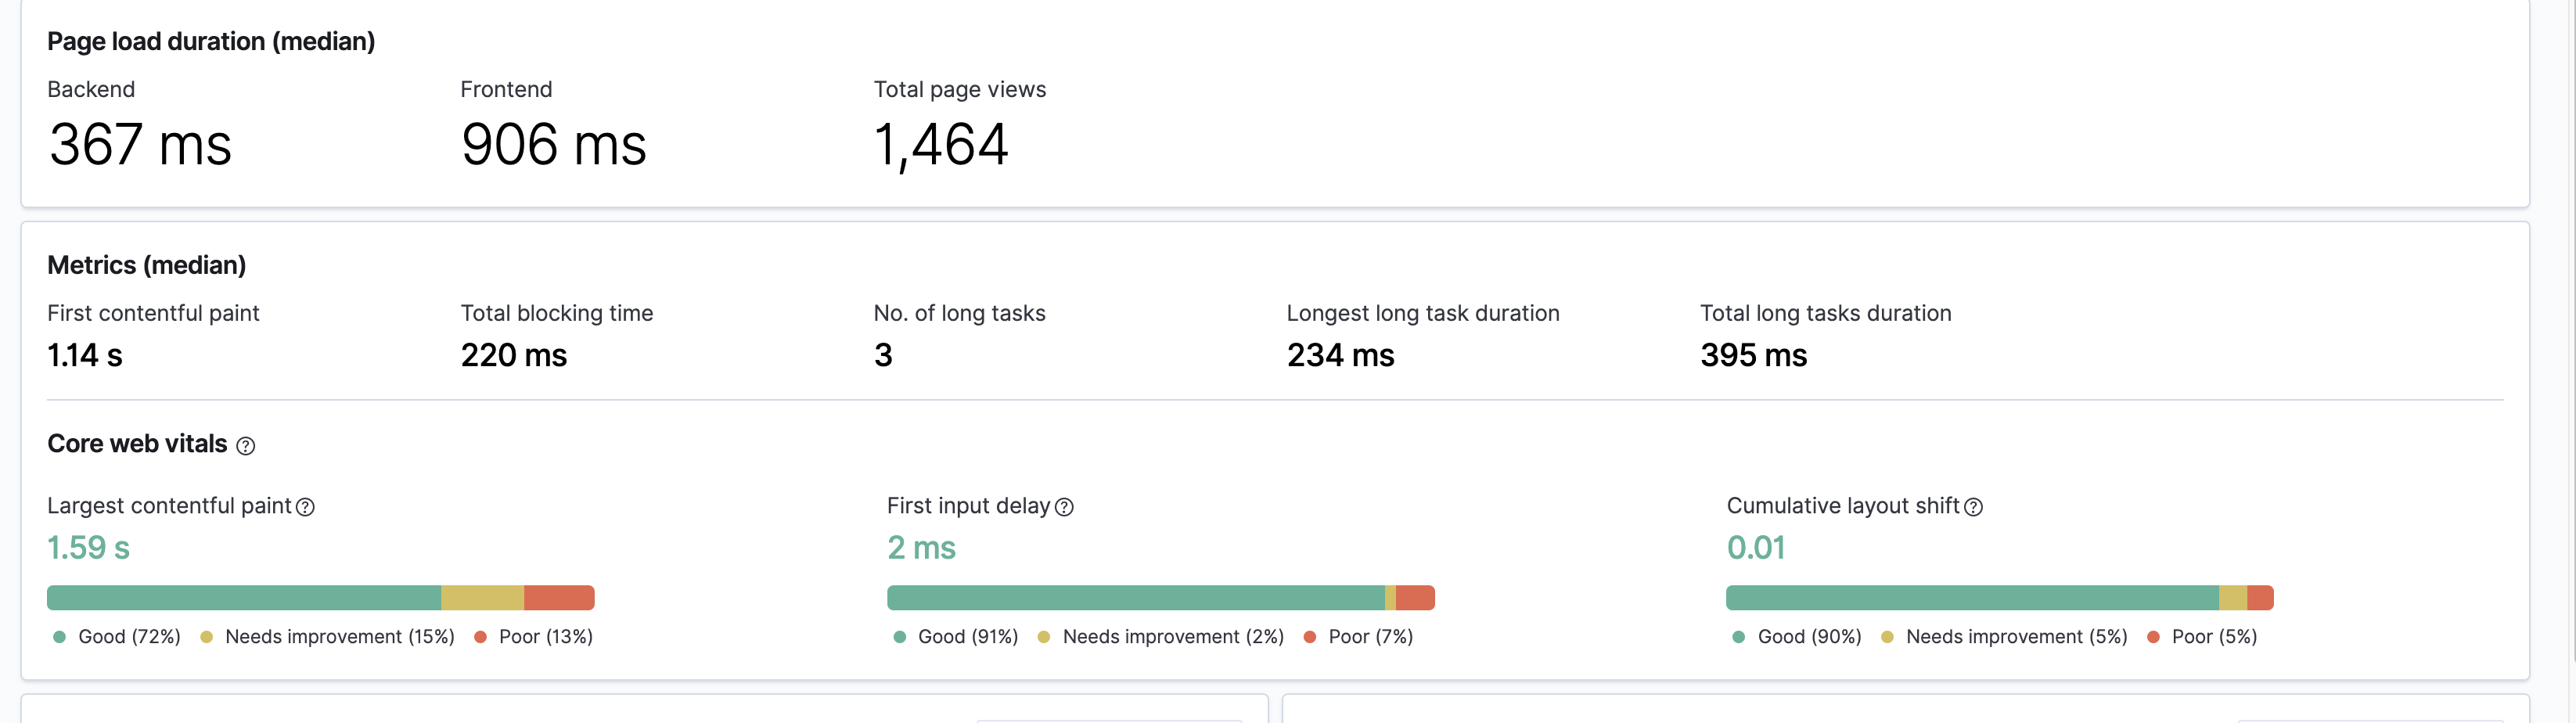
Page load durationsection, to the left of the currentBackendvalue calledTotal - [x] The value shown here will be the (percentile) total page load duration, the same as what is used to populate the
Page load distributionchart(transaction.duration.us) - [x] Change the current
Frontendvalue to represent thetotal page load duration - backend(such that addingFrontendandBackendwill be the same as theTotalvalue) - [x] Add a (?) help mouseover on the
Totallabel with the contentTotal represents the full page load duration - [x] Add a (?) help mouseover on the
Frontendlabel with the contentFrontend time represents the total page duration minus the backend time - [x] Add a (?) help mouseover on the
Backendlabel with the contentBackend time represents time to first byte (TTFB), which is when the first response packet is received after the request has been made - [x] Change the heading
Page load durationtoPage load
cc @formgeist
 paulb-elastic
All 13 comments
Pinging @elastic/uptime (Team:uptime)
 elasticmachine
on 26 Oct 2020
elasticmachine
on 26 Oct 2020
for ? clarification, we should add this to all three, total, frontend, backend, like you said in your original comment @paulb-elastic
Backend time represents time to first byte (TTFB), which is when the first response packet is received after the request has been made
Frontend time represents the time from the first response to time to interactive (TTI))
 shahzad31
on 26 Oct 2020
shahzad31
on 26 Oct 2020
@shahzad31 we are going to change the meaning of frontend here though, so TTI won't be involved anymore. I've added an item to the list to add your backend description though.
Should we add a description against Total? As this isn't onload, what's the point at which we're evaluating when the page is done (cc @vigneshshanmugam / @jahtalab)?
paulb-elastic
on 26 Oct 2020
we can call Total as the total time representing the duration of page load transaction. If we dont want users to know what transaction is, then we can keep it simple as page load duration.
 vigneshshanmugam
on 26 Oct 2020
vigneshshanmugam
on 26 Oct 2020
@drewpost can you confirm you are happy with the three descriptions written in the main issue please?
paulb-elastic
on 27 Oct 2020
IMO, we should rename the Page load duration section to just Page load (or Page completion to avoid confusion with load event). This section will have the three columns: Total (or Total duration), Backend, Frontend
Note: Page completion is a concept defined by the RUM agent as described in our docs (therefore it doesn't necessarily align with onload event )
 jahtalab
on 27 Oct 2020
jahtalab
on 27 Oct 2020
That's a good point @jahtalab, and removes the ambiguity that duration gives.
I've added an item for it (we have page views in there too, which is definitely nothing to do with duration, but has a bearing on pages loaded).
paulb-elastic
on 27 Oct 2020
@paulb-elastic OK by me. Ship it.
 drewpost
on 27 Oct 2020
drewpost
on 27 Oct 2020
@paulb-elastic @drewpost @Kerry350 i know it's expanding the scope, but since we are adding tooltips for backend/frontend, does it also make sense for TBT, FCP, Long task etc?
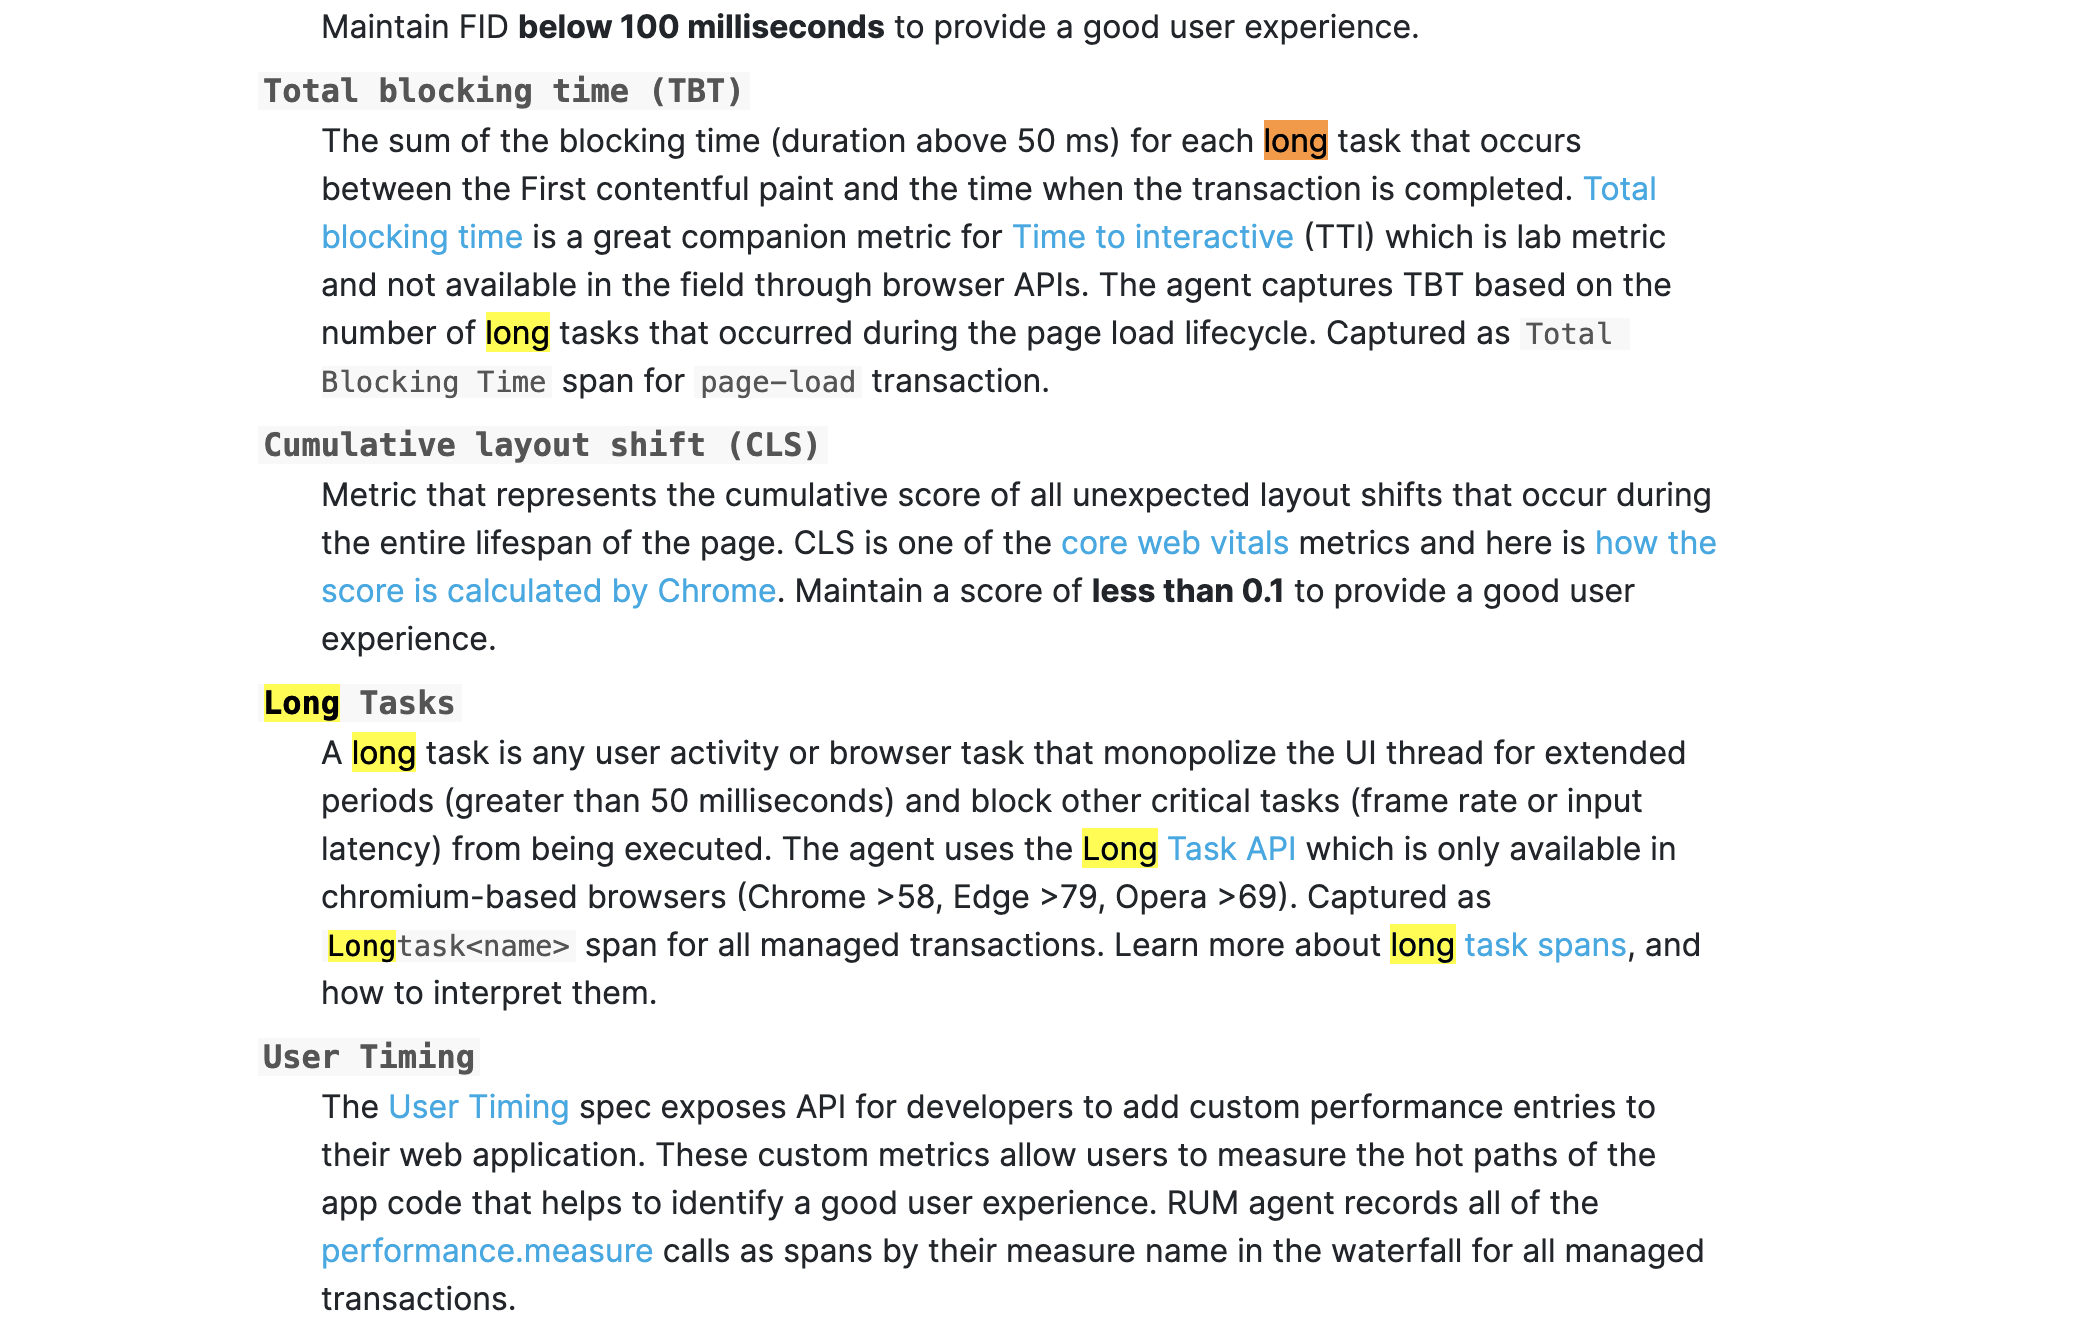
Those will be the only remaining part, where we don't have helper tooltips
shahzad31
on 28 Oct 2020
@shahzad31 Makes sense to me.
 Kerry350
on 28 Oct 2020
Kerry350
on 28 Oct 2020
You can pick up the copies from https://www.elastic.co/guide/en/apm/agent/rum-js/5.x/supported-technologies.html#page-load-metrics
shahzad31
on 28 Oct 2020
Makes sense to me too. Thanks @shahzad31 - @Kerry350 are you implementing these for 7.10? (sorry - not sure where Shahzad is picking up and where you are yet!)
drewpost
on 29 Oct 2020
@drewpost Yeah, my understanding is this was targeted for 7.10. The PR is ready and approved: https://github.com/elastic/kibana/pull/81915, just blocked by e2e tests which aren’t working for me locally (this morning’s goal...).
Kerry350
on 29 Oct 2020
Related issues
 Ginja
·
3Comments
Ginja
·
3Comments
 stacey-gammon
·
3Comments
stacey-gammon
·
3Comments
 cafuego
·
3Comments
cafuego
·
3Comments
 ynux
·
3Comments
ynux
·
3Comments
 bradvido
·
3Comments
bradvido
·
3Comments
Most helpful comment
@paulb-elastic @drewpost @Kerry350 i know it's expanding the scope, but since we are adding tooltips for backend/frontend, does it also make sense for TBT, FCP, Long task etc?
Those will be the only remaining part, where we don't have helper tooltips