Kibana: [Logs Component] Should columns be customizable?
One of the most frequent requests we've heard when Kibana devs evaluate whether or not they want to use our shared Logs component is whether they can configure which columns show up when the component is rendered. Right now, the columns are controlled by the overall Logs App source configuration, found at /app/logs/settings :
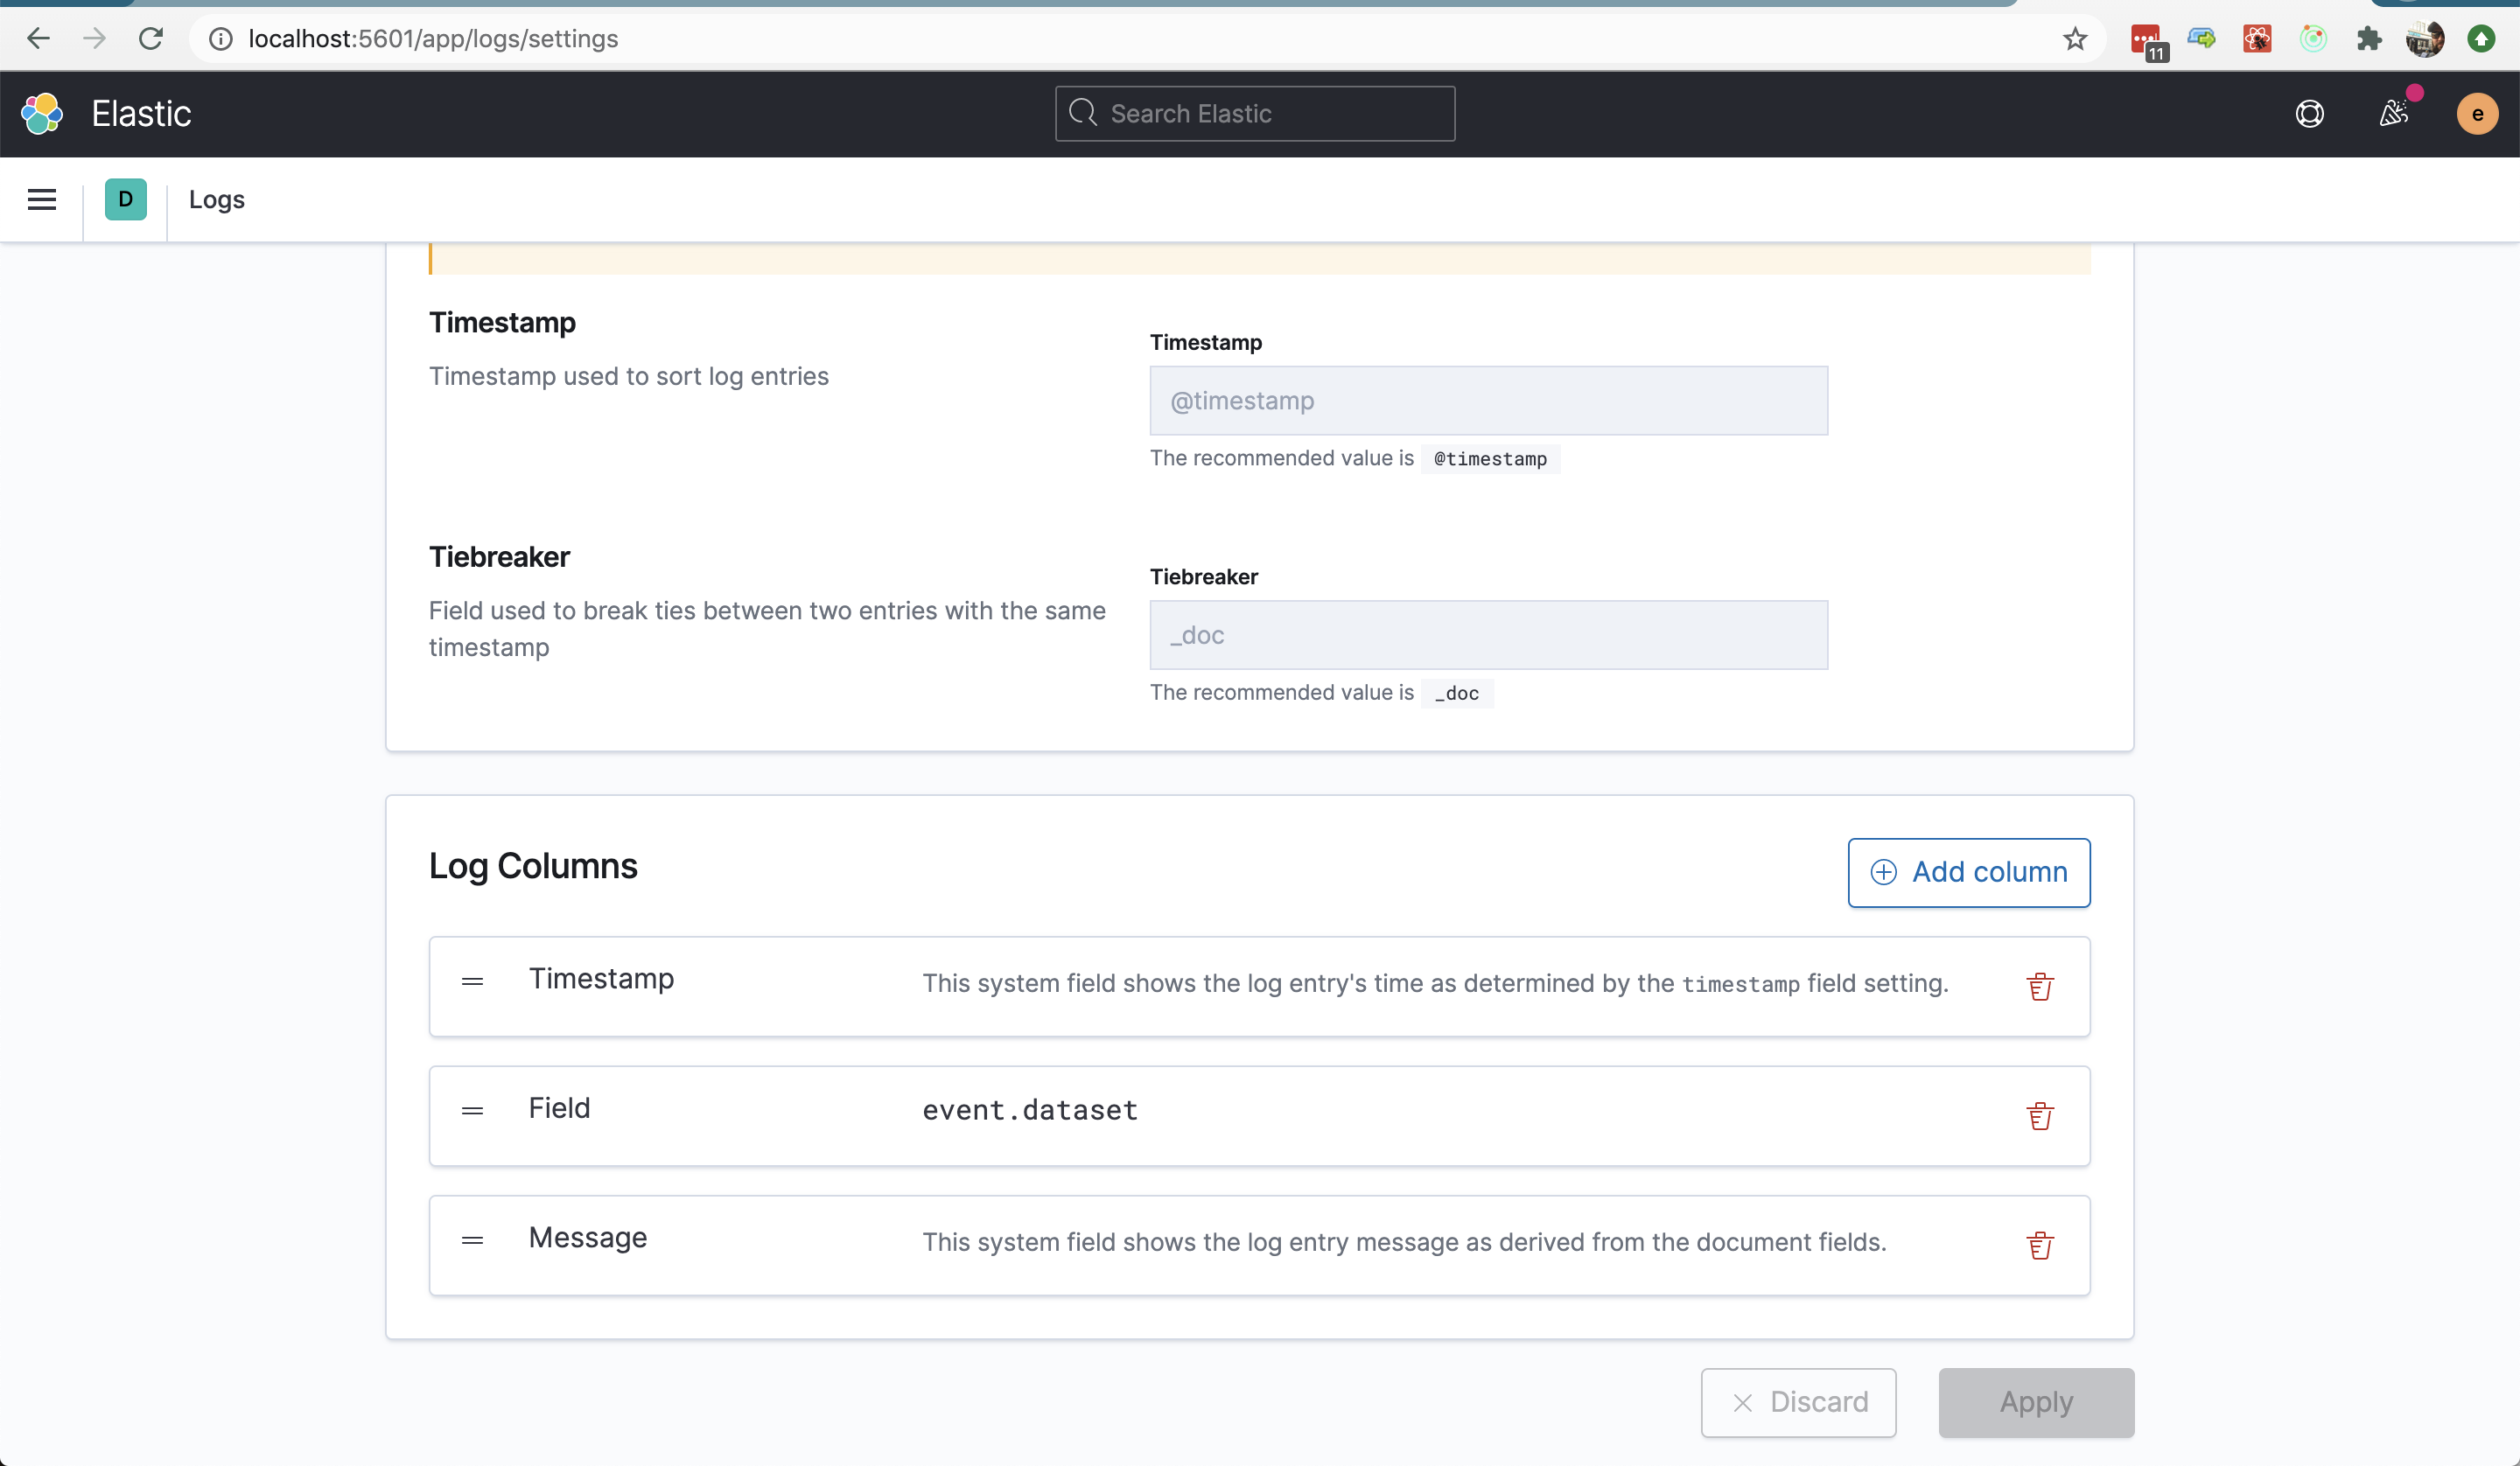
This may or may not make sense, considering the use case for each individual instance of the shared component will likely be different than the main Log Stream use case, so each one likely wants to choose its own relevant columns (although this does come with the drawback of the shared component becoming unusable for users who may have added interesting columns, etc.)
What are the other pros and cons of making the columns configurable per instance? If you would like to see these be configurable, please tell us about your use case in the comments of this issue. Thanks!
 jasonrhodes
All 7 comments
Pinging @elastic/logs-metrics-ui (Team:logs-metrics-ui)
 elasticmachine
on 15 Oct 2020
elasticmachine
on 15 Oct 2020
In Fleet UI, we want to show agent logs on an agent's detail page (#77189). This will be done by using <LogStream> to query on event.dataset: 'elastic.agent' AND elastic.agent.id: ${someAgentId}. By default, for users who have not modified their Log Column settings, a redundant event.dataset column will be shown with the same value for all the logs displayed.
It would be great for our app to be able to set fixed columns for this page, I can see this being done with a useColumns or similar prop on the component, which overrides the user's settings.
Alternatively, maybe the user column settings can be expanded to return different settings based on a set of conditions. This can be used by other plugins to register their own conditions and the default column settings for them; for example, Fleet can export some column settings when event.dataset: 'elastic.agent'. Users can then use the UI to further customize plugin defaults and add their own conditions.
The prop solution is obviously easier 😉
 jen-huang
on 15 Oct 2020
jen-huang
on 15 Oct 2020
@nehaduggal @drewpost did you see this request for information. Could you please see if the needs for APM and User Experience monitoring are captured?
 cyrille-leclerc
on 16 Oct 2020
cyrille-leclerc
on 16 Oct 2020
@katrin-freihofner - Given our desire to show relevant logs data alongside synthetic monitoring errors in the near future, do you have a perspective on this issue? re this design issue https://github.com/elastic/uptime/issues/261
cc @andrewvc @paulb-elastic
 drewpost
on 16 Oct 2020
drewpost
on 16 Oct 2020
Note: There _is_ a way for users of the Log Stream component to control the columns right now, but it requires creating a separate source configuration to use when accessing the Log Stream. @weltenwort would you mind briefly explaining that process in the comments here?
Another option to consider: referencing column names that would be irrelevant in the context of where the Log Stream instance appears. For @jen-huang's Ingest Manager example, she could list "event.dataset" as irrelevant and the render could ignore that column, since it's specifically not relevant for this view, but everything else from the user's configured source would remain. I'm not really sure if this is a good idea at all, tbh, but I thought we should at least consider it. :)
jasonrhodes
on 16 Oct 2020
The <LogStream /> component takes a sourceId property, which specifies the id of the "source configuration" to use for data fetching. A source configuration contains the information about the index name pattern to fetch data from and the columns to display in the log stream. A source configuration can come from one of the following three origins:
- default values, which is what is used in the Logs UI when no configuration has been saved for the active space
- a space-specific saved object of the type
infrastructure-ui-source - a statically defined source configuration, which can be registered at plugin
setup()
For most solution UIs the third options is probably the preferred one, since they often have a static set of indices with well-known fields. To register a static source configuration a plugin must depend on the infra plugin and perform a call like the following during its setup() phase:
infraPlugin.defineInternalSourceConfiguration('my-static-source-id', {
  name: 'My Custom Logs',
  logAlias: 'custom-logs-*,other-logs-*',
  logColumns: [
    {
      timestampColumn: {
        id: '5e7f964a-be8a-40d8-88d2-fbcfbdca0e2f',
      },
    },
    {
      fieldColumn: {
        id: 'eb9777a8-fcd3-420e-ba7d-172fff6da7a2',
        field: 'custom_field_1',
      },
    },
    {
      messageColumn: {
        id: 'b645d6da-824b-4723-9a2a-e8cece1645c0',
      },
    },
  ],
});
In the above example the logColumns are optional and will fall back to the defaults (@timestamp, event.dataset, message). The uuids are opaque and must be unique within this source configuration.
Given a static source configuration like the above example, the <LogStream /> could be rendered like this:
<LogStream
  startTimestamp={startTimestamp}
  endTimestamp={endTimestamp}
  sourceId="my-static-source-id"
  />
See https://github.com/elastic/kibana/blob/7f278416d88a2597772a583579238e730395cccb/x-pack/plugins/infra/public/components/log_stream/README.md for more properties of the <LogStream />. The API might be subject to change as we enhance the component, but with the power of TypeScript we can notice and fix existing usages.
 weltenwort
on 16 Oct 2020
weltenwort
on 16 Oct 2020
@katrin-freihofner and @formgeist - Just making sure you've seen this in the context of Uptime and User Experience.
drewpost
on 20 Oct 2020
Related issues
 tbragin
·
3Comments
tbragin
·
3Comments
 mark54g
·
3Comments
mark54g
·
3Comments
 timroes
·
3Comments
timroes
·
3Comments
timroes
·
3Comments
timroes
·
3Comments
 spalger
·
3Comments
spalger
·
3Comments