Kibana: Grok Dubugger's error message does not show on the page
Kibana version: 7.9.2
Elasticsearch version: 7.9.2
Server OS version: centos7
Browser version: chrome 85.0.4183.121
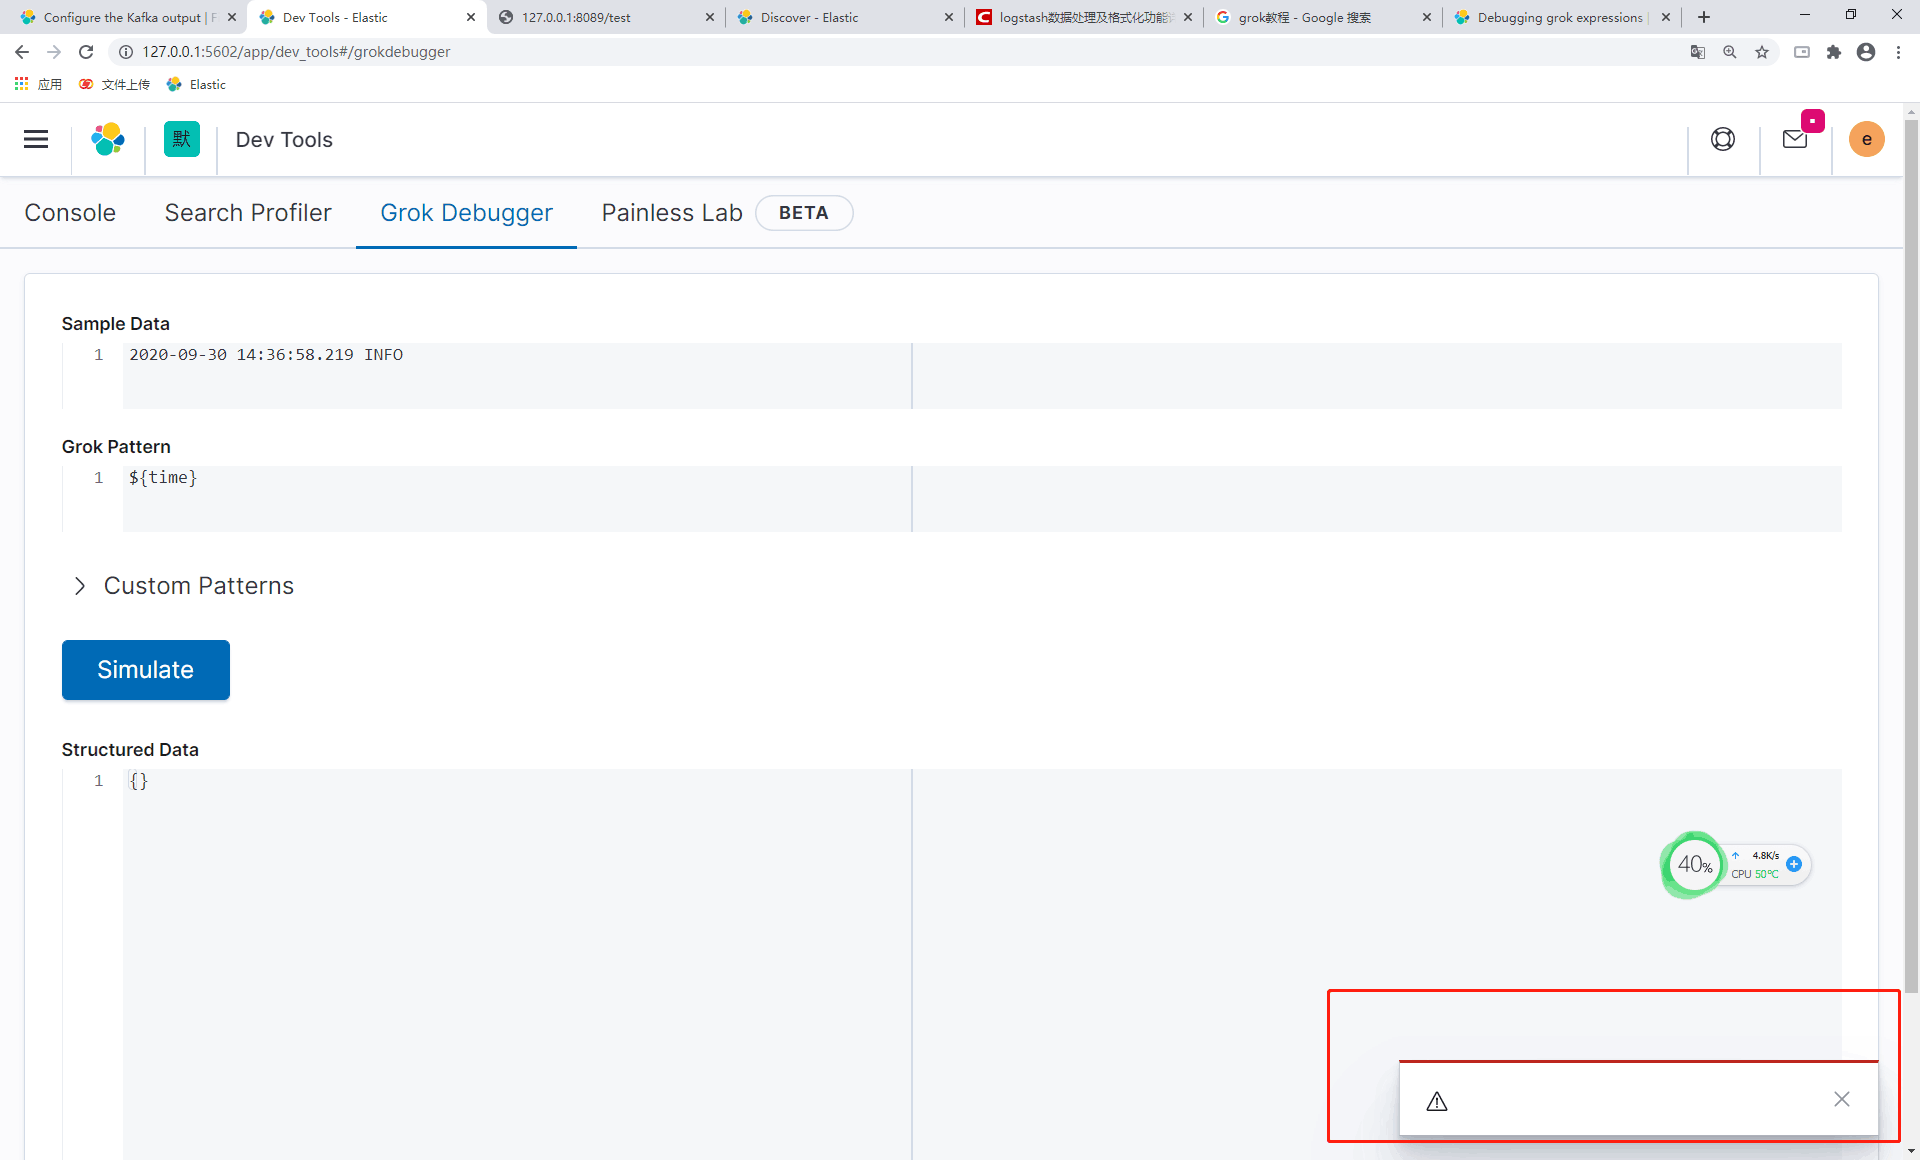
Describe the bug: Gork Dubugger's error message does not show on the page.But can see the message in response.
Steps to reproduce:
- open Gork Dubugger
- input any data and gork
- click simulate
Expected behavior: show me error message on the page
Screenshots (if relevant):
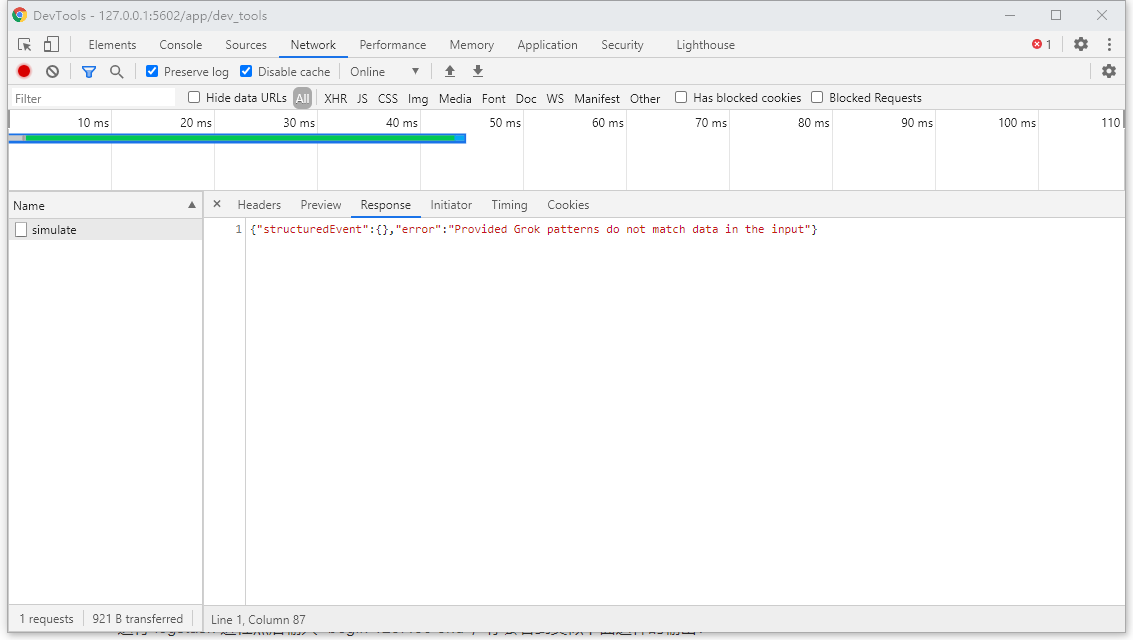
Errors in browser console (if relevant): nothing
 Vastzhang97
All 3 comments
Pinging @elastic/es-ui (Team:Elasticsearch UI)
 elasticmachine
on 1 Oct 2020
elasticmachine
on 1 Oct 2020
@jloleysens It looks like you fixed this via https://github.com/elastic/kibana/pull/77499, which I verified was backported to 7.9 in time to make the 7.9.2 release. So I think this _should_ be fixed. Could you try downloading the 7.9.2 release locally and attempt to reproduce this bug? We need to a) verify the fix made it in and b) verify it works on 7.9 (not just master).
 cjcenizal
on 1 Oct 2020
cjcenizal
on 1 Oct 2020
@cjcenizal @Vastzhang97 I tested locally on 7.9.2 and 7.9.3 with the input from the screenshot (and any other input) and was able to get the error message to appear in the dialog as before.
Not sure how this is appearing in 7.9.2 since the fix is included in the commit tagged for that release. Closing for now since the issue is definitely fixed in later releases.
 jloleysens
on 2 Nov 2020
jloleysens
on 2 Nov 2020
Related issues
 stacey-gammon
·
3Comments
stacey-gammon
·
3Comments
 LukeMathWalker
·
3Comments
LukeMathWalker
·
3Comments
 cafuego
·
3Comments
cafuego
·
3Comments
 timmolter
·
3Comments
stacey-gammon
·
3Comments
timmolter
·
3Comments
stacey-gammon
·
3Comments