Kibana: Using new enrollment token with new config doesn't create data-sources / stream data
Kibana version: 7.8 BC5
- testing on Chrome on macOS with Cloud GCP deploy of 7.8
Describe the bug:
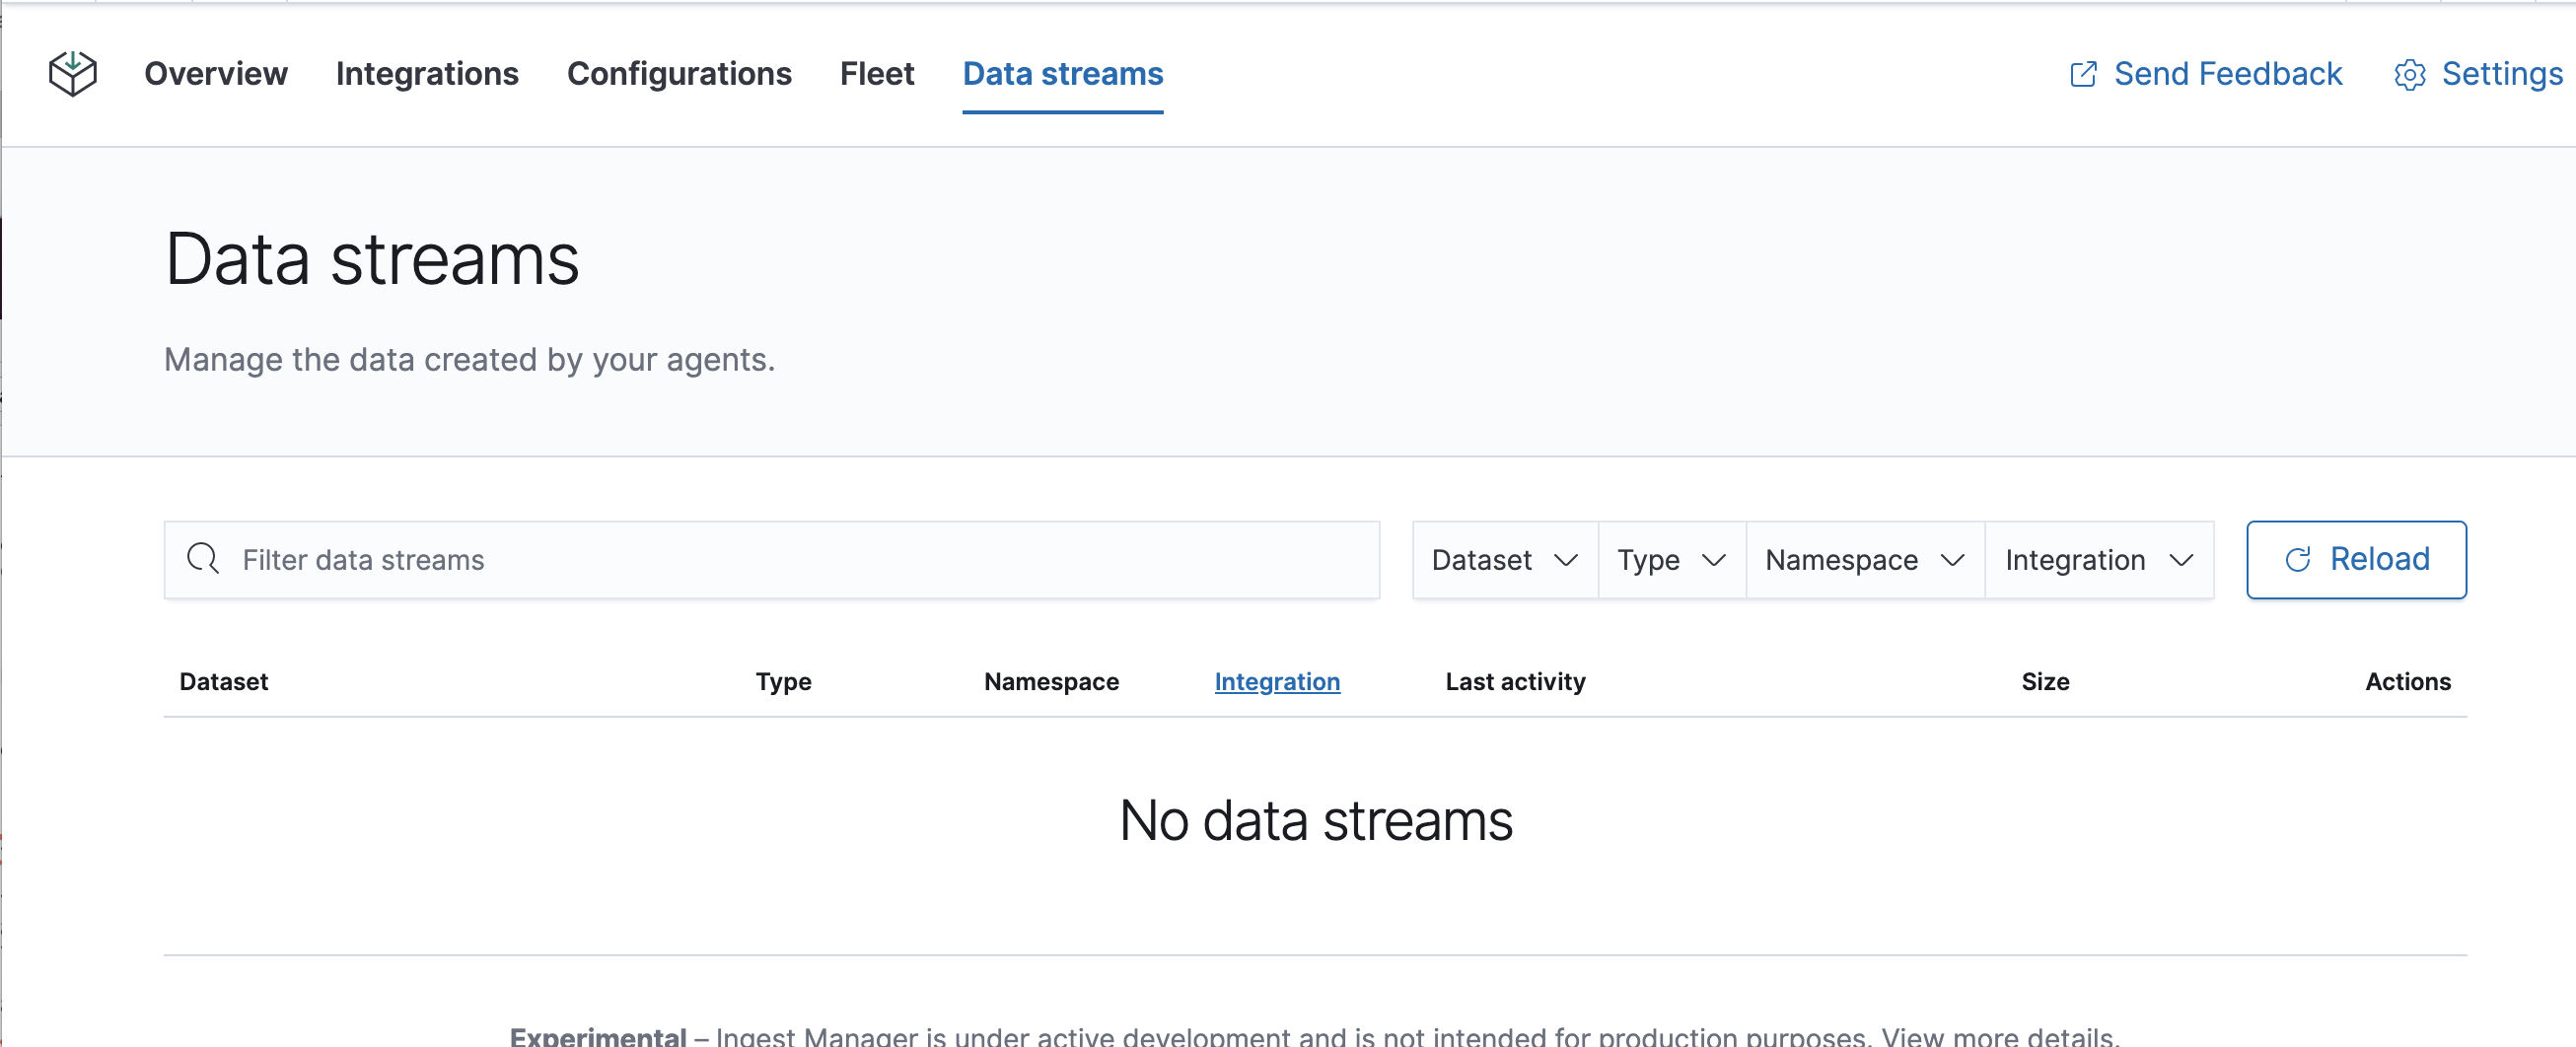
when user first deploys, if they use the default enrollment key and a new config, the agent datasources are not set up (nothing shows in data streams tab in Ingest Manager)
Steps to reproduce:
- deploy 7.8 BC 5 to cloud, I used GCP but I expect this is irrespective of provider
- set up the xpack option in cloud ui to enable 'alpha' Ingest Manager and apply
- in Ingest Manager, click on Fleet tab and create Fleet user
- click on configuration, and create a new config named 'foo config'
- click in fleet to create a new Enrollment, name like 'foo' and tie it to 'foo config'
- click on 'enroll new agent' and copy the enrollment command
- on host, enroll a macOS or windows agent with the enroll string, and the 7.8 BC Agent, it seems to work, agent enrolls and runs fine and shows good logging
- in Kibana, go to Fleet an look at Agent, it shows up initially as an error, then turns ok and is 'on-line' and has some activity log
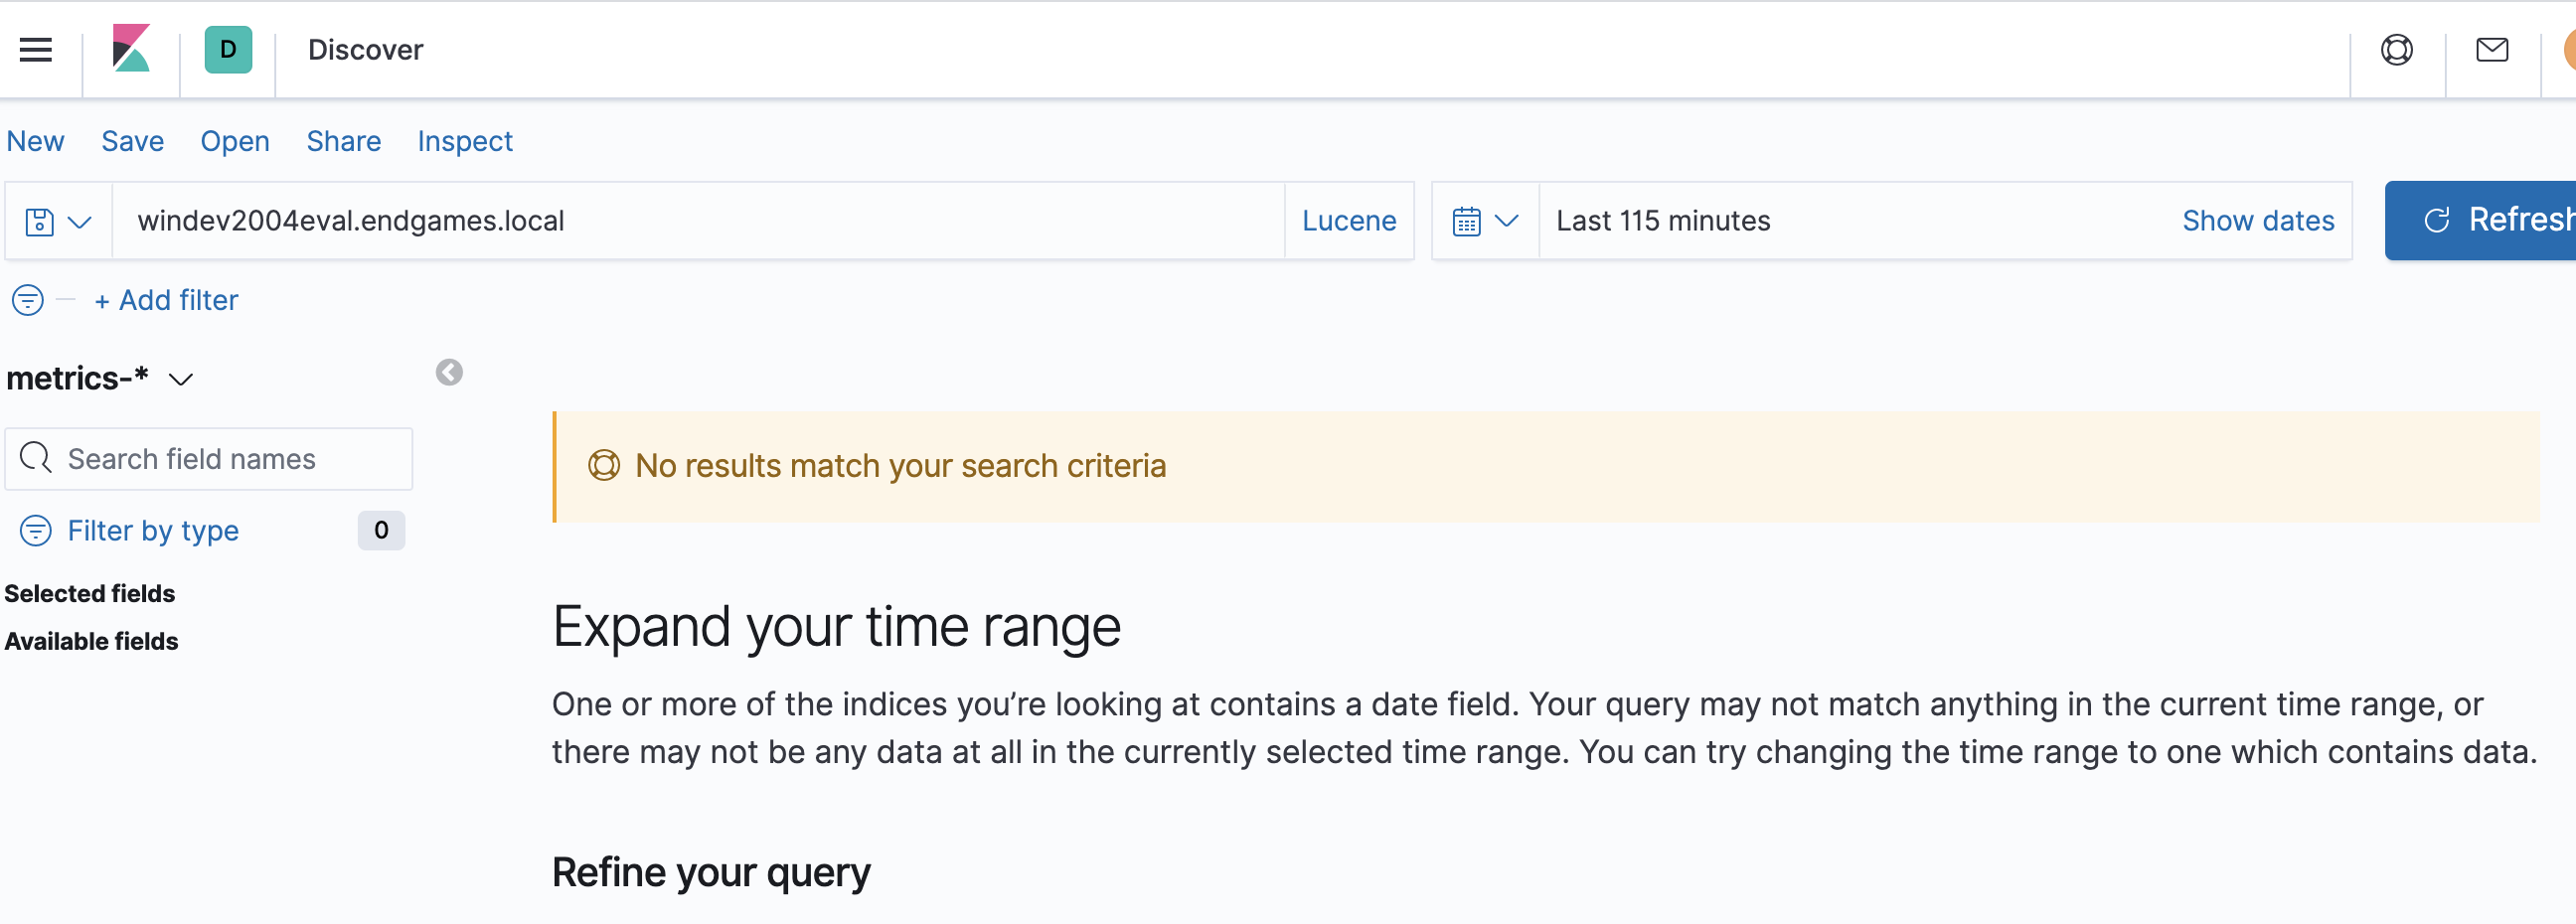
- but the data streams never fill in, no docs are streaming into ES
Expected behavior:
Datastream is set up and docs are streaming in
Screenshots (if relevant):

Errors in browser console (if relevant):
n/a
Any additional context:
- I deployed another environment and used the default config and enrollment key and the same agent binary on the same host as earlier and it works as expected.
 EricDavisX
All 12 comments
I will post to the chat a pair of servers that I am using. @ph @ruflin
EricDavisX
on 4 Jun 2020
Pinging @elastic/ingest-management (Team:Ingest Management)
 elasticmachine
on 4 Jun 2020
elasticmachine
on 4 Jun 2020
@EricDavisX can you share your custom configuration and logs from filebeat?
it might be that output definition is invalid such as elasticsearch:9200
 michalpristas
on 4 Jun 2020
michalpristas
on 4 Jun 2020
Michal says off line that he'll update the ticket soon with details of research we did. We're not yet certain whats up. I tried to reproduce it out-right and could not with a new clean deploy. I am trying to get as close to the original repro usage to see...
EricDavisX
on 4 Jun 2020
we did couple of experiments with @EricDavisX and found out some weird issues with the environment he had setup.
first weird thing was that he had 2 system packages in a Default configuration one of which was with empty namespace. I believe we fixed empty namespace recently on both sides.
the other thing was that in his environment agent retrieved configuration and configured beats to send events but event were logging
pipeline/output.go:181 failed to publish events: temporary bulk send failure
due to
2020-06-04T13:47:39.919+0200 DEBUG [elasticsearch] elasticsearch/client.go:413 Bulk item insert failed (i=45, status=500): {"type":"illegal_state_exception","reason":"invalid mapping definition, expected a single map underneath [_doc] but it was: [{dynamic_templates=[{strings_as_keyword={mapping={ignore_above=1024, type=keyword}, match_mapping_type=string}}], date_detection=false, properties={@timestamp={type=date}, system={properties={load={properties={1={scaling_factor=1000, type=scaled_float}, cores={type=long}, 15={scaling_factor=1000, type=scaled_float}, 5={scaling_factor=1000, type=scaled_float}, norm={properties={1={scaling_factor=1000, type=scaled_float}, 15={scaling_factor=1000, type=scaled_float}, 5={scaling_factor=1000, type=scaled_float}}}}}}}, stream={properties={namespace={type=constant_keyword}, type={type=constant_keyword}, dataset={type=constant_keyword}}}}}]"}
so we tried executing following query on different environments one of which was erics misbehaving instance
POST /metrics-system.load-default/_doc
{
  "@timestamp": "2020-06-04T13:14:03.926Z",
  "@metadata": {
    "beat": "metricbeat",
    "type": "_doc",
    "version": "7.8.0",
    "raw_index": "metrics-system.load-default"
  },
  "ecs": {
    "version": "1.5.0"
  },
  "host": {
    "name": "Michals-MacBook-Pro-2.local"
  },
  "agent": {
    "id": "e0d07c67-d88c-4fb2-aaf4-af4e5c96df85",
    "name": "Michals-MacBook-Pro-2.local",
    "type": "metricbeat",
    "version": "7.8.0",
    "hostname": "Michals-MacBook-Pro-2.local",
    "ephemeral_id": "76af8fa4-bc13-4b3f-af1a-09dc21c5b6ea"
  },
  "event": {
    "dataset": "system.load",
    "module": "system",
    "duration": 53840
  },
  "metricset": {
    "name": "load",
    "period": 10000
  },
  "service": {
    "type": "system"
  },
  "system": {
    "load": {
      "cores": 8,
      "5": 3.6289,
      "15": 3.769,
      "norm": {
        "5": 0.4536,
        "15": 0.4711
      }
    }
  },
  "stream": {
    "namespace": "default",
    "type": "metrics",
    "dataset": "system.load"
  }
}
on each of environments it passed ok but on erics. his instance returned similar template error as mentioned above.
when i compared templates i saw template for system.load on all instances and they were equal.
@skh i wonder how is mapping applied and when it is generated that it could result into such an issue. we're not sure what lead to this behavior so we're trying to nail it down.
michalpristas
on 5 Jun 2020
@skh @michalpristas Do we have a better idea where the bugs is Agent or kibana?
 ph
on 8 Jun 2020
ph
on 8 Jun 2020
@kamalpreetpahwa-qasource @manishgupta-qasource I tried to reproduce this for a while, I would love another set of attempts if you could. the steps are there... but to summarize, the point is to set up an agent successfully with Fleet. then un-enroll it and re-enroll it with a new enrollment key. try any variations on this that you think are valid! And try ones that you think are error handling cases and if we find any bugs there we can log them separate from this main case that is sure to happen (and we need to confirm it and fix it if so).
EricDavisX
on 27 Jun 2020
Hi @EricDavisX ,
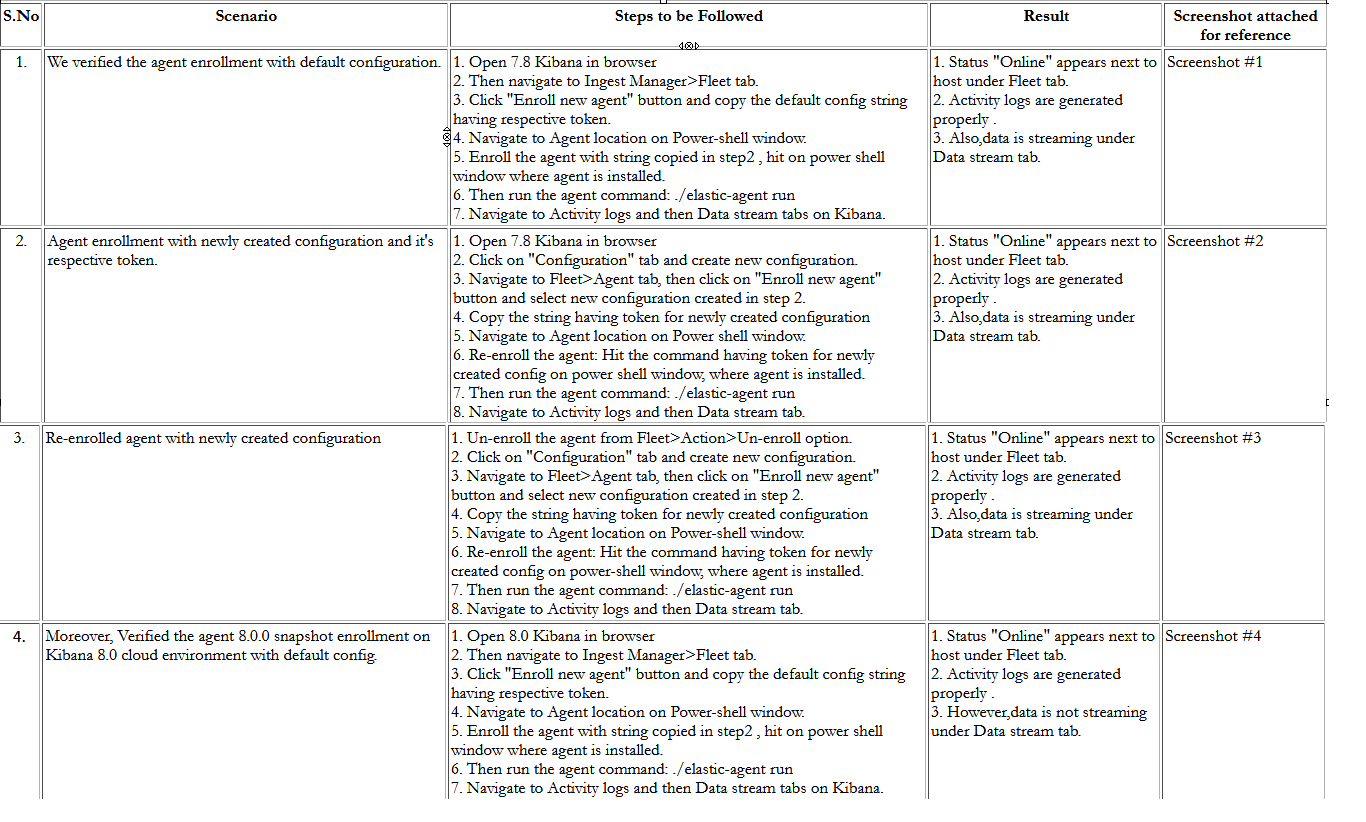
We have verified the issue on below environment and have following observations:
Kibana 7.8 cloud environment

Agent 7.8.0

Hots: Windows 10
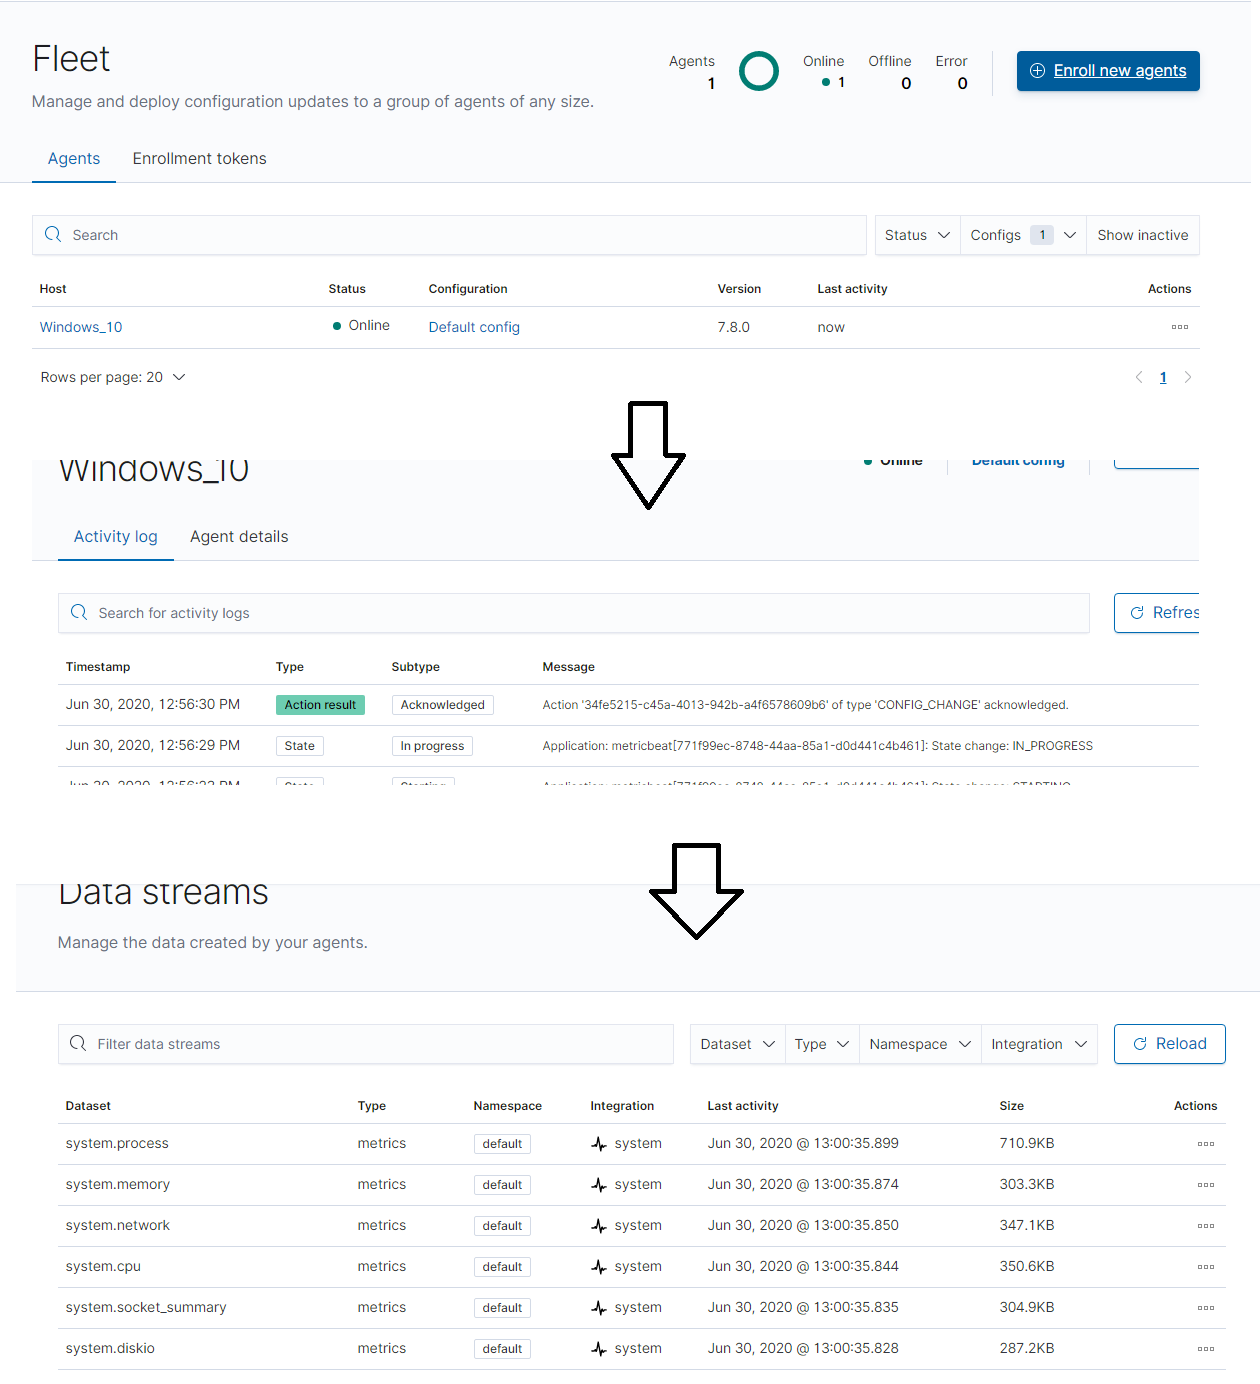
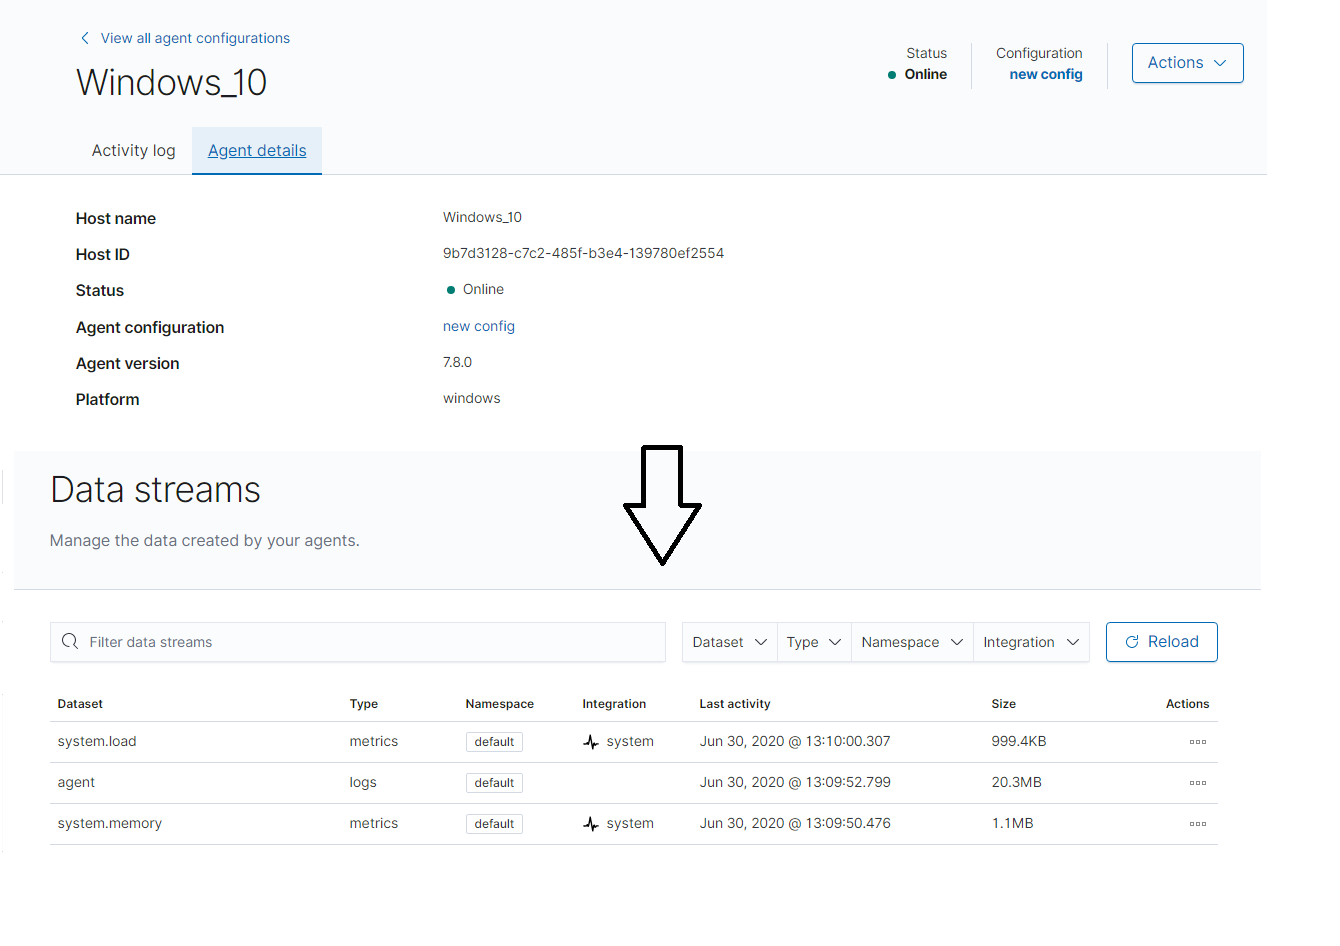
Observations:
Screenshot #1
Screenshot #2
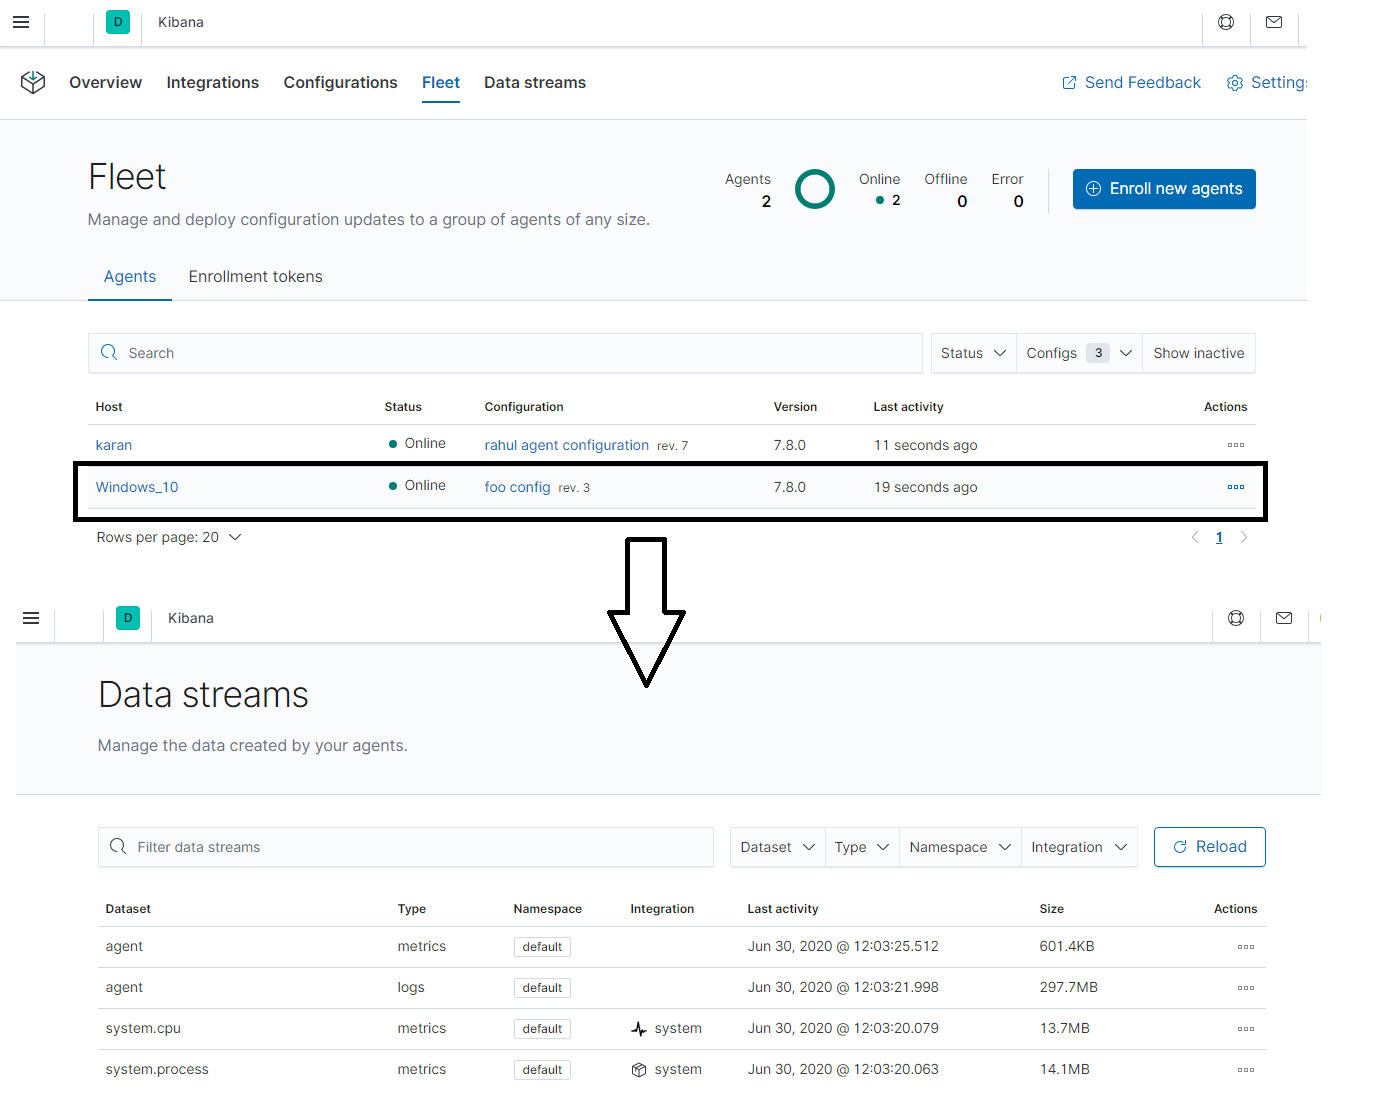
Screenshot #3
Screenshot #4:
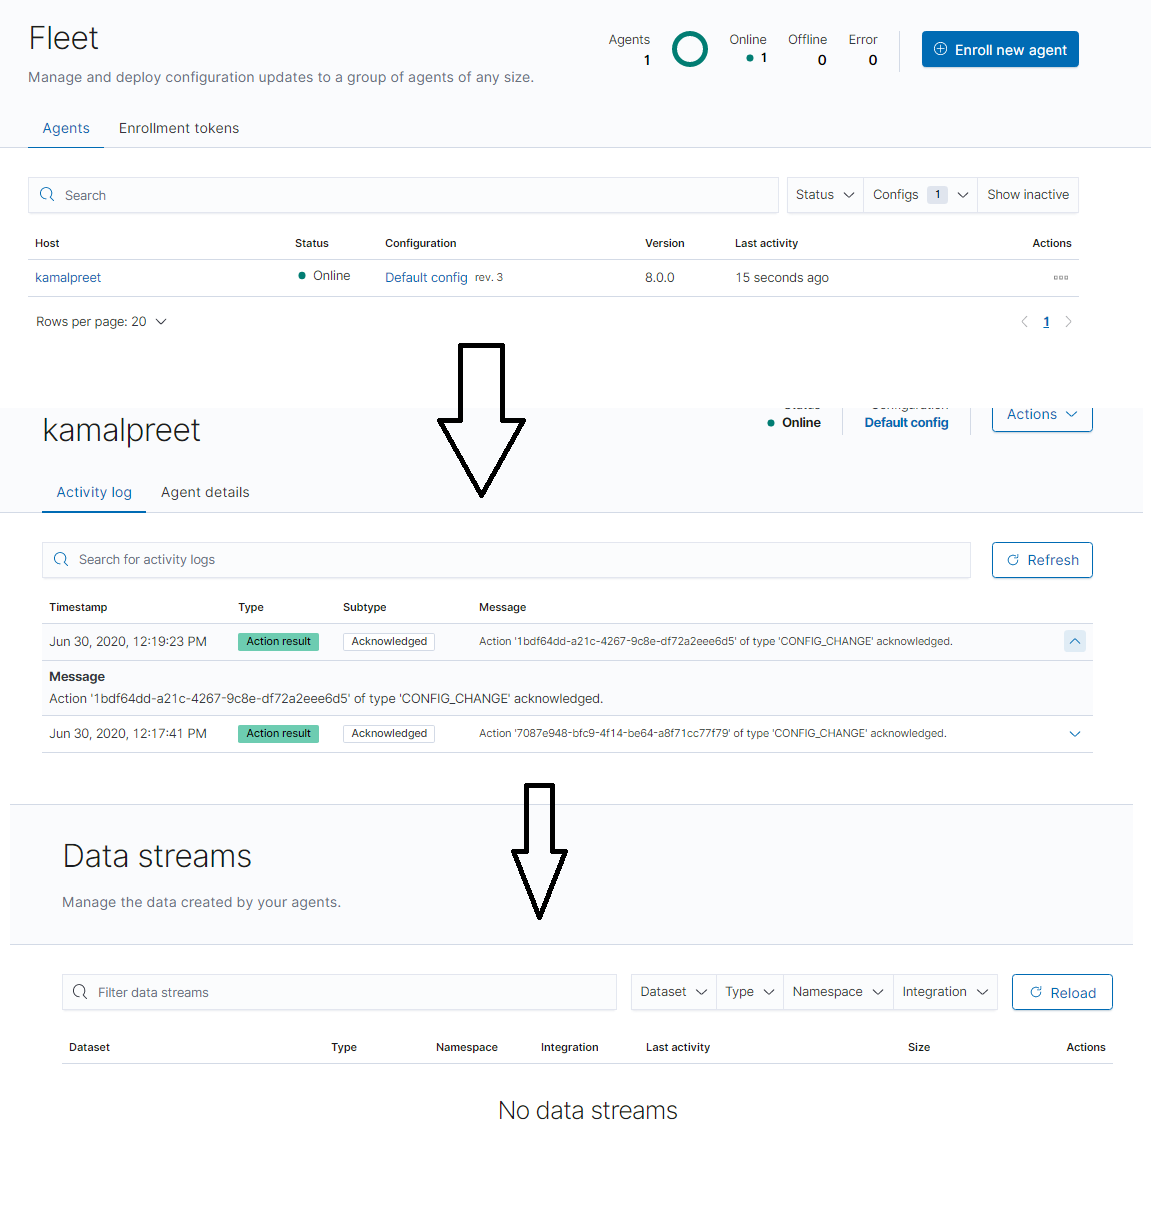
Please let us know if we are missing anything.
 ghost
on 30 Jun 2020
ghost
on 30 Jun 2020
Hi - @kamalpreetpahwa-qasource this is so great! Its a little hard to be 100% sure what the steps the progression above is. Can you go back and add a simple test phrase to each image post about what clicks or expectations are set for that point in time? Thanks so much
EricDavisX
on 7 Jul 2020
@skh Could you verify this issue?
ph
on 8 Jul 2020
On current Kibana master and latest snapshots of ES and elastic-agent, everything running on linux:
- Step 1:
- enroll an agent with the default config (with
systemintegration) - start agent
- navigate to datasets
- datasets are shown correctly
- enroll an agent with the default config (with
- Step 2:
- create a new agent config
- install the
nginxintegration and add it to that new config - unenroll agent from step 1
- stop agent
- enroll agent with the new agent config and new enrollment token
- start agent again
- navigate to datasets
- datasets are shown correctly (now with
nginx)
As far as I understood the instructions, I can't verify with the latest snapshots and current master.
Any other constellations I should try, or did I miss something?
 skh
on 8 Jul 2020
skh
on 8 Jul 2020
thank you for the attempt on it. It looks like nobody (including me) can reproduce this now, so we can close it. If we see bugs in the future we will log them. thanks.
EricDavisX
on 9 Jul 2020
Related issues
 tbragin
·
3Comments
tbragin
·
3Comments
 socialmineruser1
·
3Comments
socialmineruser1
·
3Comments
 snide
·
3Comments
snide
·
3Comments
 stacey-gammon
·
3Comments
stacey-gammon
·
3Comments
 Ginja
·
3Comments
Ginja
·
3Comments