Kibana: PagerDuty incidents are not created when using the Elastic Alerts Integration Type
Kibana version: 7.7.0
Elasticsearch version: 7.7.0
Server OS version: MacOS Mojave 10.14.6
Browser version: Chrome Version 83.0.4103.61 (Official Build) (64-bit)
Original install method (e.g. download page, yum, from source, etc.): MAC (tarball packages)
Describe the bug: By following the steps given in the documentation, PagerDuty incidents will not be created.
The problem seems to be specific to the Elastic Alerts Integration Type.
Steps to reproduce:
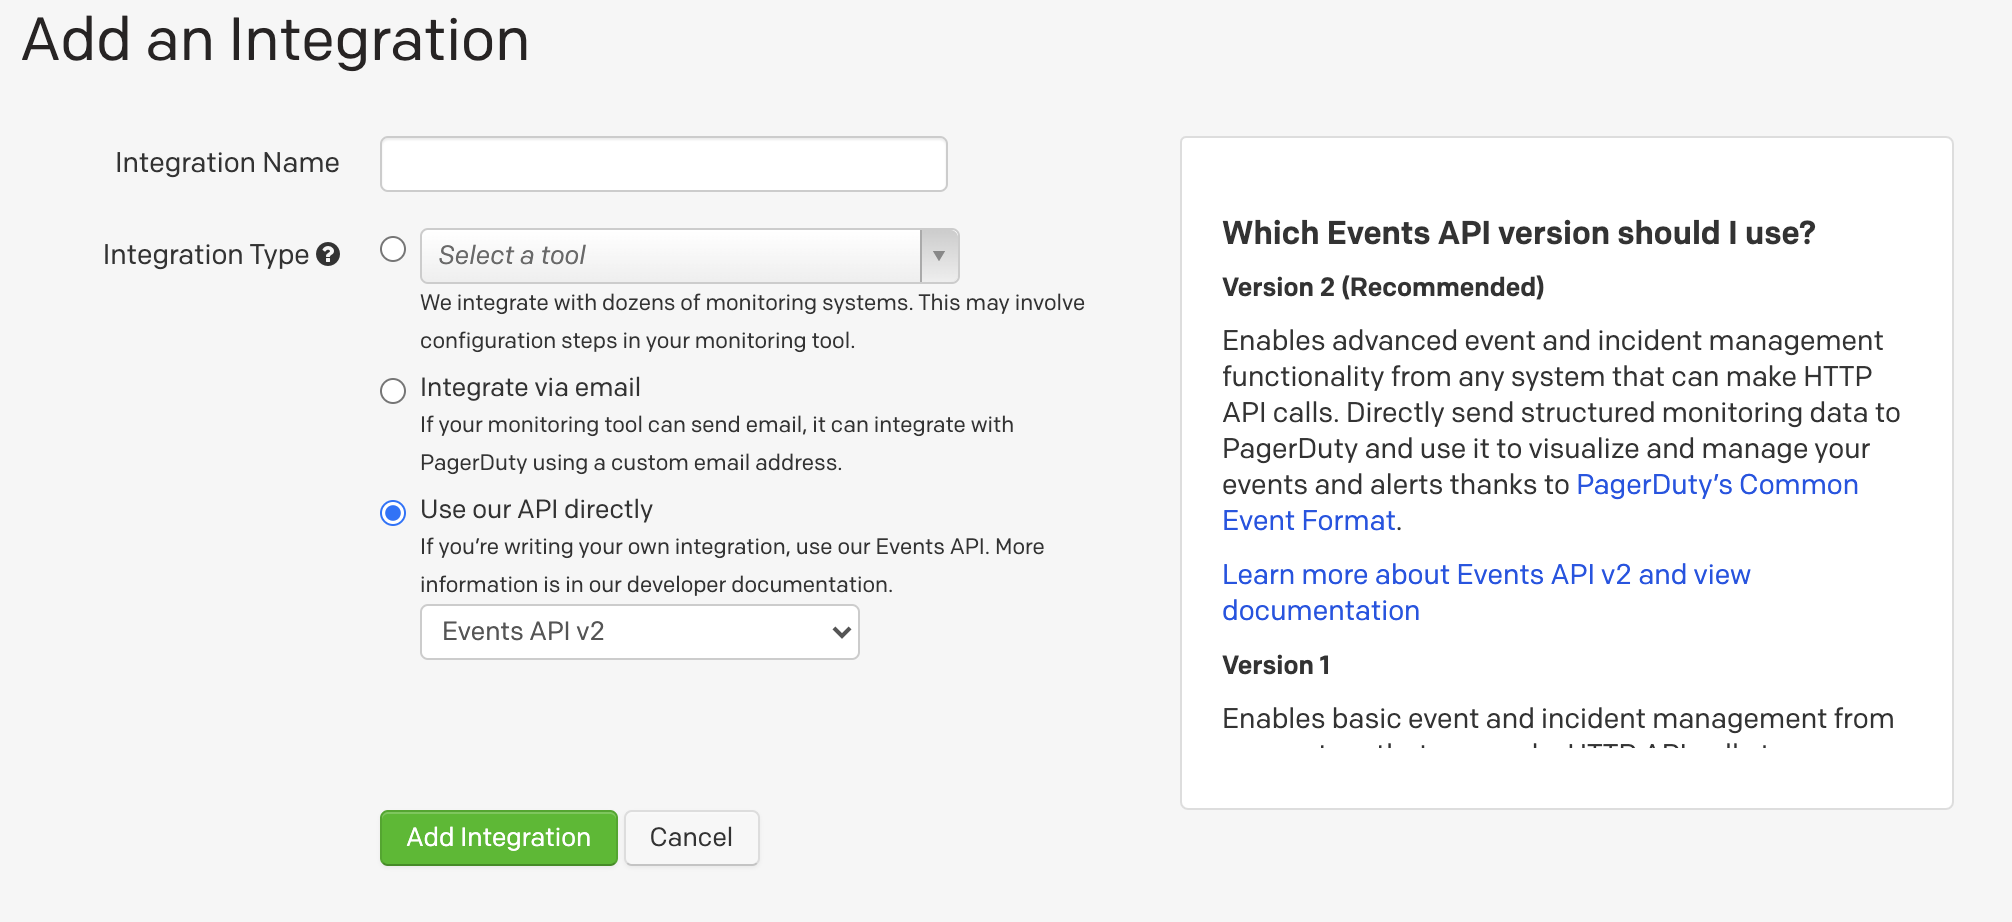
- Create an integration in PagerDuty and select the
Integration Type. Follow the rest of the documentation to set-up the PagerDuty connector and create an alert (e.g Index threshold alert). - Once the alert is triggered, verify that the incident is created in PagerDuty >> No incident is created in PagerDuty.
Expected behavior: When an alert with a PagerDuty action is triggered, an incident should be created in PagerDuty.
Workaround: Create an integration in PagerDuty and set Integration Type to Use our API directly > Events API v2.
1. Investigation
1.1. Documentation
a) Documentation mentions that follow the steps outlined in the Create a New Service section, selecting Elastic as the Integration Type in step 4. There is no Elastic in PagerDuty - it is named Elastic Alerts.
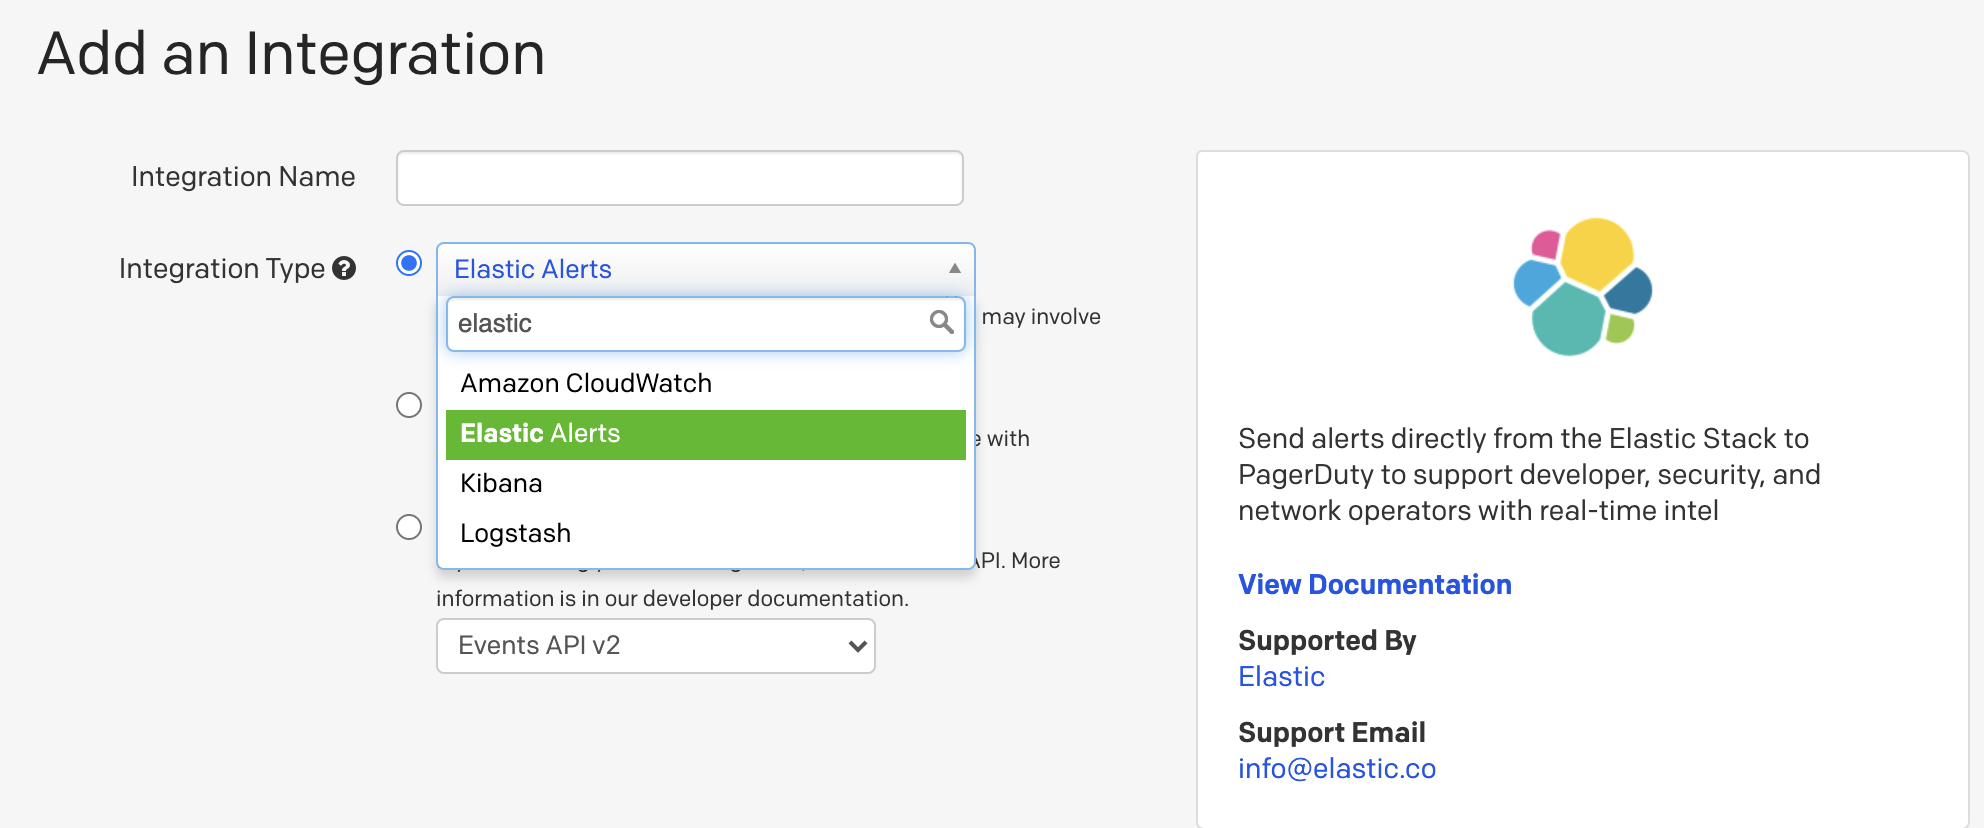
b) The screenshot provided in the online documentation also shows some discrepancy with the Integration Type that should have been selected (i.e Elastic or Elastic Alerts).
c) In addition to the online documentation, the Google document should as well be updated. Should the View Documentation hyperlink point to the online documentation instead?
Notes:
- Seeing Kibana and Logstash in the list of services could be confusing as well?
- Is the
Support Emailaddress correct?
1.2. Logging
a) When the integration is configured with Elastic Alerts and an alert is triggered, no incident is created in PagerDuty. There are no logs indicating any errors. This is an extract from the Kibana logs:
  log   [08:32:15.581] [debug][actions][actions][plugins] response posting pagerduty event: 202
  log   [08:32:15.589] [info][eventLog][plugins] event logged: {"event":{"provider":"actions","action":"execute","start":"2020-06-03T08:32:14.806Z","end":"2020-06-03T08:32:15.581Z","duration":775000000},"kibana":{"namespace":"default","saved_objects":[{"type":"action","id":"418d174a-e96c-4b77-abb9-69013463f43f"}],"server_uuid":"03dc463a-134a-4e81-b441-5aa1c794a2f8"},"message":"action executed: .pagerduty:418d174a-e96c-4b77-abb9-69013463f43f: romain","@timestamp":"2020-06-03T08:32:15.581Z","ecs":{"version":"1.3.1"}}
Interestingly, the response code from PagerDuty was 202 but no incident was created in PagerDuty.
It is unclear whether Kibana can provide further debug logs (e.g logging the request sent to PagerDuty and the response received).
b) As a workaround, users can create an integration in PagerDuty with Integration Type set to Use our API directly > Events API v2. When an alert is triggered, incident will be created in PagerDuty. Similar observations in the Kibana logs - the response is also 202. No further details provided in debug logs.
2. Questions
1) Can the development team address the reported issues (both documentation + integration).
2) Note that the above tests were performed with a hardcoded timestamp string in the PagerDuty action. Otherwise, it is impossible to generate PagerDuty incidents due to https://github.com/elastic/kibana/issues/64871. Is there a way to get around this problem in 7.7.0?
Thank you 🙏
 romain-chanu
All 8 comments
Pinging @elastic/kibana-alerting-services (Team:Alerting Services)
 elasticmachine
on 3 Jun 2020
elasticmachine
on 3 Jun 2020
The problem seems to be specific to the Elastic Alerts Integration Type.
~Yes, I'm not sure what that actually does - selecting the Integration Type "Elastic Alerts" when creating a new service - I imagine that must have something to do with Watcher. We've only tested with the Events API V2, so I think we just need to update the doc to remove the reference to the "Elastic Alerts" integration type.~
Edit: I discovered we had PagerDuty add this "Elastic Alerts" integration type - I tried it out and it seemed to work fine. There is a slight problem on the PD side - the link in the help for that integration type points to a Google Doc we maintain (and is public), but should really point to our external published doc. We're working to get that fixed right now.
Note that the above tests were performed with a hardcoded timestamp string in the PagerDuty action. Otherwise, it is impossible to generate PagerDuty incidents due to #64871. Is there a way to get around this problem in 7.7.0?
The timestamp field is optional, so the workaround is to not enter anything in the field, and it should use the current date/time.
 pmuellr
on 3 Jun 2020
pmuellr
on 3 Jun 2020
As discussed with @pmuellr:
- the observations related to
Elastic Alertsneed to be checked internally and reviewed. - Events API V2 definitely works (as reported initially in the issue description).
The timestamp field is optional, so the workaround is to not enter anything in the field, and it should use the current date/time.
Leaving the timestamp field empty results in the following error: Error: error validating action params: error parsing timestamp. Same observation after clicking Add alert variable and selecting {{context.date}}, this adds an extra space character before the {{context.date}}. Removing the extra space character fixes the problem. It would be great to get confirmation from the development team (I already asked in #64871) whether these two scenarios are handled in versions >= 7.7.1.
romain-chanu
on 3 Jun 2020
The Elastic Alerts provides an Integration URL - if such URL is used in the configuration of the PagerDuty connector - this results in the problem reported (no incident is created in PagerDuty when an alert is triggered).
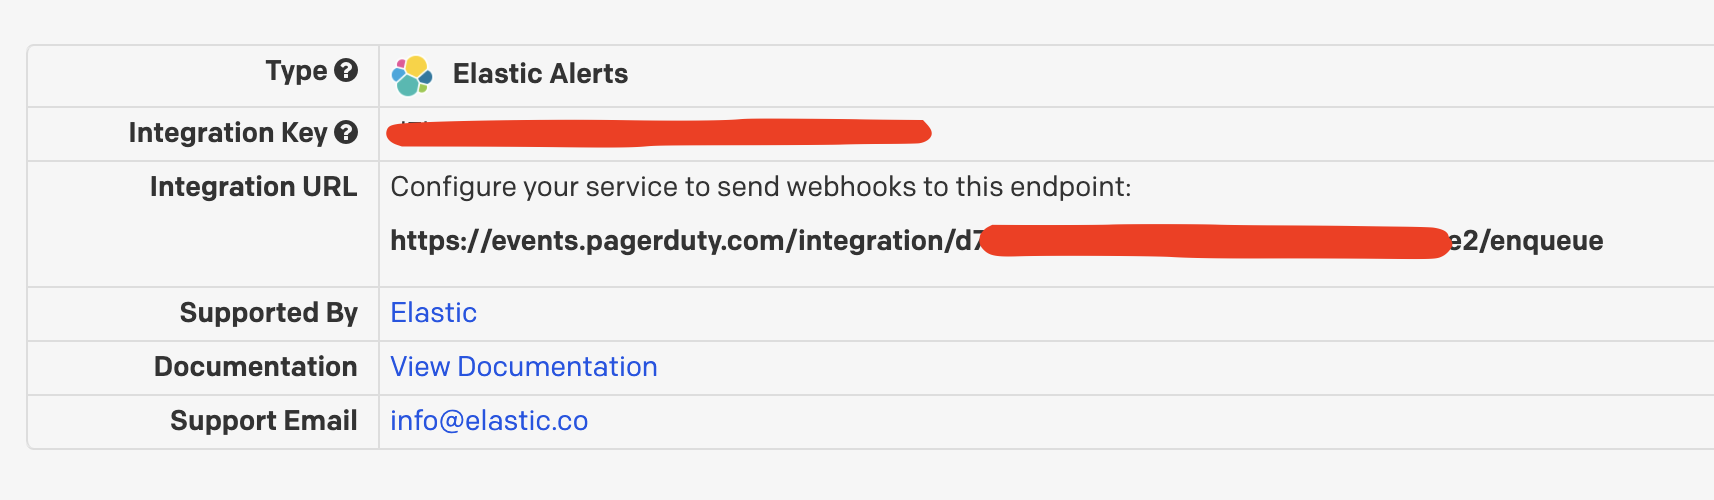
However, if no API URL is specified in the configuration of the PagerDuty connector, then it works (because the API URL defaults to https://events.pagerduty.com/v2/enqueue in Kibana?).
As a summary, two approaches that could work (tested in 7.7.0):
Configuration A
- Set the
Integration TypetoUse our API directly>Events API v2. - API URL in Kibana can bet set to
https://events.pagerduty.com/v2/enqueueor be empty (it will default tohttps://events.pagerduty.com/v2/enqueue). - Remove any extra spaces when adding an alert variable.
Configuration B
- Set the
Integration TypetoElastic Alerts - Leave the API URL in Kibana to empty (it will default to
https://events.pagerduty.com/v2/enqueue). If you use theIntegration URLprovided by PagerDuty, it will not work. - Remove any extra spaces when adding an alert variable.
romain-chanu
on 4 Jun 2020
The link issue is now fixed. Will provide an update soon concerning the rest of the issues @romain-chanu @pmuellr
 arisonl
on 4 Jun 2020
arisonl
on 4 Jun 2020
Quick update concerning the URL problem documented here https://github.com/elastic/kibana/issues/68065#issuecomment-638578276 by @romain-chanu: PagerDuty just got back to me saying that their initial investigation indicates that this may be a bug on their side and that the issue has now been routed to the team responsible for this functionality for further investigation. We are expecting the outcome and I am going to update this issue accordingly. cc @pmuellr
arisonl
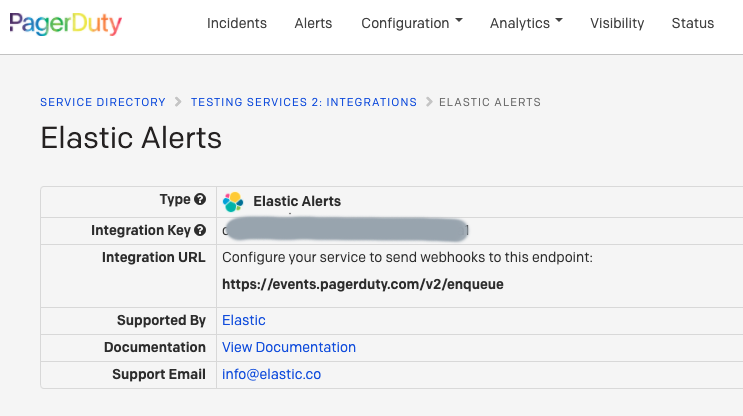
on 17 Jun 2020
PagerDuty has now notified me that they have fixed the bug. As far as I can tell, it is indeed fixed, please see the following screenshot:
@pmuellr Can we create an issue to correct our documentation to refer to Elastic Alerts rather than Elastic? Happy to open it and link here, if you agree. @romain-chanu Please let me know if you are satisfied we can close this issue upon opening an issue to change Elastic to Elastic Alerts in our documentation. Again many thanks for raising these problems. cc @alexfrancoeur
arisonl
on 19 Jun 2020
Concur that the last issue here is a doc issue to change Elastic to Elastic Alerts as the PagerDuty integration name.
I've opened issue https://github.com/elastic/kibana/issues/70075 for that.
I'm going to go ahead and close the issue; @romain-chanu feel free to re-open if there is more for us to do here.
pmuellr
on 26 Jun 2020
Related issues
 snide
·
3Comments
snide
·
3Comments
 cafuego
·
3Comments
cafuego
·
3Comments
 bhavyarm
·
3Comments
bhavyarm
·
3Comments
 treussart
·
3Comments
treussart
·
3Comments
 ctindel
·
3Comments
ctindel
·
3Comments