Kibana: Kibana APM UI doesn't including custom time ranges
Describe the bug
In the Kibana APM UI the time filter (top right) does not display the custom time ranges specified in Kibana -> Management -> Advanced settings -> General -> Time filter quick ranges
Expected behavior
To use the settings we have set (above) like Kibana Discover does.
Kibana discover:

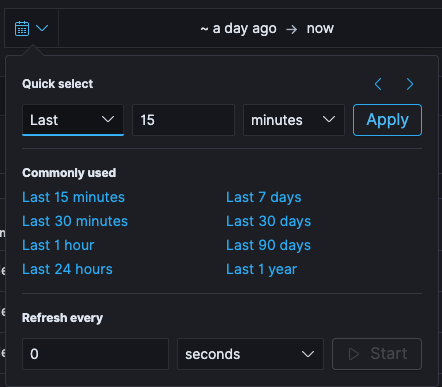
Kibana APM (notice that Last 6 hours and Last 12 hours are missing - these are custom ranges we have added):
Including the custom timeranges would quite grately speed us up.
Very many thanks! Matthew
EDIT
Just to add that it is also confusing that both dropdowns look the same initially but then display different values, as we use Discover quite a lot we then go to APM and almost do a double take as we go to use our custom range which doesn't exist
 matthew-petrie
All 6 comments
Thanks for the excellent report! I'm going to move this into the Kibana repo to make this a bit easier for us to track
 graphaelli
on 29 Apr 2020
graphaelli
on 29 Apr 2020
Pinging @elastic/apm-ui (Team:apm)
 elasticmachine
on 29 Apr 2020
elasticmachine
on 29 Apr 2020
I think we already have a duplicate issue for this in Kibana https://github.com/elastic/kibana/issues/51953
 formgeist
on 29 Apr 2020
formgeist
on 29 Apr 2020
Thanks for making us aware of this @matthew1534. I'll close this in favour of #51953.
 sqren
on 29 Apr 2020
sqren
on 29 Apr 2020
@formgeist apologies, did do a search but didn't come across that issue! - Thanks all!
matthew-petrie
on 29 Apr 2020
@matthew1534 No worries, thanks for reporting it anyhow 👍
formgeist
on 29 Apr 2020
Related issues
 stacey-gammon
·
3Comments
stacey-gammon
·
3Comments
 bhavyarm
·
3Comments
stacey-gammon
·
3Comments
bhavyarm
·
3Comments
stacey-gammon
·
3Comments
 timroes
·
3Comments
timroes
·
3Comments
 socialmineruser1
·
3Comments
socialmineruser1
·
3Comments
Most helpful comment
I think we already have a duplicate issue for this in Kibana https://github.com/elastic/kibana/issues/51953