Kibana: Errors when adding visualizations and Lens embeddables to an embeddable dashboard
Kibana version:
master / v7.5.0, as of 12/10/2019
Original install method (e.g. download page, yum, from source, etc.):
Started a local Kibana server with _Embeddable Explorer_ enabled via:
yarn start --plugin-path test/plugin_functional/plugins/kbn_tp_embeddable_explorer/
Describe the bug:
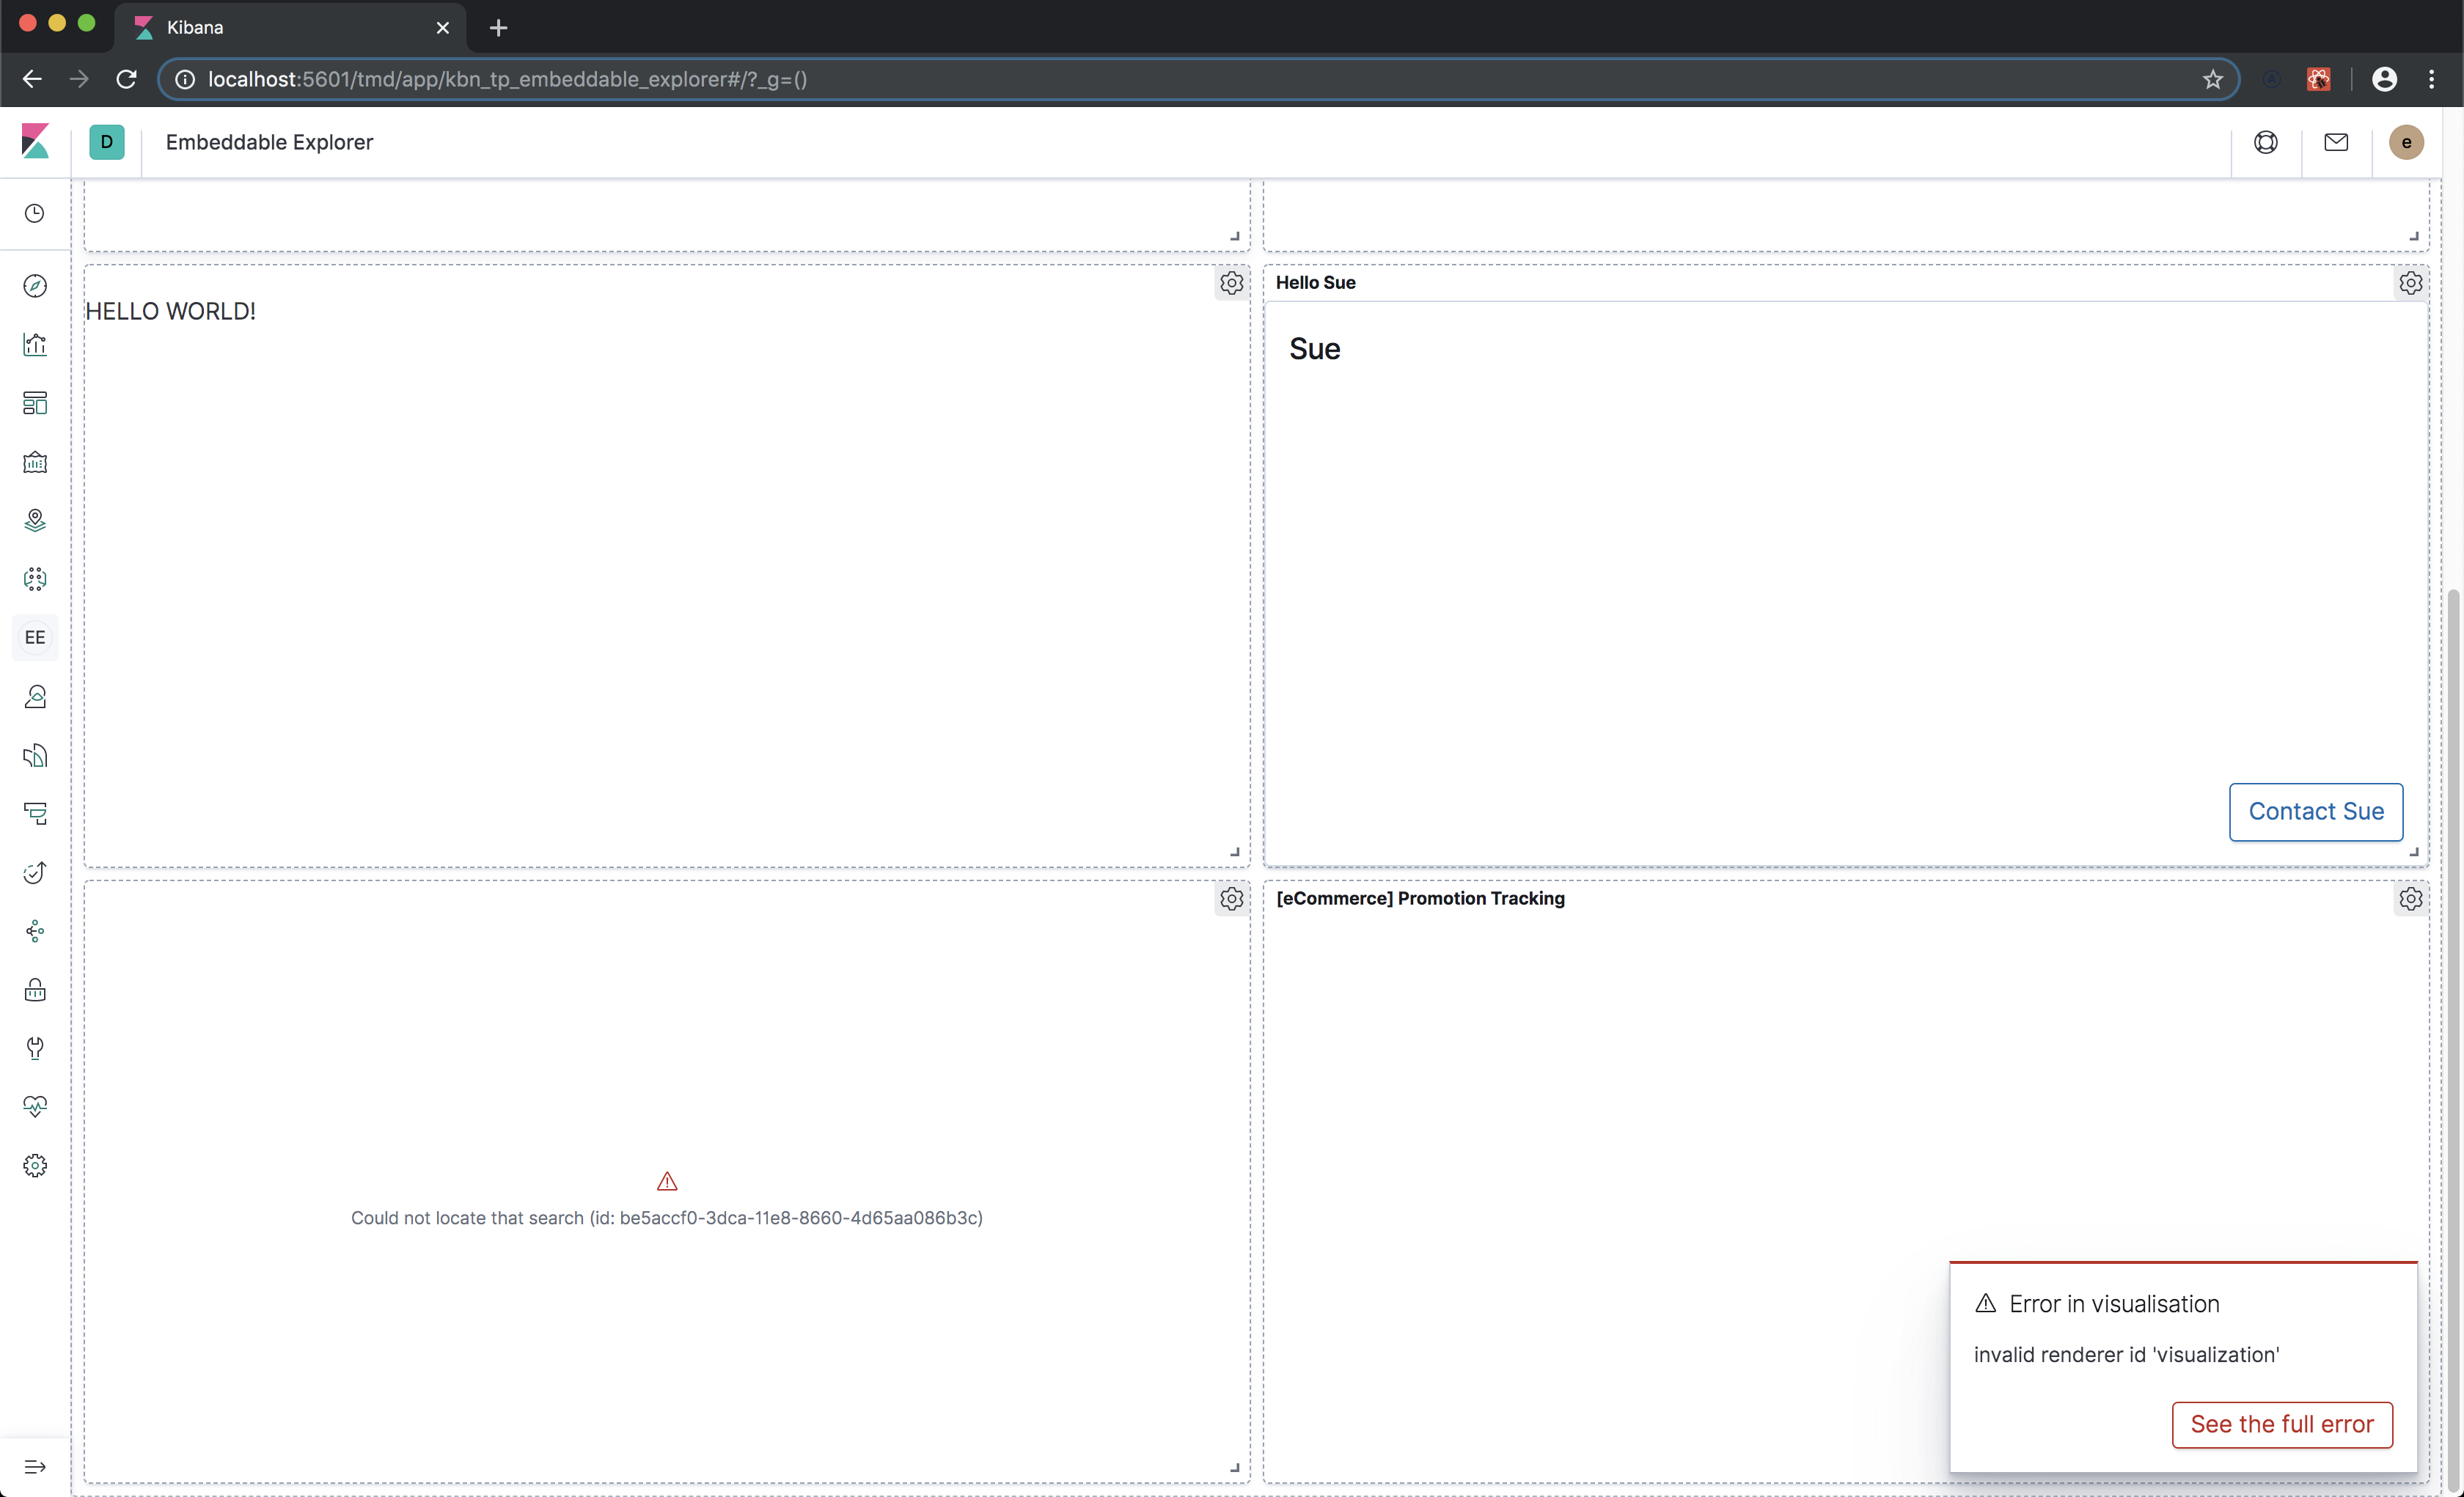
When visualizations are added to an embeddable dashboard, an ⚠️ Error in visualisation: Invalid renderer id 'visualization' error toaster appears, and the contents of the widget are not rendered, as shown in the screenshot below:
A different error also occurs when adding a Lens embeddable to a dashboard:
I found and suggested a potential fix the the Lens error above in the _Any additional context_ section of this github issue.
Steps to reproduce:
- Start a local Kibana (development) server with Embeddable Explorer enabled via:
yarn start --plugin-path test/plugin_functional/plugins/kbn_tp_embeddable_explorer/
- Login to Kibana
- Click the
EEEmbeddable Explorer icon in the Kibana sidebar, to navigate to the Embeddable Explorer sample app - In Embeddable Explorer, click the
Dashboard Containertab to view the Dashboard Container example - Click the dashboard's setting gear, and choose
Add panelfrom the popup menu - Click the
Typesdropdown and selectVisualizationto filter the Add panels view - Click on the name of a visualization to add it to the dashboard
Expected behavior: - The visualization is successfully rendered in the dashboard
Actual behavior: - The widget (with the expected title) is added to the dashboard, but an ⚠️
Error in visualisation: Invalid renderer id 'visualization'error toaster appears, and the contents of the widget are not rendered. Clicking on theSee the full errorbutton in the toaster reveals the following:
Error: invalid renderer id 'visualization'
    at _callee$ (webpack-internal:///./src/plugins/expressions/public/render.ts:106:72)
    at tryCatch (webpack://%5Bname%5D/./node_modules/regenerator-runtime/runtime.js?:45:40)
    at Generator.invoke [as _invoke] (webpack://%5Bname%5D/./node_modules/regenerator-runtime/runtime.js?:271:22)
    at Generator.prototype.<computed> [as next] (webpack://%5Bname%5D/./node_modules/regenerator-runtime/runtime.js?:97:21)
    at asyncGeneratorStep (webpack-internal:///./src/plugins/expressions/public/render.ts:25:103)
    at _next (webpack-internal:///./src/plugins/expressions/public/render.ts:27:194)
    at eval (webpack-internal:///./src/plugins/expressions/public/render.ts:27:364)
    at new Promise (<anonymous>)
    at ExpressionRenderHandler.eval (webpack-internal:///./src/plugins/expressions/public/render.ts:27:97)
    at ExpressionRenderHandler.eval [as render] (webpack-internal:///./src/plugins/expressions/public/render.ts:131:20)
Errors in browser console (if relevant):
The following errors also appear in the developer console. They appear to refer to saved object IDs that are referenced in the example code, but don't exist in a default Kibana installation:
18:04:55.272 webpack-internal:///./src/legacy/core_plugins/kibana/public/visualize/embeddable/visualize_embeddable_factory.tsx:250 Error: Could not locate that visualization (id: 3fe22200-3dcb-11e8-8660-4d65aa086b3c)
    at SavedObject.applyESResp (webpack-internal:///./src/legacy/ui/public/saved_objects/saved_object.js:263)
    at processQueue (webpack://%5Bname%5D/./node_modules/angular/angular.js?:17948)
    at eval (webpack://%5Bname%5D/./node_modules/angular/angular.js?:17996)
    at Scope.$digest (webpack://%5Bname%5D/./node_modules/angular/angular.js?:19115)
    at eval (webpack://%5Bname%5D/./node_modules/angular/angular.js?:19435)
    at TaskTracker.completeTask (webpack://%5Bname%5D/./node_modules/angular/angular.js?:21234)
    at eval (webpack://%5Bname%5D/./node_modules/angular/angular.js?:6814)
_callee3$ @ webpack-internal:///./src/legacy/core_plugins/kibana/public/visualize/embeddable/visualize_embeddable_factory.tsx:250
18:04:55.272 webpack-internal:///./src/legacy/core_plugins/kibana/public/visualize/embeddable/visualize_embeddable_factory.tsx:250 Error: Could not locate that visualization (id: 4c0f47e0-3dcd-11e8-8660-4d65aa086b3c)
    at SavedObject.applyESResp (webpack-internal:///./src/legacy/ui/public/saved_objects/saved_object.js:263)
    at processQueue (webpack://%5Bname%5D/./node_modules/angular/angular.js?:17948)
    at eval (webpack://%5Bname%5D/./node_modules/angular/angular.js?:17996)
    at Scope.$digest (webpack://%5Bname%5D/./node_modules/angular/angular.js?:19115)
    at eval (webpack://%5Bname%5D/./node_modules/angular/angular.js?:19435)
    at TaskTracker.completeTask (webpack://%5Bname%5D/./node_modules/angular/angular.js?:21234)
    at eval (webpack://%5Bname%5D/./node_modules/angular/angular.js?:6814)
_callee3$ @ webpack-internal:///./src/legacy/core_plugins/kibana/public/visualize/embeddable/visualize_embeddable_factory.tsx:250
18:04:55.272 webpack-internal:///./src/legacy/core_plugins/kibana/public/discover/embeddable/search_embeddable_factory.ts:144 Error: Could not locate that search (id: be5accf0-3dca-11e8-8660-4d65aa086b3c)
    at SavedObject.applyESResp (webpack-internal:///./src/legacy/ui/public/saved_objects/saved_object.js:263)
    at processQueue (webpack://%5Bname%5D/./node_modules/angular/angular.js?:17948)
    at eval (webpack://%5Bname%5D/./node_modules/angular/angular.js?:17996)
    at Scope.$digest (webpack://%5Bname%5D/./node_modules/angular/angular.js?:19115)
    at eval (webpack://%5Bname%5D/./node_modules/angular/angular.js?:19435)
    at TaskTracker.completeTask (webpack://%5Bname%5D/./node_modules/angular/angular.js?:21234)
    at eval (webpack://%5Bname%5D/./node_modules/angular/angular.js?:6814)
_callee$ @ webpack-internal:///./src/legacy/core_plugins/kibana/public/discover/embeddable/search_embeddable_factory.ts:144
Since the above saved object IDs (referenced in dashboard_input.ts) don't exist locally, only the "Hello World" and "Contact Card" widgets are successfully rendered by default in my local development environment.
Any additional context:
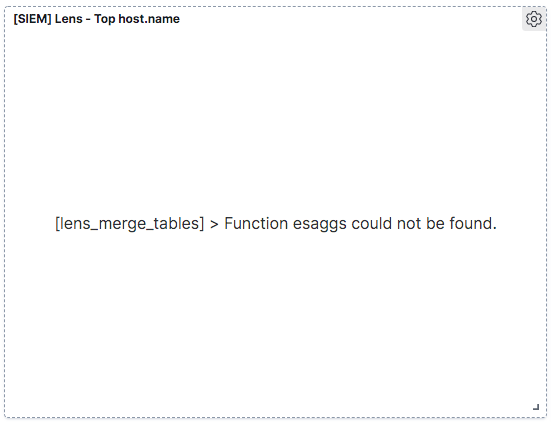
I also observed a separate issue, where after adding a Lens visualization to the dashboard, the widget was rendered with a [lens_merge_tables] > Function esaggs could not be found. error, per the screenshot below:
I was able to resolve the error above by adding the following import to dashboard_container_example.tsx:
import { npSetup } from 'ui/new_platform';
...and then invoking the registerFunction(esaggs) via the following:
npSetup.plugins.expressions.registerFunction(esaggs); // fix esaggs error
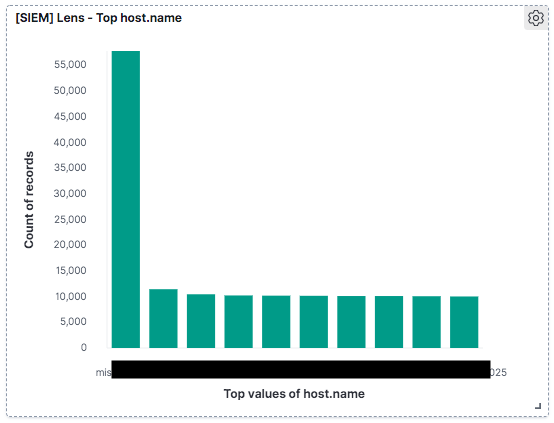
After making the change above, Embeddable Explorer successfully renders a Lens visualization added to the dashboard, as shown in the screenshot below:
Please consider updating dashboard_container_example.tsx to include the above fix, to enable rendering Lens visualizations in a dashboard.
 andrew-goldstein
All 8 comments
cc @stacey-gammon
andrew-goldstein
on 11 Dec 2019
Pinging @elastic/kibana-app-arch (Team:AppArch)
 elasticmachine
on 11 Dec 2019
elasticmachine
on 11 Dec 2019
Thanks @andrew-goldstein ! cc @streamich. I suspect the tests are broken too (turned off due to https://github.com/elastic/kibana/issues/43087) . Will investigate tomorrow.
 stacey-gammon
on 11 Dec 2019
stacey-gammon
on 11 Dec 2019
Actually, this is an issue with the visualize embeddable specifically so the team is Kibana App, not App Arch. But I can still try to help tomorrow if no one else jumps on it, since you are hoping to have this fixed by 7.6 to embed visualizations.
stacey-gammon
on 11 Dec 2019
My guess is this broke it: https://github.com/elastic/kibana/pull/50294
and that we probably need a hacks entry in uiExports that points to the boots file so the esaggs function is always registered.
will see if I can test this theory out soon
stacey-gammon
on 12 Dec 2019
Oh wait no, I bet each legacy app that wants to use legacy visualize embeddables needs to have import 'uiExports/interpreter'; somewhere
stacey-gammon
on 12 Dec 2019
Yep, that fixes it.
stacey-gammon
on 12 Dec 2019
Fixed with https://github.com/elastic/kibana/pull/52945
stacey-gammon
on 13 Dec 2019
Related issues
 bradvido
·
3Comments
bradvido
·
3Comments
 cafuego
·
3Comments
cafuego
·
3Comments
 mark54g
·
3Comments
mark54g
·
3Comments
 timroes
·
3Comments
timroes
·
3Comments
 timmolter
·
3Comments
timmolter
·
3Comments
Most helpful comment
Oh wait no, I bet each legacy app that wants to use legacy visualize embeddables needs to have
import 'uiExports/interpreter';somewhere