Kibana: Kibana report timeout error on cloud
Kibana version:
6.5.0 - Cloud
Elasticsearch version:
6.5.0 - Cloud
Browser version:
Chrome
Original install method (e.g. download page, yum, from source, etc.):
Cloud
Describe the bug:
I am getting a timeout error on report generation:
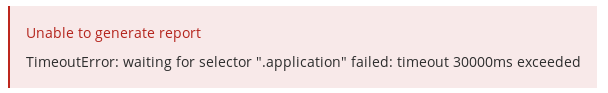
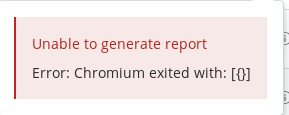
Unable to generate report
TimeoutError: waiting for selector ".application" failed: timeout 30000ms exceeded
Is there a way to increase the time out ?
Steps to reproduce:
- Create es/kibana cloud deployment
- Add sample data
- Generate PDF report from dashboards
Expected behavior:
Report generation should work
Screenshots (if relevant):

 liza-mae
All 24 comments
cc: @joegallo, @Stacey-Gammon
liza-mae
on 13 Nov 2018
Pinging @elastic/kibana-app
 elasticmachine
on 13 Nov 2018
elasticmachine
on 13 Nov 2018
I increased the xpack.reporting.queue.timeout to 120000 and it worked, just curious in our documentation: https://www.elastic.co/guide/en/kibana/current/reporting-settings-kb.html we specify the default as 2 minutes - is the default for cloud different ?
liza-mae
on 13 Nov 2018
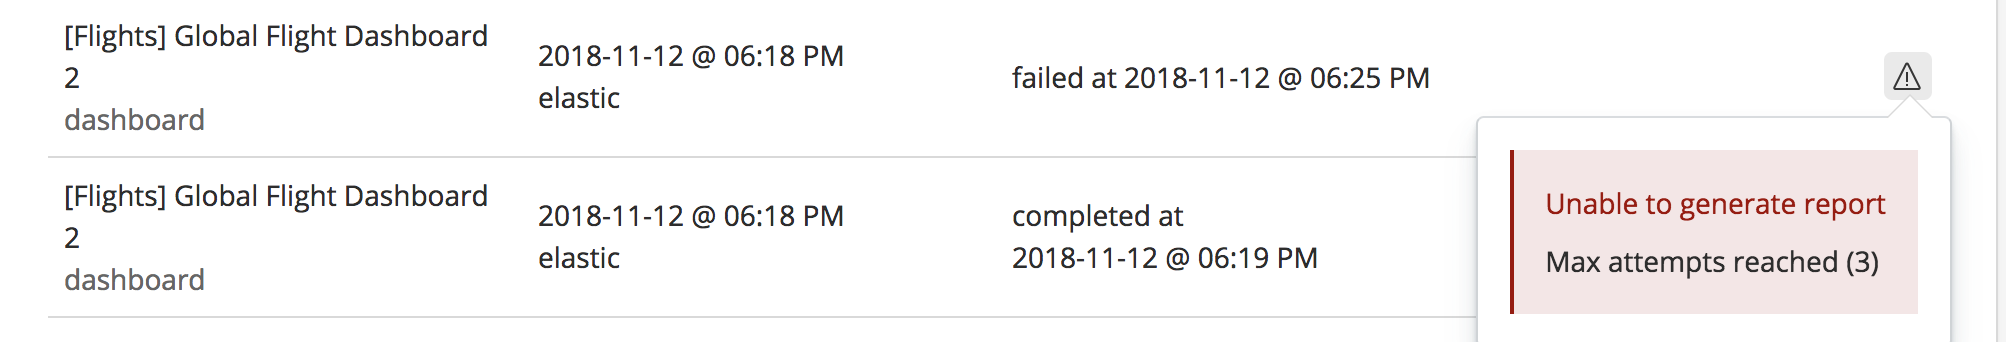
Although one of the reports started and completed, the other one failed with max attempts reached.
This is for 2 minutes.
liza-mae
on 13 Nov 2018
Experiencing the same issue. Setting xpack.reporting.queue.timeout in the cloud kibana settings doesn't fix it.
 hosaka
on 3 Dec 2018
hosaka
on 3 Dec 2018
I'd be helpful to know the size of both the reports and the instances that are running kibana. Large-ish PDF's can be a struggle to generate depending on the RAM available
 joelgriffith
on 9 Jan 2019
joelgriffith
on 9 Jan 2019
@joelgriffith - I was using sample data when I received the error
liza-mae
on 9 Jan 2019
@liza-mae what's the size of the instance, in terms of memory GB and CPU? We've seen this timeout fairly frequently when RAM and/or CPU are constrained (and trying to run multiple reports at the same time... which it looks like what is happening in your screenshot).
joelgriffith
on 9 Jan 2019
@joelgriffith I use the default settings from staging, below is a pic:
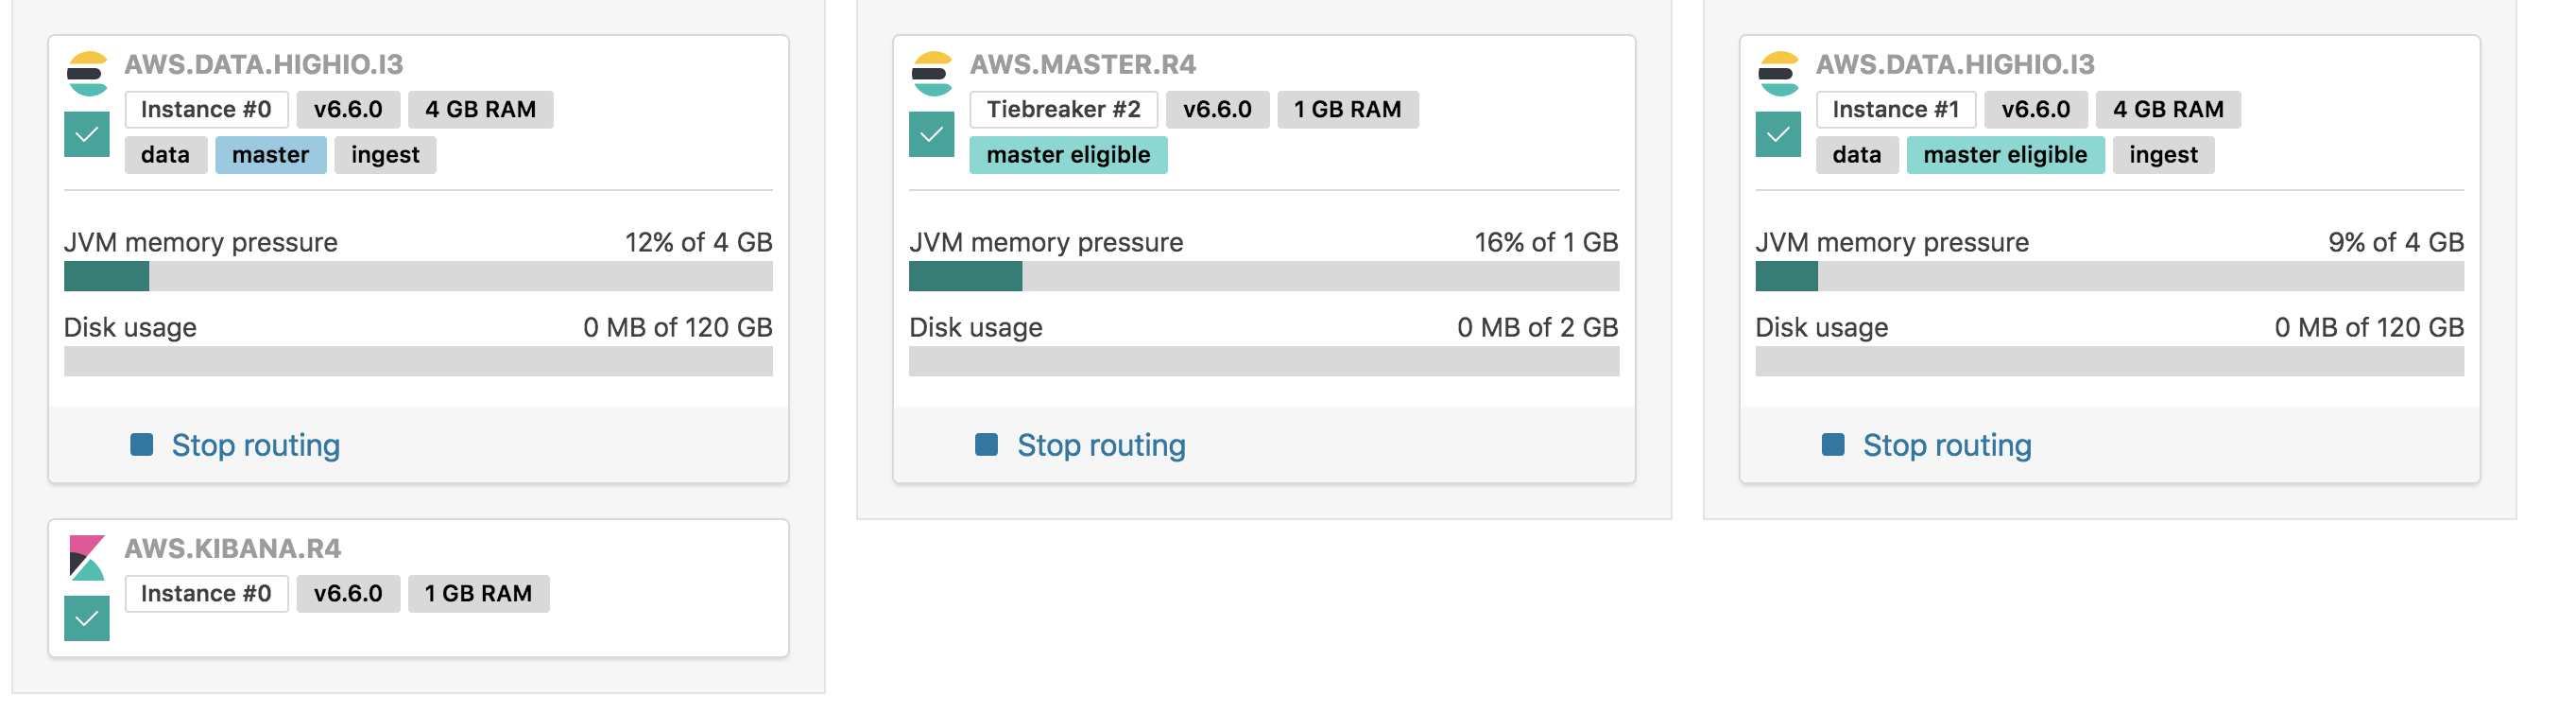
liza-mae
on 9 Jan 2019
I would imagine that even if there are several reports queued up, it's only going to try to generate one at a time. That's the default behavior, I think. If so, then it's most likely a single report that's causing things to fall over.
 chrisdavies
on 9 Jan 2019
chrisdavies
on 9 Jan 2019
I haven't played much with the 1GB of RAM setup on 6.6.0... but I suspect that it's potentially a memory thing at play. I'll give it a shot locally and see what I find!
joelgriffith
on 9 Jan 2019
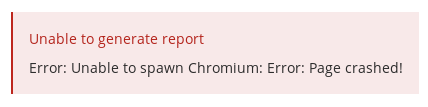
I have tried it on latest 6.6.0 and I get different errors - although sometimes it works sometimes not.
liza-mae
on 9 Jan 2019
I'm still encountering this issue with 6.7. PDF export worked fine for me when I was running 6.5
 timothy-gibson
on 4 Apr 2019
timothy-gibson
on 4 Apr 2019
@timothy-gibson this is interesting. We've upgraded Chrome on 6.7 so it should be more stable. What's the size of the host (also any errors you're seeing)?
joelgriffith
on 4 Apr 2019
@joelgriffith currently running a HIGHIO.CLASSIC with 2GB of ram. The Kibana instance has 1GB of RAM. I would expect that this would work with this configuration given I didn't have any problems with exporting in 6.5.
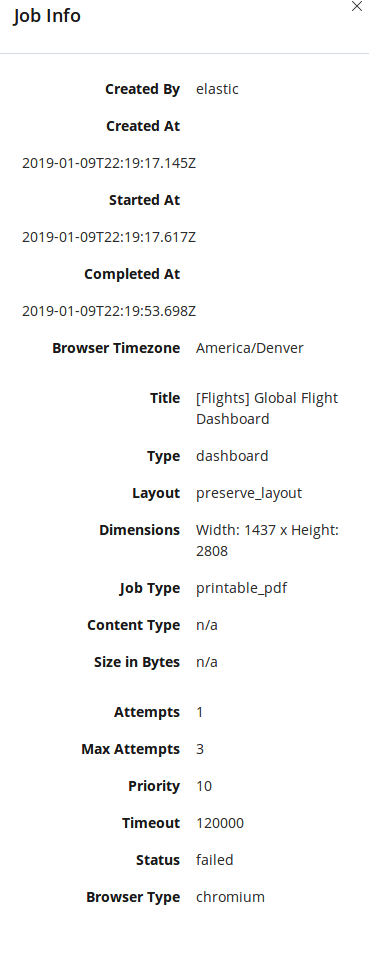
Job INFO:
Created By
elastic
Created At
2019-04-04T22:07:00.754Z
Started At
2019-04-04T22:07:00.948Z
Completed At
2019-04-04T22:07:36.127Z
Processed By
Browser Timezone
Australia/Brisbane
Title
Type
dashboard
Layout
preserve_layout
Dimensions
Width: 2827.0078125 x Height: 3564
Job Type
printable_pdf
Content Type
n/a
Size in Bytes
n/a
Attempts
1
Max Attempts
3
Priority
10
Timeout
120000
Status
failed
Browser Type
chromium
Error Output:
Unable to generate report
TimeoutError: waiting for selector ".application" failed: timeout 30000ms exceeded
I get this error on both single simple visualization exports and more complicated dashboard exports.
timothy-gibson
on 5 Apr 2019
@timothy-gibson it's probable that the newer version of Chromium that we've bundled with Kibana is performing slower than the prior one. We've also recently found a potential bug here: https://github.com/elastic/kibana/pull/34756/files, where certain navigation/waiting that happens in the browser defaults to 30 seconds regardless of what timeout is being set.
joelgriffith
on 9 Apr 2019
Thanks for the info @joelgriffith. Is there any known work around at this point for cloud instances? The only way I can put together reports at this point with our Kibana visualisations is by screenshot (which is not particularly high resolution), or embedding them externally in an iFrame.
timothy-gibson
on 9 Apr 2019
I'm trying to think of one, but unfortunately the only options are potentially downgrading back to your prior working version (not great), or waiting until the PR I linked get's merged then backported _then_ released (not great). Unfortunately downgrading Chromium is not something that I'd recommend, as when we _do_ update then issues could happen due to the version differences.
The only other possibility, at this point, is resizing the host so that it has more power to process. 4GB RAM + 2CPU's generally perform well for PDF generation, however it's still a possibility that you'd hit that same error.
Sorry -- I really do wish I had better suggestions. If something does hit I'll let you know!!
joelgriffith
on 9 Apr 2019
Hello. Has there been any further resolution to this issue?
 syurdin
on 1 May 2019
syurdin
on 1 May 2019
Also interested in knowing what was the resolution on this. Experiencing the same issue others are having. TimeoutError: waiting for selector "[data-test-subj="euiToastHeader"]" failed: timeout 30000ms exceeded
 jgpereira23
on 15 May 2019
jgpereira23
on 15 May 2019
I added a second Kibana node and it resolved the problem. But that costs
more money...
The Law Offices of Seth Yurdin
www.yurdinlaw.com
86 Weybosset Street - 4th Floor
Providence, RI 02903
(401) 484-8552
711 Atlantic Avenue
Boston, MA 02111
(617) 433-8191
CONFIDENTIALITY NOTICE : Intentional interception of email messages are
governed in part by the Electronic Communications Privacy Act at Title 18
USC 2511(c) and (d). This e-mail contains privileged and confidential
information intended only for the use of the individual or entity named
above and may be attorney-client privileged, attorney work product or
exempt from disclosure under applicable state law. If the reader of this
e-mail is not the intended recipient, you are hereby notified that any
review, dissemination, transmission or copying of this e-mail is strictly
prohibited. If you received this e-mail in error, please notify us
immediately by return e-mail or by telephone (call collect) and delete the
material from any computer. Thank you.
On Tue, May 14, 2019, 5:21 PM Jose A Gonzalez notifications@github.com
wrote:
Also interested in knowing what was the resolution on this. Experiencing
the same issue others are having. TimeoutError: waiting for selector
"[data-test-subj="euiToastHeader"]" failed: timeout 30000ms exceeded—
You are receiving this because you commented.
Reply to this email directly, view it on GitHub
https://github.com/elastic/kibana/issues/25572?email_source=notifications&email_token=AGL5K3DE7QABTEB5CGNUL6DPVM3M7A5CNFSM4GDKVYSKYY3PNVWWK3TUL52HS4DFVREXG43VMVBW63LNMVXHJKTDN5WW2ZLOORPWSZGODVM6TLA#issuecomment-492431788,
or mute the thread
https://github.com/notifications/unsubscribe-auth/AGL5K3ENUOGME6WDISQWBBDPVM3M7ANCNFSM4GDKVYSA
.
syurdin
on 15 May 2019
Hi - @jgpereira23 @syurdin this should be fixed with https://github.com/elastic/kibana/pull/34756 - what versions are you using ?
liza-mae
on 20 May 2019
Hi, I've now upgraded to 6.8 and both PNG and PDF reports seem to be exporting okay
timothy-gibson
on 21 May 2019
Pinging @elastic/kibana-reporting-services (Team:Reporting Services)
elasticmachine
on 20 Dec 2019
Related issues
 snide
·
3Comments
snide
·
3Comments
 MaartenUreel
·
3Comments
MaartenUreel
·
3Comments
 spalger
·
3Comments
spalger
·
3Comments
 mark54g
·
3Comments
mark54g
·
3Comments
 socialmineruser1
·
3Comments
socialmineruser1
·
3Comments
Most helpful comment
Hi, I've now upgraded to 6.8 and both PNG and PDF reports seem to be exporting okay