Kibana: [APM] Link `hostname` to Infra UI
As an initial integration between APM UI and the upcoming Infra UI, we want to deep link APM system.hostname on transactions and error to the Infra UI.
Example of link:app/infra/#/link-to/host-logs/:hostname[?time=${TIMESTAMP}]
Infra PR: https://github.com/elastic/kibana/pull/23246
Designs
- Transaction sample header: Add "Actions" button and popover links in the (both in page and flyout views)
- Error occurrence header: Add "Actions" button and popover links
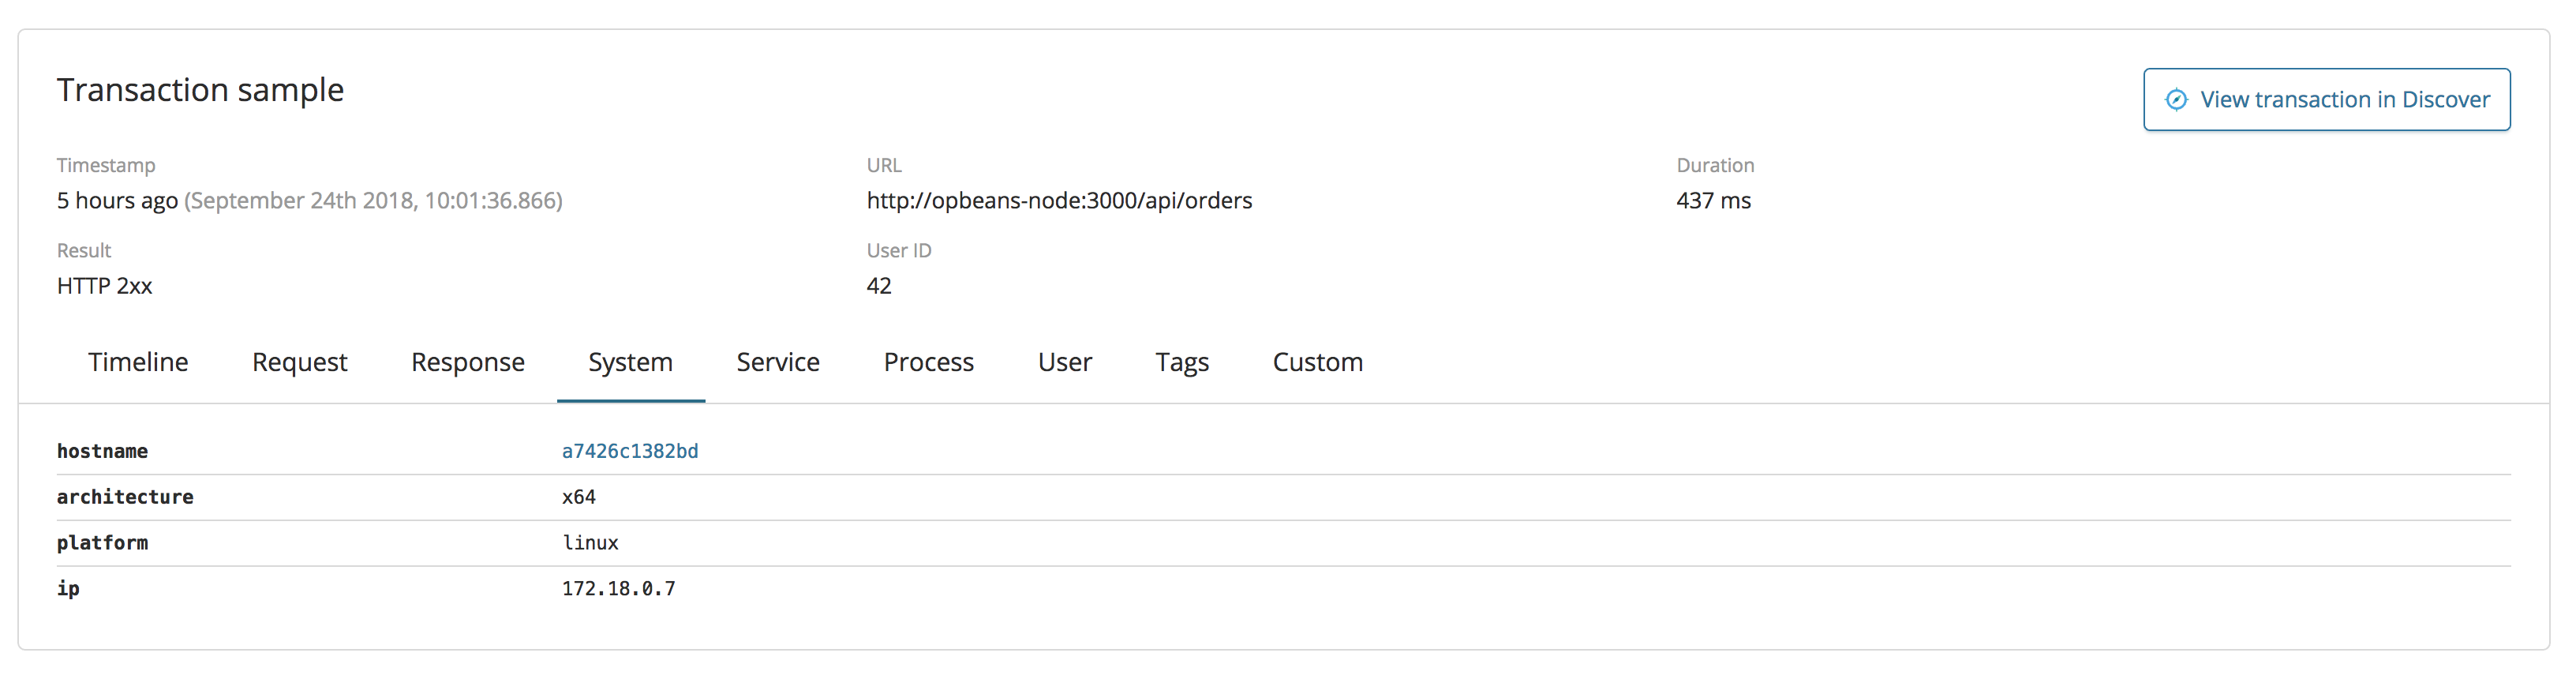
- Add "View host in InfraOps" link next to the
system.hostnamevalue in the contextual info (both in page and flyout views)
Transaction sample header

Transaction detail flyout

Error occurrence header

 makwarth
All 34 comments
Pinging @elastic/apm-ui
 elasticmachine
on 19 Sep 2018
elasticmachine
on 19 Sep 2018
@makwarth I'm considering either converting the hostname value to a link, or explicitly adding an "Inspect in InfraOps" link next to the value. I'm leaning towards to the second option, but that makes it more clear the action you're able to take.

Edited: App name changed from Infra UI -> InfraOps
 formgeist
on 24 Sep 2018
formgeist
on 24 Sep 2018
It is called InfraOps now (cc @tbragin to confirm final terminology). Apologies for the moving target!
 skh
on 24 Sep 2018
skh
on 24 Sep 2018
Yes, it is called "InfraOps" see screenshot here: https://github.com/elastic/kibana/issues/23371
 tbragin
on 24 Sep 2018
tbragin
on 24 Sep 2018
@tbragin @skh Thanks for the heads up, I'll update the copy in the screens 👍
formgeist
on 24 Sep 2018
@formgeist Sounds good. We could also have an additional button next to "View transactions".
"[infraops icon] View host" or something like that.
makwarth
on 26 Sep 2018
@makwarth Good point, I'll add that in and update the screen 👍
formgeist
on 26 Sep 2018
Updated the description with screens for adding link next to system.hostname and View host button in the transaction sample header as suggested.
formgeist
on 26 Sep 2018
@formgeist Two of the three buttons take the user out of APM and to other plugins. It could surprise users (and since plugin switching today in Kibana is very slow, a heads up might be nice).
It seems like the verbs ("view", "open") doesn't signify anything. We could use "open" when going to another plugin, and put an emphasis on which plugin eg: "Open in Discover", "Open in Log Viewer" and "View full trace" (stay in APM).
 sqren
on 26 Sep 2018
sqren
on 26 Sep 2018
I understand your concern with taking the user out of the APM context, but having the full written out labels all the time is in my opinion not useful when the user gets used to the actions. Perhaps we can opt to show a small tooltip with the full label? So "View host" becomes "View host in InfraOps", "Open document" becomes "Open document in Discover".
formgeist
on 26 Sep 2018
having the full written out labels all the time is in my opinion not useful when the user gets used to the actions.
Makes sense. If the tooltips doesn't feel too much in the way, I'm cool with that :)
I'm still unsure why we have both "open" and "view". Maybe I'm being too pedantic, but could they be aligned?
"View host" doesn't seem right. Isn't it more "View logs for transaction" (or shorter: "View logs"). We currently just filter by host and timestamp to show the right logs, right? And in the future we could call it "View logs for trace" when we can filter logs by
trace.id(and no longer filter by host and timestamp).
sqren
on 26 Sep 2018
@sqren You're right, logs are better than host. I probably got it mixed up from the description. Re: open vs. view, it was intentionally different because "view..." quickly becomes insignificant when looking at the options nested next to each other, at least in my opinion. But I'm also worried about spelling them out when it comes to spacing between the title on the left, and actions on the right. Perhaps it's better to have a dedicated options context menu for those links, showing that viewing the trace is the primary feature (as part of the APM UI).
_Updated example of having all options shown with full labels_

_New variation with an options menu for the "external" links_

Thoughts?
formgeist
on 26 Sep 2018
I like this, especially the last screenshot where the outgoing links are grouped in a menu. Other places we call it "Integrations" - though I'm not sure that name is much better than "Options".
sqren
on 26 Sep 2018
it sounds like there's some confusion about what exactly the user is going to see when they click the button? In the screenshot @tbragin posted, it looks more like host metrics? the screenshot shows a separate tab for logs.
FWIW I don't like "Integrations" for links that go to other Kibana apps, because for our users Kibana is a big coherent thing. I think it's worth keeping the full labels and not hide them away as long as we can because I think the user experience is better this way. It seems like there's room for it.
 roncohen
on 28 Sep 2018
roncohen
on 28 Sep 2018
it sounds like there's some confusion about what exactly the user is going to see when they click the button? In the screenshot @tbragin posted, it looks more like host metrics?
@roncohen
I can't find the screenshot you mention (can only find this https://github.com/elastic/kibana/pull/23371#issuecomment-423288365) but I would expect the following url app/infra/#/link-to/host-logs/:hostname[?time=${TIMESTAMP}] to take us to the Logs tab - not the host overview.
EDIT: I see the Logs item in the left-hand menu now :) Still, would expect the link to take us there.
sqren
on 28 Sep 2018
I've been thinking about "Actions" as copy for all of our dropdowns. In the dropdown, we can add a "link out" icon in the right hand side of the action item, if the action links to another plugin. This could mean that we can avoid using "open" or "view" etc. altogether. The left hand icon indicates which plugin the action item is about. (apm, ml, watcher, infra, etc)
makwarth
on 28 Sep 2018
In the dropdown, we can add a "link out" icon in the right hand side of the action item, if the action links to another plugin. This could mean that we can avoid using "open" or "view" etc. altogether. The left hand icon indicates which plugin the action item is about. (apm, ml, watcher, infra, etc)
i like that, but I would expect the "Link out" icon to mean that we're leaving Kibana. Maybe it's sufficient to include the icon to the plugins we're linking to? (only have the left hand icon)
roncohen
on 28 Sep 2018
Hm, maybe. I wouldn't worry too much about that. But maybe there's a better icon to indicate context shift. The left icon isn't enough as we don't actually link to ML when we enable the ML integration.
makwarth
on 28 Sep 2018
I'm thoroughly confused about the actual implementation of this now; is it a link to open host metrics in InfraOps or open logs related to the transaction ID in Logs? The title of the issue says host, but the example query link that @makwarth provided is about showing it in Logs (as far as I can tell).
Second, I'm all for clarifying where the links take you. I think we need to be as explicit about it as possible. I'm a little hesitant in going with just showing the options on the page, as we do have a slight real estate problem. Another effect of adding the link options to a dropdown (call it Actions, Options etc.) is that we emphasize the option to go to the full trace (when not on a root transaction). This navigation is going to be the most used IMO, and it's inherent to the APM UI.
We can add the link-out icon (attached) as an added indicator that this link takes out of APM UI context, and put it on the right side as @makwarth suggested.

Quick mock of updating the popover with more explicit links:

formgeist
on 28 Sep 2018
@sqren @roncohen @makwarth @formgeist I think the link @weltenwort provides points to the Logging UI

@simianhacker can comment on whether there is a similar link that will drill in on the Metrics Detail view.

Everything in these screenshots can be looked at in the kibana "feature-infra-ui" branch.
Let us know if a live chat early next week would help hash this out. @weltenwort is currently on vacation, but I suspect @simianhacker can help answer any questions about cross-linking. Would be great to get this integration in!
tbragin
on 28 Sep 2018
The link format for the metric detail page is:
${basePath}/app/infra/#/metrics/${nodeType}/${nodeName}
with the nodeType being
enum InfraNodeType {
  pod,
  host,
  container
}
We are still working on the implementing the time picker but the time argument will be similar to how you link to logs.
 simianhacker
on 28 Sep 2018
simianhacker
on 28 Sep 2018
@tbragin @simianhacker Great. Thanks for the clarification.
So, let's do two new links. Something like:
- [InfraOps icon] View host metrics
- [Logs icon] View host logs
- [Discover icon] View sample document
@formgeist I agree that primary navigation options, like "View full trace", should be outside of the actions-dropdown. I wasn't clear, I only meant to group secondary navigation options in the dropdown.
makwarth
on 1 Oct 2018
@makwarth Updated the example screen to feature the new actions

formgeist
on 1 Oct 2018
LGTM @formgeist, thanks!
makwarth
on 1 Oct 2018
I'm actually going to create a similar link to what @weltenwort gave you. He pointed out that it would work better for the future. I will have that for you today.
simianhacker
on 1 Oct 2018
Here is the new URL:
${basePath}/app/infra/#/link-to/host-detail/${name}
${basePath}/app/infra/#/link-to/pod-detail/${name}
${basePath}/app/infra/#/link-to/container-detail/${name}
Updated design screenshots in the description and moving this to implementation.
formgeist
on 3 Oct 2018
feature-infra-ui branch has now been merged to master https://github.com/elastic/kibana/pull/24068
makwarth
on 17 Oct 2018
@jasonrhodes @formgeist Here's the final links:
Link 1
Copy: "View host metrics (Beta)"
URL: /app/infra#/link-to/host-detail/{name}?to={toTimestamp}&from={fromTimestamp}
{name}being ourcontext.system.hostname.toTimestampbeing timestamp (unix) of sample + 5 min.fromTimestampbeing timestamp (unix) of sample - 5 min.
Link 2
Copy: "View host logs (Beta)"
URL: /app/infra#/link-to/host-logs/{name}?time={toTimestamp}
{name}being ourcontext.system.hostname.toTimestampbeing Timestamp of sample (unix).
makwarth
on 23 Oct 2018
For the host-logs route, the log viewer will try to center it if there are any logs around that time.
 weltenwort
on 23 Oct 2018
weltenwort
on 23 Oct 2018
@weltenwort @simianhacker what format do the from/to/time values need to be in?
 jasonrhodes
on 23 Oct 2018
jasonrhodes
on 23 Oct 2018
sorry, that would be millisecond timestamps
weltenwort
on 23 Oct 2018
Oh sorry, I see the "(unix)" designation in there now. Thanks for confirming, @weltenwort !
jasonrhodes
on 23 Oct 2018
This was completed in #24294
jasonrhodes
on 23 Oct 2018
Related issues
 snide
·
3Comments
snide
·
3Comments
 timroes
·
3Comments
timroes
·
3Comments
 mark54g
·
3Comments
mark54g
·
3Comments
 bradvido
·
3Comments
bradvido
·
3Comments
 LukeMathWalker
·
3Comments
LukeMathWalker
·
3Comments
Most helpful comment
@makwarth Updated the example screen to feature the new actions