kibana show elasticsearch no monitoring data , but exists index in elasticsearch
Kibana version:
6.3.2
Elasticsearch version:
6.3.2
Server OS version:
centos7 3.10.0-514.el7.x86_64
Browser version:
chrome 68
Browser OS version:
Mac os
Original install method (e.g. download page, yum, from source, etc.):
down page
Describe
we use elk for log service , and add x-pack plugin to monitor elasticsearch system, but I acess kibana dashboard, and switch to monitoring, show me
We couldn't activate monitoring
No monitoring data found. Try setting the time filter to "Last 1 hour" or check if data is available for a different time period.

If data is in your cluster, your monitoring dashboards will show up here. I restart kibana, elasticsearch , also show. I can find the monitor index (monitor-es-6-xxxx, monitor-kibana-6-xxxx) in our elasticsearch ? this is bugs ? or hot can i fix this problem , thanks
Screenshots (if relevant):


 kobehaha
All 21 comments
@elastic/kibana-monitoring
 tylersmalley
on 29 Aug 2018
tylersmalley
on 29 Aug 2018
Same issue here, it worked for me until today morning and nothing is changed and now I am getting the same screen
 rpendela
on 29 Aug 2018
rpendela
on 29 Aug 2018
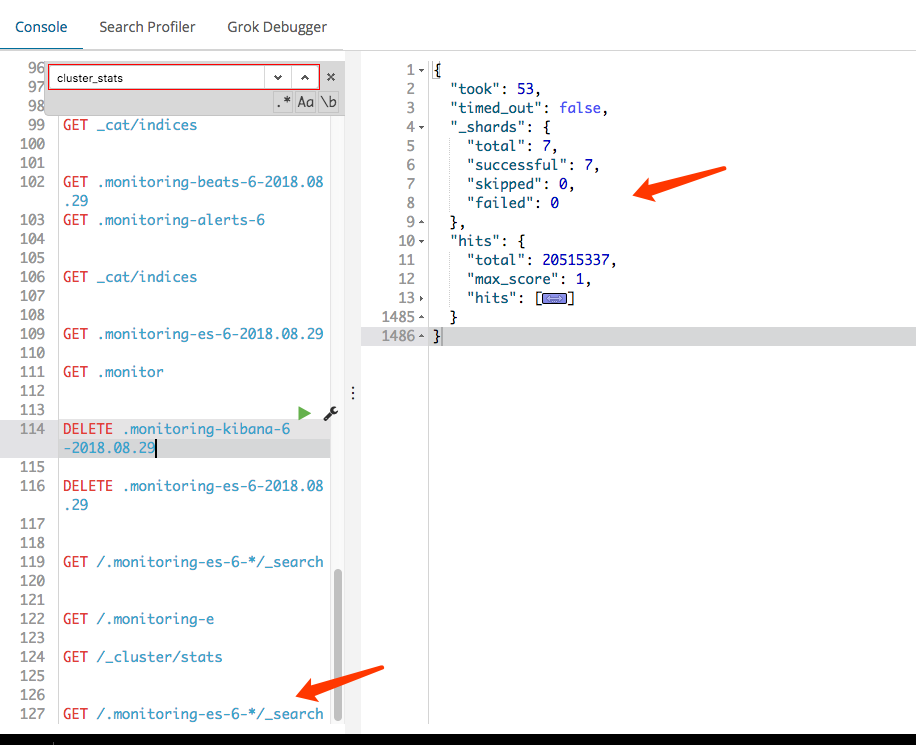
Can you check the response for this request in Console?
GET /.monitoring-es-6-*/_search
{
  "size": 0,
  "query": {
    "term": {
      "type": "cluster_stats"
    }
  },
  "aggs": {
    "group_by_day": {
      "date_histogram": {
        "field": "timestamp",
        "interval": "day"
      }
    }
  }
}
The cluster_stats document is produced by the elected master node of the monitored cluster, and if it's not present the UI does not recognize other data because it needs the cluster_stats to represent the cluster. We're looking at ways to address this issue separately.
If you recently upgraded to 6.3/6.4 from another version before those, you do have to enable xpack.monitoring.collection.enabled by setting it to true within Elasticsearch, but the UI in 6.3+ will do that for you and the screen implies that it has been set.
 pickypg
on 29 Aug 2018
pickypg
on 29 Aug 2018
here you go
{
"took": 146,
"timed_out": false,
"_shards": {
"total": 7,
"successful": 7,
"skipped": 0,
"failed": 0
},
"hits": {
"total": 17590,
"max_score": 0,
"hits": []
},
"aggregations": {
"group_by_day": {
"buckets": [
{
"key_as_string": "2018-08-23T00:00:00.000Z",
"key": 1534982400000,
"doc_count": 1208
},
{
"key_as_string": "2018-08-24T00:00:00.000Z",
"key": 1535068800000,
"doc_count": 2211
},
{
"key_as_string": "2018-08-25T00:00:00.000Z",
"key": 1535155200000,
"doc_count": 3385
},
{
"key_as_string": "2018-08-26T00:00:00.000Z",
"key": 1535241600000,
"doc_count": 4687
},
{
"key_as_string": "2018-08-27T00:00:00.000Z",
"key": 1535328000000,
"doc_count": 4007
},
{
"key_as_string": "2018-08-28T00:00:00.000Z",
"key": 1535414400000,
"doc_count": 1687
},
{
"key_as_string": "2018-08-29T00:00:00.000Z",
"key": 1535500800000,
"doc_count": 405
}
]
}
}
}
Also some errors from my elasticsearch logs,
I am using beats_admin user for X-pack monitoring in beats and I see the message X-pack connected successfully but getting below "Password authentication failed for beats_admin".
elasticsearch_master    | [2018-08-29T22:17:27,514][WARN ][o.e.x.s.a.AuthenticationService] [elk1] Authentication to realm native1 failed - **Password authentication failed for beats_admin**
elasticsearch_master    | [2018-08-29T22:17:33,036][ERROR][o.e.x.m.c.n.NodeStatsCollector] [elk1] collector [node_stats] timed out when collecting data
elasticsearch_master    | [2018-08-29T22:17:43,042][ERROR][o.e.x.m.c.c.ClusterStatsCollector] [elk1] collector [cluster_stats] timed out when collecting data
elasticsearch_master    | [2018-08-29T22:18:19,554][ERROR][o.e.x.m.c.i.IndexStatsCollector] [elk1] collector [index-stats] timed out when collecting data
elasticsearch_master    | [2018-08-29T22:18:19,584][WARN ][o.e.m.j.JvmGcMonitorService] [elk1] [gc][361660] overhead, spent [5.2s] collecting in the last [6.1s]
elasticsearch_master    | [2018-08-29T22:18:29,271][WARN ][o.e.x.s.a.AuthenticationService] [elk1] Authentication to realm active_directory failed - authenticate failed (Caused by LDAPException(resultCode=89 (parameter error), errorMessage='Simple bind operations are not allowed to contain a bind DN without a password.'))
Hi @rpendela, it's hard to say if your issue is the same as the original poster, but its symptom would be: no cluster displayed in the Monitoring UI.
You have a very wild number of cluster_stats per day, even though the number should be fairly stable. Every collection interval (10s by default), we collect the cluster_stats on the elected master and attempt to index that. Multiplying that out, we get 60s / 10s = 6 collections per minute, for every minute of the day. That is 6 * 60m/h * 24h/d = 8,640/d (ignoring a few that may be skipped given elected master changes during rolling upgrades for instance). Only on Sunday did your cluster reach more than half of that, which is probably because it was the least active on that day.
There are a few things that can go wrong in this process depending on your setup:
- The request can timeout if your cluster is over-burdened and unable to respond to the internal
GET /_cluster/statscall within the timeout (10s by default).
- You can see this in your elected master node's logs (
GET /_cat/master?vwill tell you which node is the elected master) by searching forcluster_stats.
- You can see this in your elected master node's logs (
- Particularly when using the local exporter, the default monitoring exporter, it is easy to conflict with other data being indexed and having the entire payload get rejected due to the write threadpool being at/over capacity.
- You can see this in the elected master node's logs by looking for "rejected" relative to the local exporter (which would appear in the stack trace).
In either case, if we are unable to report a cluster_stats document in the selected time range that you try to use for Kibana, then we cannot display that cluster currently. We document the collectors and exporters in a bit of detail, which should hopefully help with debugging the cluster and fixing the root cause of these timeouts / rejections.
pickypg
on 30 Aug 2018
seems erverthing is right .
Indices list

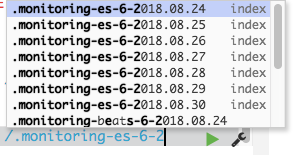
But I can not find cluster_stats field in my result ?
JSON Response

{
"took": 91,
"timed_out": false,
"_shards": {
"total": 7,
"successful": 7,
"skipped": 0,
"failed": 0
},
"hits": {
"total": 20043931,
"max_score": 1,
"hits": [
{
"_index": ".monitoring-es-6-2018.08.24",
"_type": "doc",
"_id": "6xK2amUBKpLO-Zcajtyf",
"_score": 1,
"_source": {
"cluster_uuid": "gKQ6VwEkRxSiZ8eJwXJr3Q",
"timestamp": "2018-08-24T06:54:32.466Z",
"interval_ms": 10000,
"type": "index_stats",
"source_node": {
"uuid": "0kSZrxtxSE-D1WVuIbW5_Q",
"host": "10.0.0.4",
"transport_address": "10.0.0.4:9300",
"ip": "10.0.0.4",
"name": "0kSZrxt",
"timestamp": "2018-08-24T06:54:31.843Z"
},
"index_stats": {
"index": "logstash-pptlog-2018.08.24",
"uuid": "oFtOIQz7RrGhact9Peif8A",
"created": 1535068852936,
"status": "green",
"version": {
"created": "6.3.2",
"upgraded": "6.3.2"
},
"shards": {
"total": 10,
"primaries": 5,
"replicas": 1,
"active_total": 10,
"active_primaries": 5,
"active_replicas": 5,
"unassigned_total": 0,
"unassigned_primaries": 0,
"unassigned_replicas": 0,
"initializing": 0,
"relocating": 0
},
"total": {
"docs": {
"count": 21832
},
"store": {
"size_in_bytes": 22818080
},
"indexing": {
"index_total": 21832,
"index_time_in_millis": 45584,
"throttle_time_in_millis": 0
},
"search": {
"query_total": 40,
"query_time_in_millis": 34
},
"merges": {
"total_size_in_bytes": 1747265598
},
"refresh": {
"total_time_in_millis": 362653
},
"query_cache": {
"memory_size_in_bytes": 0,
"hit_count": 0,
"miss_count": 0,
"evictions": 0
},
"fielddata": {
"memory_size_in_bytes": 0,
"evictions": 0
},
"segments": {
"count": 55,
"memory_in_bytes": 1081476,
"terms_memory_in_bytes": 916221,
"stored_fields_memory_in_bytes": 20992,
"term_vectors_memory_in_bytes": 0,
"norms_memory_in_bytes": 124736,
"points_memory_in_bytes": 2811,
"doc_values_memory_in_bytes": 16716,
"index_writer_memory_in_bytes": 0,
"version_map_memory_in_bytes": 0,
"fixed_bit_set_memory_in_bytes": 0
},
"request_cache": {
"memory_size_in_bytes": 0,
"evictions": 0,
"hit_count": 0,
"miss_count": 40
}
},
"primaries": {
"docs": {
"count": 10916
},
"store": {
"size_in_bytes": 10438028
},
"indexing": {
"index_total": 10916,
"index_time_in_millis": 23368,
"throttle_time_in_millis": 0
},
"search": {
"query_total": 20,
"query_time_in_millis": 28
},
"merges": {
"total_size_in_bytes": 866350226
},
"refresh": {
"total_time_in_millis": 172893
},
"query_cache": {
"memory_size_in_bytes": 0,
"hit_count": 0,
"miss_count": 0,
"evictions": 0
},
"fielddata": {
"memory_size_in_bytes": 0,
"evictions": 0
},
"segments": {
"count": 30,
"memory_in_bytes": 586325,
"terms_memory_in_bytes": 496733,
"stored_fields_memory_in_bytes": 11264,
"term_vectors_memory_in_bytes": 0,
"norms_memory_in_bytes": 67840,
"points_memory_in_bytes": 1456,
"doc_values_memory_in_bytes": 9032,
"index_writer_memory_in_bytes": 0,
"version_map_memory_in_bytes": 0,
"fixed_bit_set_memory_in_bytes": 0
},
"request_cache": {
"memory_size_in_bytes": 0,
"evictions": 0,
"hit_count": 0,
"miss_count": 20
}
}
}
}
},
{
"_index": ".monitoring-es-6-2018.08.24",
"_type": "doc",
"_id": "7BK2amUBKpLO-Zcajtyf",
"_score": 1,
"_source": {
"cluster_uuid": "gKQ6VwEkRxSiZ8eJwXJr3Q",
"timestamp": "2018-08-24T06:54:32.466Z",
"interval_ms": 10000,
"type": "index_stats",
"source_node": {
"uuid": "0kSZrxtxSE-D1WVuIbW5_Q",
"host": "10.0.0.4",
"transport_address": "10.0.0.4:9300",
"ip": "10.0.0.4",
"name": "0kSZrxt",
"timestamp": "2018-08-24T06:54:31.843Z"
},
"index_stats": {
"index": "zwt_nginx_2018.08.19",
"uuid": "RM6AxqrbQdu7SWcBn03Eeg",
"created": 1534684179680,
"status": "green",
"version": {
"created": "6.3.2",
"upgraded": "6.3.2"
},
"shards": {
"total": 10,
"primaries": 5,
"replicas": 1,
"active_total": 10,
"active_primaries": 5,
"active_replicas": 5,
"unassigned_total": 0,
"unassigned_primaries": 0,
"unassigned_replicas": 0,
"initializing": 0,
"relocating": 0
},
"total": {
"docs": {
"count": 4322
},
"store": {
"size_in_bytes": 4951022
},
"indexing": {
"index_total": 0,
"index_time_in_millis": 0,
"throttle_time_in_millis": 0
},
"search": {
"query_total": 75,
"query_time_in_millis": 0
},
"merges": {
"total_size_in_bytes": 0
},
"refresh": {
"total_time_in_millis": 5
},
"query_cache": {
"memory_size_in_bytes": 0,
"hit_count": 0,
"miss_count": 0,
"evictions": 0
},
"fielddata": {
"memory_size_in_bytes": 0,
"evictions": 0
},
"segments": {
"count": 57,
"memory_in_bytes": 811553,
"terms_memory_in_bytes": 672782,
"stored_fields_memory_in_bytes": 18304,
"term_vectors_memory_in_bytes": 0,
"norms_memory_in_bytes": 99264,
"points_memory_in_bytes": 607,
"doc_values_memory_in_bytes": 20596,
"index_writer_memory_in_bytes": 0,
"version_map_memory_in_bytes": 0,
"fixed_bit_set_memory_in_bytes": 0
},
"request_cache": {
"memory_size_in_bytes": 7700,
"evictions": 0,
"hit_count": 60,
"miss_count": 10
}
},
"primaries": {
"docs": {
"count": 2161
},
"store": {
"size_in_bytes": 2648849
},
"indexing": {
"index_total": 0,
"index_time_in_millis": 0,
"throttle_time_in_millis": 0
},
"search": {
"query_total": 36,
"query_time_in_millis": 0
},
"merges": {
"total_size_in_bytes": 0
},
"refresh": {
"total_time_in_millis": 5
},
"query_cache": {
"memory_size_in_bytes": 0,
"hit_count": 0,
"miss_count": 0,
"evictions": 0
},
"fielddata": {
"memory_size_in_bytes": 0,
"evictions": 0
},
"segments": {
"count": 36,
"memory_in_bytes": 516336,
"terms_memory_in_bytes": 429343,
"stored_fields_memory_in_bytes": 11488,
"term_vectors_memory_in_bytes": 0,
"norms_memory_in_bytes": 63552,
"points_memory_in_bytes": 385,
"doc_values_memory_in_bytes": 11568,
"index_writer_memory_in_bytes": 0,
"version_map_memory_in_bytes": 0,
"fixed_bit_set_memory_in_bytes": 0
},
"request_cache": {
"memory_size_in_bytes": 3850,
"evictions": 0,
"hit_count": 30,
"miss_count": 5
}
}
}
}
},
{
"_index": ".monitoring-es-6-2018.08.24",
"_type": "doc",
"_id": "7RK2amUBKpLO-Zcajtyf",
"_score": 1,
"_source": {
"cluster_uuid": "gKQ6VwEkRxSiZ8eJwXJr3Q",
"timestamp": "2018-08-24T06:54:32.466Z",
"interval_ms": 10000,
"type": "index_stats",
"source_node": {
"uuid": "0kSZrxtxSE-D1WVuIbW5_Q",
"host": "10.0.0.4",
"transport_address": "10.0.0.4:9300",
"ip": "10.0.0.4",
"name": "0kSZrxt",
"timestamp": "2018-08-24T06:54:31.843Z"
},
"index_stats": {
"index": "logstash-event-nsq-2018.08.18",
"uuid": "MuSsoHFXRIGkcQ-pcAnR1g",
"created": 1534550404683,
"status": "green",
"version": {
"created": "6.3.2",
"upgraded": "6.3.2"
},
"shards": {
"total": 10,
"primaries": 5,
"replicas": 1,
"active_total": 10,
"active_primaries": 5,
"active_replicas": 5,
"unassigned_total": 0,
"unassigned_primaries": 0,
"unassigned_replicas": 0,
"initializing": 0,
"relocating": 0
},
"total": {
"docs": {
"count": 37165226
},
"store": {
"size_in_bytes": 28477121402
},
"indexing": {
"index_total": 0,
"index_time_in_millis": 0,
"throttle_time_in_millis": 0
},
"search": {
"query_total": 480,
"query_time_in_millis": 323202
},
"merges": {
"total_size_in_bytes": 0
},
"refresh": {
"total_time_in_millis": 0
},
"query_cache": {
"memory_size_in_bytes": 0,
"hit_count": 0,
"miss_count": 78866,
"evictions": 0
},
"fielddata": {
"memory_size_in_bytes": 144832,
"evictions": 0
},
"segments": {
"count": 281,
"memory_in_bytes": 45472756,
"terms_memory_in_bytes": 33938870,
"stored_fields_memory_in_bytes": 8367528,
"term_vectors_memory_in_bytes": 0,
"norms_memory_in_bytes": 1030592,
"points_memory_in_bytes": 1667666,
"doc_values_memory_in_bytes": 468100,
"index_writer_memory_in_bytes": 0,
"version_map_memory_in_bytes": 0,
"fixed_bit_set_memory_in_bytes": 0
},
"request_cache": {
"memory_size_in_bytes": 17425,
"evictions": 0,
"hit_count": 105,
"miss_count": 20
}
},
"primaries": {
"docs": {
"count": 18582613
},
"store": {
"size_in_bytes": 14239596892
},
"indexing": {
"index_total": 0,
"index_time_in_millis": 0,
"throttle_time_in_millis": 0
},
"search": {
"query_total": 235,
"query_time_in_millis": 161521
},
"merges": {
"total_size_in_bytes": 0
},
"refresh": {
"total_time_in_millis": 0
},
"query_cache": {
"memory_size_in_bytes": 0,
"hit_count": 0,
"miss_count": 41652,
"evictions": 0
},
"fielddata": {
"memory_size_in_bytes": 118040,
"evictions": 0
},
"segments": {
"count": 137,
"memory_in_bytes": 22786029,
"terms_memory_in_bytes": 16988349,
"stored_fields_memory_in_bytes": 4183728,
"term_vectors_memory_in_bytes": 0,
"norms_memory_in_bytes": 508992,
"points_memory_in_bytes": 834612,
"doc_values_memory_in_bytes": 270348,
"index_writer_memory_in_bytes": 0,
"version_map_memory_in_bytes": 0,
"fixed_bit_set_memory_in_bytes": 0
},
"request_cache": {
"memory_size_in_bytes": 11603,
"evictions": 0,
"hit_count": 53,
"miss_count": 13
}
}
}
}
},
{
"_index": ".monitoring-es-6-2018.08.24",
"_type": "doc",
"_id": "7hK2amUBKpLO-Zcajtyf",
"_score": 1,
"_source": {
"cluster_uuid": "gKQ6VwEkRxSiZ8eJwXJr3Q",
"timestamp": "2018-08-24T06:54:32.466Z",
"interval_ms": 10000,
"type": "index_stats",
"source_node": {
"uuid": "0kSZrxtxSE-D1WVuIbW5_Q",
"host": "10.0.0.4",
"transport_address": "10.0.0.4:9300",
"ip": "10.0.0.4",
"name": "0kSZrxt",
"timestamp": "2018-08-24T06:54:31.843Z"
},
"index_stats": {
"index": "logstash-event-nsq-2018.08.19",
"uuid": "hUlbnsS_QNi9eAvL-iCXGg",
"created": 1534636800951,
"status": "green",
"version": {
"created": "6.3.2",
"upgraded": "6.3.2"
},
"shards": {
"total": 10,
"primaries": 5,
"replicas": 1,
"active_total": 10,
"active_primaries": 5,
"active_replicas": 5,
"unassigned_total": 0,
"unassigned_primaries": 0,
"unassigned_replicas": 0,
"initializing": 0,
"relocating": 0
},
"total": {
"docs": {
"count": 32593954
},
"store": {
"size_in_bytes": 24846298401
},
"indexing": {
"index_total": 0,
"index_time_in_millis": 0,
"throttle_time_in_millis": 0
},
"search": {
"query_total": 480,
"query_time_in_millis": 300012
},
"merges": {
"total_size_in_bytes": 0
},
"refresh": {
"total_time_in_millis": 0
},
"query_cache": {
"memory_size_in_bytes": 0,
"hit_count": 0,
"miss_count": 101498,
"evictions": 0
},
"fielddata": {
"memory_size_in_bytes": 150416,
"evictions": 0
},
"segments": {
"count": 275,
"memory_in_bytes": 41196135,
"terms_memory_in_bytes": 30882970,
"stored_fields_memory_in_bytes": 7291760,
"term_vectors_memory_in_bytes": 0,
"norms_memory_in_bytes": 1044608,
"points_memory_in_bytes": 1465465,
"doc_values_memory_in_bytes": 511332,
"index_writer_memory_in_bytes": 0,
"version_map_memory_in_bytes": 0,
"fixed_bit_set_memory_in_bytes": 0
},
"request_cache": {
"memory_size_in_bytes": 17425,
"evictions": 0,
"hit_count": 105,
"miss_count": 20
}
},
"primaries": {
"docs": {
"count": 16296977
},
"store": {
"size_in_bytes": 12436699872
},
"indexing": {
"index_total": 0,
"index_time_in_millis": 0,
"throttle_time_in_millis": 0
},
"search": {
"query_total": 251,
"query_time_in_millis": 190111
},
"merges": {
"total_size_in_bytes": 0
},
"refresh": {
"total_time_in_millis": 0
},
"query_cache": {
"memory_size_in_bytes": 0,
"hit_count": 0,
"miss_count": 54157,
"evictions": 0
},
"fielddata": {
"memory_size_in_bytes": 123712,
"evictions": 0
},
"segments": {
"count": 142,
"memory_in_bytes": 20905705,
"terms_memory_in_bytes": 15714882,
"stored_fields_memory_in_bytes": 3648952,
"term_vectors_memory_in_bytes": 0,
"norms_memory_in_bytes": 535744,
"points_memory_in_bytes": 732575,
"doc_values_memory_in_bytes": 273552,
"index_writer_memory_in_bytes": 0,
"version_map_memory_in_bytes": 0,
"fixed_bit_set_memory_in_bytes": 0
},
"request_cache": {
"memory_size_in_bytes": 11603,
"evictions": 0,
"hit_count": 52,
"miss_count": 13
}
}
}
}
},
{
"_index": ".monitoring-es-6-2018.08.24",
"_type": "doc",
"_id": "7xK2amUBKpLO-Zcajtyf",
"_score": 1,
"_source": {
"cluster_uuid": "gKQ6VwEkRxSiZ8eJwXJr3Q",
"timestamp": "2018-08-24T06:54:32.466Z",
"interval_ms": 10000,
"type": "index_stats",
"source_node": {
"uuid": "0kSZrxtxSE-D1WVuIbW5_Q",
"host": "10.0.0.4",
"transport_address": "10.0.0.4:9300",
"ip": "10.0.0.4",
"name": "0kSZrxt",
"timestamp": "2018-08-24T06:54:31.843Z"
},
"index_stats": {
"index": "logstash-event-nsq-2018.08.15",
"uuid": "rfJUEoyLSzSSet3yBCiMIQ",
"created": 1534352014414,
"status": "green",
"version": {
"created": "6.3.2",
"upgraded": "6.3.2"
},
"shards": {
"total": 10,
"primaries": 5,
"replicas": 1,
"active_total": 10,
"active_primaries": 5,
"active_replicas": 5,
"unassigned_total": 0,
"unassigned_primaries": 0,
"unassigned_replicas": 0,
"initializing": 0,
"relocating": 0
},
"total": {
"docs": {
"count": 20231194
},
"store": {
"size_in_bytes": 13779111856
},
"indexing": {
"index_total": 0,
"index_time_in_millis": 0,
"throttle_time_in_millis": 0
},
"search": {
"query_total": 480,
"query_time_in_millis": 47629
},
"merges": {
"total_size_in_bytes": 0
},
"refresh": {
"total_time_in_millis": 9
},
"query_cache": {
"memory_size_in_bytes": 0,
"hit_count": 0,
"miss_count": 5207,
"evictions": 0
},
"fielddata": {
"memory_size_in_bytes": 71952,
"evictions": 0
},
"segments": {
"count": 229,
"memory_in_bytes": 26773859,
"terms_memory_in_bytes": 21198592,
"stored_fields_memory_in_bytes": 4270992,
"term_vectors_memory_in_bytes": 0,
"norms_memory_in_bytes": 0,
"points_memory_in_bytes": 925055,
"doc_values_memory_in_bytes": 379220,
"index_writer_memory_in_bytes": 0,
"version_map_memory_in_bytes": 0,
"fixed_bit_set_memory_in_bytes": 0
},
"request_cache": {
"memory_size_in_bytes": 13571,
"evictions": 0,
"hit_count": 105,
"miss_count": 20
}
},
"primaries": {
"docs": {
"count": 10115597
},
"store": {
"size_in_bytes": 6834523444
},
"indexing": {
"index_total": 0,
"index_time_in_millis": 0,
"throttle_time_in_millis": 0
},
"search": {
"query_total": 254,
"query_time_in_millis": 37489
},
"merges": {
"total_size_in_bytes": 0
},
"refresh": {
"total_time_in_millis": 0
},
"query_cache": {
"memory_size_in_bytes": 0,
"hit_count": 0,
"miss_count": 1966,
"evictions": 0
},
"fielddata": {
"memory_size_in_bytes": 71952,
"evictions": 0
},
"segments": {
"count": 111,
"memory_in_bytes": 13070975,
"terms_memory_in_bytes": 10291217,
"stored_fields_memory_in_bytes": 2135552,
"term_vectors_memory_in_bytes": 0,
"norms_memory_in_bytes": 0,
"points_memory_in_bytes": 459794,
"doc_values_memory_in_bytes": 184412,
"index_writer_memory_in_bytes": 0,
"version_map_memory_in_bytes": 0,
"fixed_bit_set_memory_in_bytes": 0
},
"request_cache": {
"memory_size_in_bytes": 9676,
"evictions": 0,
"hit_count": 53,
"miss_count": 15
}
}
}
}
},
{
"_index": ".monitoring-es-6-2018.08.24",
"_type": "doc",
"_id": "8BK2amUBKpLO-Zcajtyf",
"_score": 1,
"_source": {
"cluster_uuid": "gKQ6VwEkRxSiZ8eJwXJr3Q",
"timestamp": "2018-08-24T06:54:32.466Z",
"interval_ms": 10000,
"type": "index_stats",
"source_node": {
"uuid": "0kSZrxtxSE-D1WVuIbW5_Q",
"host": "10.0.0.4",
"transport_address": "10.0.0.4:9300",
"ip": "10.0.0.4",
"name": "0kSZrxt",
"timestamp": "2018-08-24T06:54:31.843Z"
},
"index_stats": {
"index": "logstash-event-nsq-2018.08.16",
"uuid": "k7pio5kETnKaFbK9nUXgvQ",
"created": 1534377603618,
"status": "green",
"version": {
"created": "6.3.2",
"upgraded": "6.3.2"
},
"shards": {
"total": 10,
"primaries": 5,
"replicas": 1,
"active_total": 10,
"active_primaries": 5,
"active_replicas": 5,
"unassigned_total": 0,
"unassigned_primaries": 0,
"unassigned_replicas": 0,
"initializing": 0,
"relocating": 0
},
"total": {
"docs": {
"count": 46004816
},
"store": {
"size_in_bytes": 34482072880
},
"indexing": {
"index_total": 0,
"index_time_in_millis": 0,
"throttle_time_in_millis": 0
},
"search": {
"query_total": 477,
"query_time_in_millis": 47965
},
"merges": {
"total_size_in_bytes": 0
},
"refresh": {
"total_time_in_millis": 0
},
"query_cache": {
"memory_size_in_bytes": 0,
"hit_count": 0,
"miss_count": 5399,
"evictions": 0
},
"fielddata": {
"memory_size_in_bytes": 141064,
"evictions": 0
},
"segments": {
"count": 257,
"memory_in_bytes": 52199858,
"terms_memory_in_bytes": 39236944,
"stored_fields_memory_in_bytes": 10281896,
"term_vectors_memory_in_bytes": 0,
"norms_memory_in_bytes": 0,
"points_memory_in_bytes": 2164534,
"doc_values_memory_in_bytes": 516484,
"index_writer_memory_in_bytes": 0,
"version_map_memory_in_bytes": 0,
"fixed_bit_set_memory_in_bytes": 0
},
"request_cache": {
"memory_size_in_bytes": 15498,
"evictions": 0,
"hit_count": 105,
"miss_count": 18
}
},
"primaries": {
"docs": {
"count": 23002408
},
"store": {
"size_in_bytes": 17297028222
},
"indexing": {
"index_total": 0,
"index_time_in_millis": 0,
"throttle_time_in_millis": 0
},
"search": {
"query_total": 227,
"query_time_in_millis": 35912
},
"merges": {
"total_size_in_bytes": 0
},
"refresh": {
"total_time_in_millis": 0
},
"query_cache": {
"memory_size_in_bytes": 0,
"hit_count": 0,
"miss_count": 3785,
"evictions": 0
},
"fielddata": {
"memory_size_in_bytes": 141064,
"evictions": 0
},
"segments": {
"count": 125,
"memory_in_bytes": 26014756,
"terms_memory_in_bytes": 19573081,
"stored_fields_memory_in_bytes": 5142336,
"term_vectors_memory_in_bytes": 0,
"norms_memory_in_bytes": 0,
"points_memory_in_bytes": 1087095,
"doc_values_memory_in_bytes": 212244,
"index_writer_memory_in_bytes": 0,
"version_map_memory_in_bytes": 0,
"fixed_bit_set_memory_in_bytes": 0
},
"request_cache": {
"memory_size_in_bytes": 11603,
"evictions": 0,
"hit_count": 54,
"miss_count": 13
}
}
}
}
},
{
"_index": ".monitoring-es-6-2018.08.24",
"_type": "doc",
"_id": "8RK2amUBKpLO-Zcajtyf",
"_score": 1,
"_source": {
"cluster_uuid": "gKQ6VwEkRxSiZ8eJwXJr3Q",
"timestamp": "2018-08-24T06:54:32.466Z",
"interval_ms": 10000,
"type": "index_stats",
"source_node": {
"uuid": "0kSZrxtxSE-D1WVuIbW5_Q",
"host": "10.0.0.4",
"transport_address": "10.0.0.4:9300",
"ip": "10.0.0.4",
"name": "0kSZrxt",
"timestamp": "2018-08-24T06:54:31.843Z"
},
"index_stats": {
"index": "logstash-event-nsq-2018.08.17",
"uuid": "Ns04tXHaQ96SNeHLxhjVkA",
"created": 1534464001634,
"status": "green",
"version": {
"created": "6.3.2",
"upgraded": "6.3.2"
},
"shards": {
"total": 10,
"primaries": 5,
"replicas": 1,
"active_total": 10,
"active_primaries": 5,
"active_replicas": 5,
"unassigned_total": 0,
"unassigned_primaries": 0,
"unassigned_replicas": 0,
"initializing": 0,
"relocating": 0
},
"total": {
"docs": {
"count": 45553178
},
"store": {
"size_in_bytes": 33401977291
},
"indexing": {
"index_total": 0,
"index_time_in_millis": 0,
"throttle_time_in_millis": 0
},
"search": {
"query_total": 480,
"query_time_in_millis": 51483
},
"merges": {
"total_size_in_bytes": 0
},
"refresh": {
"total_time_in_millis": 0
},
"query_cache": {
"memory_size_in_bytes": 0,
"hit_count": 0,
"miss_count": 7261,
"evictions": 0
},
"fielddata": {
"memory_size_in_bytes": 154400,
"evictions": 0
},
"segments": {
"count": 267,
"memory_in_bytes": 50913351,
"terms_memory_in_bytes": 37961146,
"stored_fields_memory_in_bytes": 10200352,
"term_vectors_memory_in_bytes": 0,
"norms_memory_in_bytes": 0,
"points_memory_in_bytes": 2129641,
"doc_values_memory_in_bytes": 622212,
"index_writer_memory_in_bytes": 0,
"version_map_memory_in_bytes": 0,
"fixed_bit_set_memory_in_bytes": 0
},
"request_cache": {
"memory_size_in_bytes": 17425,
"evictions": 0,
"hit_count": 105,
"miss_count": 20
}
},
"primaries": {
"docs": {
"count": 22776589
},
"store": {
"size_in_bytes": 16674117643
},
"indexing": {
"index_total": 0,
"index_time_in_millis": 0,
"throttle_time_in_millis": 0
},
"search": {
"query_total": 234,
"query_time_in_millis": 38926
},
"merges": {
"total_size_in_bytes": 0
},
"refresh": {
"total_time_in_millis": 0
},
"query_cache": {
"memory_size_in_bytes": 0,
"hit_count": 0,
"miss_count": 4192,
"evictions": 0
},
"fielddata": {
"memory_size_in_bytes": 124344,
"evictions": 0
},
"segments": {
"count": 133,
"memory_in_bytes": 25332585,
"terms_memory_in_bytes": 18872238,
"stored_fields_memory_in_bytes": 5095384,
"term_vectors_memory_in_bytes": 0,
"norms_memory_in_bytes": 0,
"points_memory_in_bytes": 1060783,
"doc_values_memory_in_bytes": 304180,
"index_writer_memory_in_bytes": 0,
"version_map_memory_in_bytes": 0,
"fixed_bit_set_memory_in_bytes": 0
},
"request_cache": {
"memory_size_in_bytes": 11603,
"evictions": 0,
"hit_count": 52,
"miss_count": 13
}
}
}
}
},
{
"_index": ".monitoring-es-6-2018.08.24",
"_type": "doc",
"_id": "8hK2amUBKpLO-Zcajtyf",
"_score": 1,
"_source": {
"cluster_uuid": "gKQ6VwEkRxSiZ8eJwXJr3Q",
"timestamp": "2018-08-24T06:54:32.466Z",
"interval_ms": 10000,
"type": "index_stats",
"source_node": {
"uuid": "0kSZrxtxSE-D1WVuIbW5_Q",
"host": "10.0.0.4",
"transport_address": "10.0.0.4:9300",
"ip": "10.0.0.4",
"name": "0kSZrxt",
"timestamp": "2018-08-24T06:54:31.843Z"
},
"index_stats": {
"index": "logstash-pptlog-2018.08.16",
"uuid": "uvQQiU7kQxiJu4sdyl8UNg",
"created": 1534377621968,
"status": "green",
"version": {
"created": "6.3.2",
"upgraded": "6.3.2"
},
"shards": {
"total": 10,
"primaries": 5,
"replicas": 1,
"active_total": 10,
"active_primaries": 5,
"active_replicas": 5,
"unassigned_total": 0,
"unassigned_primaries": 0,
"unassigned_replicas": 0,
"initializing": 0,
"relocating": 0
},
"total": {
"docs": {
"count": 97624
},
"store": {
"size_in_bytes": 74558052
},
"indexing": {
"index_total": 0,
"index_time_in_millis": 0,
"throttle_time_in_millis": 0
},
"search": {
"query_total": 115,
"query_time_in_millis": 1
},
"merges": {
"total_size_in_bytes": 0
},
"refresh": {
"total_time_in_millis": 0
},
"query_cache": {
"memory_size_in_bytes": 0,
"hit_count": 0,
"miss_count": 0,
"evictions": 0
},
"fielddata": {
"memory_size_in_bytes": 0,
"evictions": 0
},
"segments": {
"count": 46,
"memory_in_bytes": 926836,
"terms_memory_in_bytes": 854231,
"stored_fields_memory_in_bytes": 38320,
"term_vectors_memory_in_bytes": 0,
"norms_memory_in_bytes": 0,
"points_memory_in_bytes": 6853,
"doc_values_memory_in_bytes": 27432,
"index_writer_memory_in_bytes": 0,
"version_map_memory_in_bytes": 0,
"fixed_bit_set_memory_in_bytes": 0
},
"request_cache": {
"memory_size_in_bytes": 7760,
"evictions": 0,
"hit_count": 105,
"miss_count": 10
}
},
"primaries": {
"docs": {
"count": 48812
},
"store": {
"size_in_bytes": 37344060
},
"indexing": {
"index_total": 0,
"index_time_in_millis": 0,
"throttle_time_in_millis": 0
},
"search": {
"query_total": 57,
"query_time_in_millis": 0
},
"merges": {
"total_size_in_bytes": 0
},
"refresh": {
"total_time_in_millis": 0
},
"query_cache": {
"memory_size_in_bytes": 0,
"hit_count": 0,
"miss_count": 0,
"evictions": 0
},
"fielddata": {
"memory_size_in_bytes": 0,
"evictions": 0
},
"segments": {
"count": 25,
"memory_in_bytes": 495988,
"terms_memory_in_bytes": 458634,
"stored_fields_memory_in_bytes": 19736,
"term_vectors_memory_in_bytes": 0,
"norms_memory_in_bytes": 0,
"points_memory_in_bytes": 3470,
"doc_values_memory_in_bytes": 14148,
"index_writer_memory_in_bytes": 0,
"version_map_memory_in_bytes": 0,
"fixed_bit_set_memory_in_bytes": 0
},
"request_cache": {
"memory_size_in_bytes": 3880,
"evictions": 0,
"hit_count": 52,
"miss_count": 5
}
}
}
}
},
{
"_index": ".monitoring-es-6-2018.08.24",
"_type": "doc",
"_id": "8xK2amUBKpLO-Zcajtyf",
"_score": 1,
"_source": {
"cluster_uuid": "gKQ6VwEkRxSiZ8eJwXJr3Q",
"timestamp": "2018-08-24T06:54:32.466Z",
"interval_ms": 10000,
"type": "index_stats",
"source_node": {
"uuid": "0kSZrxtxSE-D1WVuIbW5_Q",
"host": "10.0.0.4",
"transport_address": "10.0.0.4:9300",
"ip": "10.0.0.4",
"name": "0kSZrxt",
"timestamp": "2018-08-24T06:54:31.843Z"
},
"index_stats": {
"index": "logstash-event-nsq-2018.08.21",
"uuid": "iYrhYCghStuHla1jUeMFYg",
"created": 1534809604742,
"status": "green",
"version": {
"created": "6.3.2",
"upgraded": "6.3.2"
},
"shards": {
"total": 10,
"primaries": 5,
"replicas": 1,
"active_total": 10,
"active_primaries": 5,
"active_replicas": 5,
"unassigned_total": 0,
"unassigned_primaries": 0,
"unassigned_replicas": 0,
"initializing": 0,
"relocating": 0
},
"total": {
"docs": {
"count": 47997590
},
"store": {
"size_in_bytes": 36572901724
},
"indexing": {
"index_total": 47997590,
"index_time_in_millis": 47582844,
"throttle_time_in_millis": 0
},
"search": {
"query_total": 365,
"query_time_in_millis": 268882
},
"merges": {
"total_size_in_bytes": 415261748789
},
"refresh": {
"total_time_in_millis": 46276448
},
"query_cache": {
"memory_size_in_bytes": 2263508,
"hit_count": 258,
"miss_count": 194202,
"evictions": 29
},
"fielddata": {
"memory_size_in_bytes": 0,
"evictions": 0
},
"segments": {
"count": 263,
"memory_in_bytes": 56909243,
"terms_memory_in_bytes": 42495192,
"stored_fields_memory_in_bytes": 10744840,
"term_vectors_memory_in_bytes": 0,
"norms_memory_in_bytes": 999104,
"points_memory_in_bytes": 2133823,
"doc_values_memory_in_bytes": 536284,
"index_writer_memory_in_bytes": 0,
"version_map_memory_in_bytes": 0,
"fixed_bit_set_memory_in_bytes": 0
},
"request_cache": {
"memory_size_in_bytes": 7790,
"evictions": 0,
"hit_count": 59,
"miss_count": 41
}
},
"primaries": {
"docs": {
"count": 23998795
},
"store": {
"size_in_bytes": 18322500731
},
"indexing": {
"index_total": 23998795,
"index_time_in_millis": 24789248,
"throttle_time_in_millis": 0
},
"search": {
"query_total": 232,
"query_time_in_millis": 190012
},
"merges": {
"total_size_in_bytes": 208273619150
},
"refresh": {
"total_time_in_millis": 23770414
},
"query_cache": {
"memory_size_in_bytes": 1107297,
"hit_count": 200,
"miss_count": 135182,
"evictions": 23
},
"fielddata": {
"memory_size_in_bytes": 0,
"evictions": 0
},
"segments": {
"count": 126,
"memory_in_bytes": 28551565,
"terms_memory_in_bytes": 21330268,
"stored_fields_memory_in_bytes": 5371752,
"term_vectors_memory_in_bytes": 0,
"norms_memory_in_bytes": 487808,
"points_memory_in_bytes": 1068257,
"doc_values_memory_in_bytes": 293480,
"index_writer_memory_in_bytes": 0,
"version_map_memory_in_bytes": 0,
"fixed_bit_set_memory_in_bytes": 0
},
"request_cache": {
"memory_size_in_bytes": 3895,
"evictions": 0,
"hit_count": 29,
"miss_count": 21
}
}
}
}
},
{
"_index": ".monitoring-es-6-2018.08.24",
"_type": "doc",
"_id": "9BK2amUBKpLO-Zcajtyf",
"_score": 1,
"_source": {
"cluster_uuid": "gKQ6VwEkRxSiZ8eJwXJr3Q",
"timestamp": "2018-08-24T06:54:32.466Z",
"interval_ms": 10000,
"type": "index_stats",
"source_node": {
"uuid": "0kSZrxtxSE-D1WVuIbW5_Q",
"host": "10.0.0.4",
"transport_address": "10.0.0.4:9300",
"ip": "10.0.0.4",
"name": "0kSZrxt",
"timestamp": "2018-08-24T06:54:31.843Z"
},
"index_stats": {
"index": "logstash-event-nsq-2018.08.22",
"uuid": "0lDexhACR9WpQVR0ickAiw",
"created": 1534896003054,
"status": "green",
"version": {
"created": "6.3.2",
"upgraded": "6.3.2"
},
"shards": {
"total": 10,
"primaries": 5,
"replicas": 1,
"active_total": 10,
"active_primaries": 5,
"active_replicas": 5,
"unassigned_total": 0,
"unassigned_primaries": 0,
"unassigned_replicas": 0,
"initializing": 0,
"relocating": 0
},
"total": {
"docs": {
"count": 46747608
},
"store": {
"size_in_bytes": 35384598403
},
"indexing": {
"index_total": 46747607,
"index_time_in_millis": 60136166,
"throttle_time_in_millis": 0
},
"search": {
"query_total": 200,
"query_time_in_millis": 283293
},
"merges": {
"total_size_in_bytes": 400953691704
},
"refresh": {
"total_time_in_millis": 50832211
},
"query_cache": {
"memory_size_in_bytes": 0,
"hit_count": 0,
"miss_count": 96937,
"evictions": 0
},
"fielddata": {
"memory_size_in_bytes": 0,
"evictions": 0
},
"segments": {
"count": 271,
"memory_in_bytes": 55074567,
"terms_memory_in_bytes": 41115725,
"stored_fields_memory_in_bytes": 10355192,
"term_vectors_memory_in_bytes": 0,
"norms_memory_in_bytes": 1027008,
"points_memory_in_bytes": 2080102,
"doc_values_memory_in_bytes": 496540,
"index_writer_memory_in_bytes": 0,
"version_map_memory_in_bytes": 0,
"fixed_bit_set_memory_in_bytes": 0
},
"request_cache": {
"memory_size_in_bytes": 7790,
"evictions": 0,
"hit_count": 35,
"miss_count": 15
}
},
"primaries": {
"docs": {
"count": 23373804
},
"store": {
"size_in_bytes": 17660564456
},
"indexing": {
"index_total": 23373804,
"index_time_in_millis": 31261159,
"throttle_time_in_millis": 0
},
"search": {
"query_total": 70,
"query_time_in_millis": 85189
},
"merges": {
"total_size_in_bytes": 203084978636
},
"refresh": {
"total_time_in_millis": 25965487
},
"query_cache": {
"memory_size_in_bytes": 0,
"hit_count": 0,
"miss_count": 24771,
"evictions": 0
},
"fielddata": {
"memory_size_in_bytes": 0,
"evictions": 0
},
"segments": {
"count": 138,
"memory_in_bytes": 27458762,
"terms_memory_in_bytes": 20433890,
"stored_fields_memory_in_bytes": 5177512,
"term_vectors_memory_in_bytes": 0,
"norms_memory_in_bytes": 521664,
"points_memory_in_bytes": 1038400,
"doc_values_memory_in_bytes": 287296,
"index_writer_memory_in_bytes": 0,
"version_map_memory_in_bytes": 0,
"fixed_bit_set_memory_in_bytes": 0
},
"request_cache": {
"memory_size_in_bytes": 3895,
"evictions": 0,
"hit_count": 16,
"miss_count": 9
}
}
}
}
}
]
}
}
And cluster status show right ,

kobehaha
on 30 Aug 2018
@kobehaha
Can you run this query instead? Running without the body will fetch 10 arbitrary documents from the index, so it won’t be consistently helpful here.
GET /.monitoring-es-6-*/_search
{
  "size": 0,
  "query": {
    "term": {
      "type": "cluster_stats"
    }
  },
  "aggs": {
    "group_by_day": {
      "date_histogram": {
        "field": "timestamp",
        "interval": "day"
      }
    }
  }
}
Thanks. I suspect you’re running into the same issue as the other user here though, but we’ll see.
pickypg
on 30 Aug 2018
Thanks for you reply, and I run GET /.monitoring-es-6-*/_search , get result below , How can i fix this problem. ?
kobehaha
on 30 Aug 2018
@kobehaha
You are using this query
GET /.monitoring-es-6-*/_search
which is equivalent to
GET /.monitoring-es-6-*/_search
{
  "size": 10,
  "query": {
    "match_all": { }
  }
}
I would like you to run this query:
GET /.monitoring-es-6-*/_search
{
  "size": 0,
  "query": {
    "term": {
      "type": "cluster_stats"
    }
  },
  "aggs": {
    "group_by_day": {
      "date_histogram": {
        "field": "timestamp",
        "interval": "day"
      }
    }
  }
}
I edited your previous post to hide the large amount of data so that it's easier to scroll through this issue when you respond next.
pickypg
on 30 Aug 2018
@pickypg Thanks for your reply and I fixed my issue, looks like large number of shards is the cause for my issue , I took backup and removed some shards then it started working.
But, I would like to know about that you said I have wild number of cluster_stats, what does that mean?, Is that going to be a problem?
rpendela
on 30 Aug 2018
But, I would like to know about that you said I have wild number of cluster_stats, what does that mean?, Is that going to be a problem?
It sounds like it will not be a problem moving forward, as long as you continue to curate your cluster's data.
The only "problem" that it creates is gaps in the data (and thus UI). When there are long gaps, such as the missing day of data, then the UI cannot even recognize the cluster to show anything and that's when the real problems begin. If there are sporadic gaps (e.g., one every few hours or even minutes), then it just means there may be a gap on a chart.
pickypg
on 31 Aug 2018
@pickypg
sorry to misunderstanding what you mean
I query
GET /.monitoring-es-6-*/_search
{
  "size": 0,
  "query": {
    "term": {
      "type": "cluster_stats"
    }
  },
  "aggs": {
    "group_by_day": {
      "date_histogram": {
        "field": "timestamp",
        "interval": "day"
      }
    }
  }
}
and result below, but i fresh query, took field change, 0 - 40


kobehaha
on 31 Aug 2018
No worries. The took was so fast because nothing matched. Nothing matched because there appear to be no cluster_stats documents.
Based on the amount of other documents, I suspect that you are facing the same problem as the other user: namely that you have too many shards in your cluster. Assuming that you have daily indices, it is probably time to look into snapshotting the oldest indices and removing them, or otherwise cleaning up your data (that’s up to you).
The main story here is that you need to figure out what is causing cluster_stats to time out, which is generally caused by an unhealthy number of _segments_ and that generally implies too many shards.
pickypg
on 31 Aug 2018
Since this is an issue with cleaning up clusters, I am going to close out this issue.
pickypg
on 4 Sep 2018
I had a similar issue today which was fixed by restarting the master node that was elected as a master at that time. I really don't know what was the root cause. Once a new master was elected, the issue went away immidietly.
Master reported the following:
[2018-09-10T15:41:32,894][DEBUG][o.e.a.a.c.n.s.TransportNodesStatsAction] [servername.domainname] failed to execute on node [l2ebevTfTsmfV-T7dQB8zQ]
org.elasticsearch.transport.ReceiveTimeoutTransportException: [servername.domainname][10.15.79.74:9300][cluster:monitor/nodes/stats[n]] request_id [116489955] timed out after [15000ms]
        at org.elasticsearch.transport.TransportService$TimeoutHandler.run(TransportService.java:979) [elasticsearch-6.3.0.jar:6.3.0]
        at org.elasticsearch.common.util.concurrent.ThreadContext$ContextPreservingRunnable.run(ThreadContext.java:625) [elasticsearch-6.3.0.jar:6.3.0]
        at java.util.concurrent.ThreadPoolExecutor.runWorker(ThreadPoolExecutor.java:1149) [?:1.8.0_171]
        at java.util.concurrent.ThreadPoolExecutor$Worker.run(ThreadPoolExecutor.java:624) [?:1.8.0_171]
        at java.lang.Thread.run(Thread.java:748) [?:1.8.0_171]
 alpaca4j
on 10 Sep 2018
alpaca4j
on 10 Sep 2018
@slaypl - I agree with you that simply electing another master node seemed to solve this issue for me. In my case this is a kubernetes install I blew away the master node which got recreated and a new master was elected.
 marcusbb
on 28 May 2019
marcusbb
on 28 May 2019
The same problem here. Just to let registered for those who suffer from it in the future, it is due to the number of shards/indices. By default the collector timeout is 10s, to resolve it I just changed it to 20s.
PUT _cluster/settings
{
"persistent": {
"xpack.monitoring.collection.cluster.stats.timeout": "20s"
}
}
 epicvinny
on 29 May 2020
epicvinny
on 29 May 2020
Has this been fixed?
I just had a customer that had this same issue (no cluster_stats in the monitoring indices), and same solution (reboot the current master) in a 7.8.1 cluster. They have 2 clusters, and this issue occurred on both.
 alexander-marquardt
on 3 Sep 2020
alexander-marquardt
on 3 Sep 2020
okay, i used to have the same problem.
my kibana did not show monitoring graphs, however
i had monitoring index index .monitoring-es-* available
the root of problem in my case was that my master nodes did not have :9200 HTTP socket available from the LAN. that is my config on master nodes was:
...
transport.host: [ "192.168.7.190" ]
transport.port: 9300
http.port: 9200
http.host: [ "127.0.0.1" ]
...
as you can see HTTP socket is available only from within host.
i didnt want if some one will make HTTP request for masters from LAN because there is
no point to do that.
However as i uderstand Kibana do not only read data from monitoring index
index .monitoring-es-*
but also make some requests directly for masters to get some information.
It was exactly why Kibana did not show anything about monitoring.
After i changed one line in the config on master node as
http.host: [ "192.168.0.190", "127.0.0.1" ]
immidiately kibana started to show monitoring graphs.
i recreated this expereminet several times.
Now all is working.
Also i want to underline in spite that now all is fine my monitoring index .monitoring-es-*
do NOT have "cluster_stats" documents.
So if your kibana do not show monitoring graphs i suggest
1) check if index .monitoring-es-* exists
2) check if your master nodes can serve HTTP requests from LAN
 aceqbaceq
on 29 Sep 2020
aceqbaceq
on 29 Sep 2020
Be sure that you are collecting monitoring data on the current master - I haven't investigated in detail, but I believe that the currently elected master may be the only node in the cluster that collects/reports the cluster stats.
alexander-marquardt
on 29 Sep 2020
Related issues
 timmolter
·
3Comments
timmolter
·
3Comments
 Ginja
·
3Comments
Ginja
·
3Comments
 celesteking
·
3Comments
celesteking
·
3Comments
 snide
·
3Comments
snide
·
3Comments
 timroes
·
3Comments
timroes
·
3Comments
Most helpful comment
No worries. The
tookwas so fast because nothing matched. Nothing matched because there appear to be nocluster_statsdocuments.Based on the amount of other documents, I suspect that you are facing the same problem as the other user: namely that you have too many shards in your cluster. Assuming that you have daily indices, it is probably time to look into snapshotting the oldest indices and removing them, or otherwise cleaning up your data (that’s up to you).
The main story here is that you need to figure out what is causing
cluster_statsto time out, which is generally caused by an unhealthy number of _segments_ and that generally implies too many shards.