I'm running Kibana 4.2.beta2 as a Cloud Foundry app with 384MB of memory assigned to each app instance container.
I'm querying against a fairly small elasticsearch cluster, at a rate of about 20 requests / minute - basically very little load.
There appears be be some form of memory leak that causes the server side nodejs portion of Kibana to gradually consume more and more memory until it exhausts the 384M of memory allocated to it in the container.
Couple of follow on questions:
- What is the correct amount of RAM to allocate to Kibana4 server?
- Is this a known issue? Are other people running into something similar?
- What information / test case if most helpful for me to provide to help debug further?
Thanks!
 mrdavidlaing
All 65 comments
I am seeing the same. Memory consumption keeps increasing. I had to restart it at around 1.2 GB.
 nestorsamelo
on 22 Oct 2015
nestorsamelo
on 22 Oct 2015
What exactly occurs? Does the oom_killer slay the process? While its possible there could be a memory leak, the server doesn't do all that much. It possible this is just cache.
 rashidkpc
on 26 Oct 2015
rashidkpc
on 26 Oct 2015
I have one instance running for 4 days and 18 hours:
root@host# ps -p [pid] -o etime=
 4-18:09:40
top shows:
  PID USER      PR  NI  VIRT  RES  SHR S %CPU %MEM    TIME+  COMMAND
[pid] root      20   0 1900m 1.1g 8316 S  0.0 27.6  18:31.08 node
proc memory statistics:
root@host# cat /proc/[pid]/statm
486466 279120 2079 4044 0 477276 0
According to the documentation:
    /proc/[pid]/statm
              Provides information about memory usage, measured in pages.
              The columns are:
                  size       (1) total program size (same as VmSize in /proc/[pid]/status)
                  resident   (2) resident set size (same as VmRSS in /proc/[pid]/status)
                  share      (3) shared pages (i.e., backed by a file)
                  text       (4) text (code)
                  lib        (5) library (unused in Linux 2.6)
                  data       (6) data + stack
                  dt         (7) dirty pages (unused in Linux 2.6)
In my case, it didn't get to a point where oom_killer had to step in, as it is running in a 4 GB VM.
nestorsamelo
on 26 Oct 2015
@rashidkpc: We can also confirm the memory leak.
We started the dev server locally with esvm also running. No extra config, no custom dashboards, clean slate from freshly cloned kibana repo.
We monitored the memory usage of the process for about half an hour (we will let it run some more) and the memory usage is slowly creeping up even without running the kibana UI. It leaks a lot faster if I keep refreshing the UI. So far the amount of memory used by the process has doubled since starting it.
I'm not sure what other details we could share. We have seen the memory leak happening on OSX and Linux, nodejs 0.12.7.
 Bennell
on 27 Oct 2015
Bennell
on 27 Oct 2015
Growing memory isn't necessarily a sign of a leak.
The VM will only garbage collect at signs of memory pressure. You can confirm this by taking a heapdump of the process, which will force a garbage collection. If you then wait some time, or perform some actions, then take another heap dump, you can compare them.
These were taken ~ 10 minutes apart, as you can see, the memory actually goes down. Unless the process is dying I wouldn't worry about the growing memory. It will be freed as needed.

rashidkpc
on 27 Oct 2015
@rashidkpc I can also confirm that freeing up memory doesn't happen. The app container has 384MB memory assigned which slowly keeps filling up until either the CloudFoundry runtime kills the container and starts a new one, or, and this happens more often, the kibana server just silently stops serving requests, breaking the UI.
I will try running the app with significantly more memory and see what happens.
 cromega
on 27 Oct 2015
cromega
on 27 Oct 2015
@cromega did 4.1.x behave differently? 4.2 switched to node 0.12 which is slightly more relaxed about GCing. I'm not familiar with how cloud foundry works unfortunately.
rashidkpc
on 27 Oct 2015
@rashidkpc: I am running 4.2-beta2, before that I used a 4.2-snapshot. I have no experience with 4.1. Thanks for the info, I will play around with different node versions.
cromega
on 27 Oct 2015
@rashidkpc: The memory footprint of 4.1.2 (103 MB) is smaller than 4.2.0-beta2 (473 MB).
top for 4.1.2 (uptime 1-03:33:45):
  PID USER      PR  NI  VIRT  RES  SHR S %CPU %MEM    TIME+  COMMAND
 1716 root      20   0  998m 103m 7136 S  0.0  2.6   0:02.31 node
top for 4.2.0-beta2 (uptime 6-00:28:29):
  PID USER      PR  NI  VIRT  RES  SHR S %CPU %MEM    TIME+  COMMAND
20998 root      20   0 1280m 473m 8316 S  0.3 12.0  23:33.94 node
This last one is the same instance as my previous comment, so (resident) memory consumption has indeed decreased as you suggested above, from 1.1 GB to 473 MB.
nestorsamelo
on 27 Oct 2015
I'm not running Kibana as a Cloud Foundry app but am seeing the same issue 4.2.0 (final release). Kibana is using 646m of memory. Surely Kibana shouldn't use that much memory?
  PID USER      PR  NI  VIRT  RES  SHR S  %CPU %MEM    TIME+  COMMAND
11150 root      20   0 1183m 646m 8720 S   0.0 32.1   1:01.90 node
Update:
a 8 hours later, it has grown to this:
  PID USER      PR  NI  VIRT  RES  SHR S  %CPU %MEM    TIME+  COMMAND
11150 root      20   0 1389m 854m 5264 S   0.0 42.5   2:08.03 node
Running on Debian 7.9
 PSiAU
on 1 Nov 2015
PSiAU
on 1 Nov 2015
As a test, I restarted Kibana and left it running on the server overnight without logging into it at all on the browser. Memory usage still grows nonetheless.
  PID USER      PR  NI  VIRT  RES  SHR S  %CPU %MEM    TIME+  COMMAND
18161 root      20   0 1426m 799m 4324 S   0.3 39.7   1:17.29 node
I'm having the same problem running in a Docker container with 4.2.0 and Elasticsearch 2.0.0. No problem with 4.1.2. 1GiB OOM killed after approximately 14 hours.
 nfnty
on 3 Nov 2015
nfnty
on 3 Nov 2015
Hello,
Same problem here.
After upgrading to kibana 4.2.0 (ES and logstash upgrade too), I had some problem with ES crashing after a few hours, the OOM killer was invoked. I tried to lower the ES_HEAP to 25% of available RAM yesterday, but today the memory of the server was too low again (50MB remained)
After taking a better look to the top command, I've noticed that the node process was taking about 40%of the available RAM, meanwhile ES and logstash remained stable at ~40% and 7.5% (check below)

On the previous version of kibana (4.1.2) wit ES 1.7.2 and Logstash 1.5.4 I had no problem, the processes were running with no problems for 1 month until the upgrade. ES was configured with the recommended settings:
https://www.elastic.co/guide/en/elasticsearch/reference/current/setup-configuration.html
I'm going to leave it running for the rest of the day to check on the memory usage for each process, I'll update the thread later
Thanks for the help
 ricardojdsilva87
on 4 Nov 2015
ricardojdsilva87
on 4 Nov 2015
´Hello,
Just a quick update, the kibana 4.2.0 is running for about 2 hours and it seems that the memory usage of node increased 10% of the total RAM

Meanwhile ES and logstash remained pratically the same.
Best Regards
ricardojdsilva87
on 4 Nov 2015
Hello
After leaving the services running all night today morning I have this scenario:

The node memory usage climbed to 40% of the server RAM.
In a previous comment @rashidkpc said that the kibana server is using now the node v0.12. I'm going to try and investigate if there are any issues with this versions, maybe try a new node version.
Best regards
ricardojdsilva87
on 5 Nov 2015
Same here, see the attached picture, kibana was started at the 22:00 mark (no other change on the server happened since then) and I had it opened in browser for only about 2 mintues in total. Kibana 4.2.0, ES 2.0, Ubuntu 15.10.

 peterholak
on 5 Nov 2015
peterholak
on 5 Nov 2015
Hello,
Same problem here. Kibana 4.2.0 deployed on a container (using Ubuntu 15.04) with Elasticsearch 2.0. We have 0 usage of Kibana (no one is using it) however we see a linear growing usage of memory.
Here is the memory usage:

The first part of the graph show the behaviour with Kibana 4.1. The top green line is the memory threshold of the container. Each time Kibana reach the memory limit, it gets an OOM. As we can see on the graph, we have increased a few time the memory limit up to 1,5GB with no change of behaviour.
 rvrignaud
on 5 Nov 2015
rvrignaud
on 5 Nov 2015
@rashidkpc - You've labeled this not reproducible; how can we team together to get a test case you can use that reproduces the behaviour?
What development / test environment do you guys use - perhaps those of us on this ticket could put together something that replicates the error in your environment?
mrdavidlaing
on 6 Nov 2015
@mrdavidlaing we primarily use the chrome dev tools for memory profiling. I'm not sure how Rashid was collecting his snapshots (perhaps by signalling the node process) but I was doing the same by running the server with iron-node.
npm install -g iron-node
cd ~/dev/kibana
iron-node ./src/cli
With iron-node you can use the memory profiling tools to collect snapshots and see the items that are not being garbage collected, or collect memory over time and cause constant garbage collection. These types of metrics are a lot more meaningful than the total process memory level since v8 will only do light garbage collection until the it detects serious memory pressure.
 spalger
on 6 Nov 2015
spalger
on 6 Nov 2015
Curiosity got the better of me so I left the node process growing just to see what would happen. It started consuming just about all free memory on the instance (not cache memory but Active memory). IO Wait hit 100% as the OS tried to deal with the low memory situation. I had to restart node before the OOM killer kicked in.
PSiAU
on 8 Nov 2015
Just for the record, we're running Kibana 4.2.0 on ubuntu 12.04 and we see the same behaviour.
At startup, the kibana node process takes ~100mb (resident size seen from ps aux) and it grows steadily until the OOM killer kills something: Kibana or ES if we're not lucky.
Our usage pattern is very light, I'm the only user of the kibana installation at the moment and I don't have any dashboard open.
I've enabled verbose logging, it logs the memory usage every 5 seconds, I'll post it later.
For the moment, kibana reported using 70mb on startup and it now reports 107mb after 30 minutes.
RSS size as reported from ps aux started at ~100mb and it is now at 170mb.
 jraby
on 9 Nov 2015
jraby
on 9 Nov 2015
@jraby, @PSiAU - Out of interest, are you guys running Kibana inside a container, on a Ubuntu VM, or on baremetal?
mrdavidlaing
on 10 Nov 2015
I'm running it on Debian 7.9 (64-bit), in an EC2 instance.
PSiAU
on 10 Nov 2015
Having the same issue reported by other people here with Kibana 4.2.0. Memory usage on the server is going up with a linear pattern.
We are using kibana inside a docker container running on a Amazon Linux AMI in EC2.
 fpighi
on 10 Nov 2015
fpighi
on 10 Nov 2015
Ubuntu 12.04 on ec2.
On Nov 10, 2015 7:10 AM, "Francesco Pighi" [email protected] wrote:
Having the same issue reported by other people here with Kibana 4.2.0.
Memory usage on the server is going up with a linear pattern.
We are using kibana inside a docker container running on a Amazon Linux
AMI in EC2.—
Reply to this email directly or view it on GitHub
https://github.com/elastic/kibana/issues/5170#issuecomment-155404209.
jraby
on 10 Nov 2015
I have observed the same issue using kibana-4.2.0-linux-x64 on Red Hat Enterprise Linux 6.6 (amd64) running on VMware. Using Elasticsearch 2.0.0
Clean install of ES and Logstash (2.0.0). Logstash began putting data into elasticsearch.
With absolutely nothing accessing Kibana memory started to increase.
Verbose logs from kibana:
{"type":"ops","@timestamp":"2015-11-10T21:50:44+00:00","tags":[],"pid":30097,"os":{"load":[0.0263671875,0.099609375,0.12451171875],"mem":{"total":18846453760,"free":917716992},"uptime":17815963},"proc":{"uptime":1299.533,"mem":{"rss":139522048,"heapTotal":124630272,"heapUsed":103013112},"delay":0.337249755859375},"load":{"requests":{},"concurrents":{"5601":0},"responseTimes":{},"sockets":{"http":{"total":0},"https":{"total":0}}},"message":"memory: 98.2MB uptime: 0:21:40 load: [0.03 0.10 0.12] delay: 0.337"}
{"type":"log","@timestamp":"2015-11-10T21:50:44+00:00","tags":["plugin","debug"],"pid":30097,"message":"Checking Elasticsearch version"}
{"type":"log","@timestamp":"2015-11-10T21:50:46+00:00","tags":["plugin","debug"],"pid":30097,"message":"Checking Elasticsearch version"}
{"type":"ops","@timestamp":"2015-11-10T21:50:49+00:00","tags":[],"pid":30097,"os":{"load":[0.02392578125,0.09765625,0.12353515625],"mem":{"total":18846453760,"free":917581824},"uptime":17815968},"proc":{"uptime":1304.535,"mem":{"rss":139534336,"heapTotal":124630272,"heapUsed":103403432},"delay":0.34096527099609375},"load":{"requests":{},"concurrents":{"5601":0},"responseTimes":{},"sockets":{"http":{"total":0},"https":{"total":0}}},"message":"memory: 98.6MB uptime: 0:21:45 load: [0.02 0.10 0.12] delay: 0.341"}
{"type":"log","@timestamp":"2015-11-10T21:50:49+00:00","tags":["plugin","debug"],"pid":30097,"message":"Checking Elasticsearch version"}
{"type":"log","@timestamp":"2015-11-10T21:50:51+00:00","tags":["plugin","debug"],"pid":30097,"message":"Checking Elasticsearch version"}
{"type":"ops","@timestamp":"2015-11-10T21:50:54+00:00","tags":[],"pid":30097,"os":{"load":[0.02197265625,0.095703125,0.12255859375],"mem":{"total":18846453760,"free":917716992},"uptime":17815973},"proc":{"uptime":1309.537,"mem":{"rss":139546624,"heapTotal":124630272,"heapUsed":103793472},"delay":0.3795166015625},"load":{"requests":{},"concurrents":{"5601":0},"responseTimes":{},"sockets":{"http":{"total":0},"https":{"total":0}}},"message":"memory: 99.0MB uptime: 0:21:50 load: [0.02 0.10 0.12] delay: 0.380"}
{"type":"log","@timestamp":"2015-11-10T21:50:54+00:00","tags":["plugin","debug"],"pid":30097,"message":"Checking Elasticsearch version"}
{"type":"log","@timestamp":"2015-11-10T21:50:56+00:00","tags":["plugin","debug"],"pid":30097,"message":"Checking Elasticsearch version"}
{"type":"ops","@timestamp":"2015-11-10T21:50:59+00:00","tags":[],"pid":30097,"os":{"load":[0.02001953125,0.09375,0.12158203125],"mem":{"total":18846453760,"free":917590016},"uptime":17815978},"proc":{"uptime":1314.54,"mem":{"rss":139550720,"heapTotal":124630272,"heapUsed":104182544},"delay":0.38690185546875},"load":{"requests":{},"concurrents":{"5601":0},"responseTimes":{},"sockets":{"http":{"total":0},"https":{"total":0}}},"message":"memory: 99.4MB uptime: 0:21:55 load: [0.02 0.09 0.12] delay: 0.387"}
{"type":"log","@timestamp":"2015-11-10T21:50:59+00:00","tags":["plugin","debug"],"pid":30097,"message":"Checking Elasticsearch version"}
{"type":"log","@timestamp":"2015-11-10T21:51:01+00:00","tags":["plugin","debug"],"pid":30097,"message":"Checking Elasticsearch version"}
{"type":"ops","@timestamp":"2015-11-10T21:51:04+00:00","tags":[],"pid":30097,"os":{"load":[0.01806640625,0.091796875,0.12060546875],"mem":{"total":18846453760,"free":914677760},"uptime":17815984},"proc":{"uptime":1319.542,"mem":{"rss":142663680,"heapTotal":127726080,"heapUsed":94954152},"delay":0.32767486572265625},"load":{"requests":{},"concurrents":{"5601":0},"responseTimes":{},"sockets":{"http":{"total":0},"https":{"total":0}}},"message":"memory: 90.6MB uptime: 0:21:60 load: [0.02 0.09 0.12] delay: 0.328"}
{"type":"log","@timestamp":"2015-11-10T21:51:04+00:00","tags":["plugin","debug"],"pid":30097,"message":"Checking Elasticsearch version"}
{"type":"log","@timestamp":"2015-11-10T21:51:06+00:00","tags":["plugin","debug"],"pid":30097,"message":"Checking Elasticsearch version"}
{"type":"ops","@timestamp":"2015-11-10T21:51:09+00:00","tags":[],"pid":30097,"os":{"load":[0.0166015625,0.08984375,0.11962890625],"mem":{"total":18846453760,"free":914550784},"uptime":17815989},"proc":{"uptime":1324.544,"mem":{"rss":142684160,"heapTotal":127726080,"heapUsed":95367744},"delay":0.44158935546875},"load":{"requests":{},"concurrents":{"5601":0},"responseTimes":{},"sockets":{"http":{"total":0},"https":{"total":0}}},"message":"memory: 90.9MB uptime: 0:22:05 load: [0.02 0.09 0.12] delay: 0.442"}
{"type":"log","@timestamp":"2015-11-10T21:51:09+00:00","tags":["plugin","debug"],"pid":30097,"message":"Checking Elasticsearch version"}
{"type":"log","@timestamp":"2015-11-10T21:51:12+00:00","tags":["plugin","debug"],"pid":30097,"message":"Checking Elasticsearch version"}
{"type":"ops","@timestamp":"2015-11-10T21:51:14+00:00","tags":[],"pid":30097,"os":{"load":[0.01513671875,0.087890625,0.11865234375],"mem":{"total":18846453760,"free":914550784},"uptime":17815994},"proc":{"uptime":1329.546,"mem":{"rss":142725120,"heapTotal":127726080,"heapUsed":95791880},"delay":0.32952880859375},"load":{"requests":{},"concurrents":{"5601":0},"responseTimes":{},"sockets":{"http":{"total":0},"https":{"total":0}}},"message":"memory: 91.4MB uptime: 0:22:10 load: [0.02 0.09 0.12] delay: 0.330"}
{"type":"log","@timestamp":"2015-11-10T21:51:14+00:00","tags":["plugin","debug"],"pid":30097,"message":"Checking Elasticsearch version"}
{"type":"log","@timestamp":"2015-11-10T21:51:17+00:00","tags":["plugin","debug"],"pid":30097,"message":"Checking Elasticsearch version"}
{"type":"ops","@timestamp":"2015-11-10T21:51:19+00:00","tags":[],"pid":30097,"os":{"load":[0.013671875,0.08642578125,0.11767578125],"mem":{"total":18846453760,"free":914677760},"uptime":17815999},"proc":{"uptime":1334.548,"mem":{"rss":142757888,"heapTotal":127726080,"heapUsed":96215776},"delay":0.3208580017089844},"load":{"requests":{},"concurrents":{"5601":0},"responseTimes":{},"sockets":{"http":{"total":0},"https":{"total":0}}},"message":"memory: 91.8MB uptime: 0:22:15 load: [0.01 0.09 0.12] delay: 0.321"}
{"type":"log","@timestamp":"2015-11-10T21:51:19+00:00","tags":["plugin","debug"],"pid":30097,"message":"Checking Elasticsearch version"}
{"type":"log","@timestamp":"2015-11-10T21:51:22+00:00","tags":["plugin","debug"],"pid":30097,"message":"Checking Elasticsearch version"}
{"type":"ops","@timestamp":"2015-11-10T21:51:24+00:00","tags":[],"pid":30097,"os":{"load":[0.01220703125,0.0849609375,0.11669921875],"mem":{"total":18846453760,"free":914558976},"uptime":17816004},"proc":{"uptime":1339.551,"mem":{"rss":142770176,"heapTotal":127726080,"heapUsed":96607768},"delay":0.3420982360839844},"load":{"requests":{},"concurrents":{"5601":0},"responseTimes":{},"sockets":{"http":{"total":0},"https":{"total":0}}},"message":"memory: 92.1MB uptime: 0:22:20 load: [0.01 0.08 0.12] delay: 0.342"}
{"type":"log","@timestamp":"2015-11-10T21:51:24+00:00","tags":["plugin","debug"],"pid":30097,"message":"Checking Elasticsearch version"}
{"type":"log","@timestamp":"2015-11-10T21:51:27+00:00","tags":["plugin","debug"],"pid":30097,"message":"Checking Elasticsearch version"}
{"type":"ops","@timestamp":"2015-11-10T21:51:29+00:00","tags":[],"pid":30097,"os":{"load":[0.0107421875,0.08349609375,0.11572265625],"mem":{"total":18846453760,"free":914558976},"uptime":17816009},"proc":{"uptime":1344.553,"mem":{"rss":142786560,"heapTotal":127726080,"heapUsed":97001520},"delay":0.3820648193359375},"load":{"requests":{},"concurrents":{"5601":0},"responseTimes":{},"sockets":{"http":{"total":0},"https":{"total":0}}},"message":"memory: 92.5MB uptime: 0:22:25 load: [0.01 0.08 0.12] delay: 0.382"}
{"type":"log","@timestamp":"2015-11-10T21:51:29+00:00","tags":["plugin","debug"],"pid":30097,"message":"Checking Elasticsearch version"}
Note the increasing proc memory.
This was a fresh install no connections were ever made, no index set.
 oth3r1if3
on 10 Nov 2015
oth3r1if3
on 10 Nov 2015
I'm also hitting this issue with Kibana 4.2.0 in a Docker container. Growing from 100mb -> 1GB in a matter of 14 hours with no actual requests hitting Kibana.
 thomasmarkus
on 11 Nov 2015
thomasmarkus
on 11 Nov 2015
Same here.
We have Kibana 4.2.0 x64 on an ubuntu amazon EC2 instance with the following uname -a: 3.13.0-48-generic #80-Ubuntu SMP x86_64 GNU/Linux.
The memory usage goes from zero to 2GB in a matter of 8-10 hours.
If it's of any interest - we have the Kibana running behind an nginx reverse proxy.
Haven't checked whether the memory usage goes up when idle, but it definitely goes up when viewing a dashboard with auto refresh on.
 gilfidel
on 11 Nov 2015
gilfidel
on 11 Nov 2015
@thomasmarkus given this issue is still marked as not reproducible I was wondering if you could provide a Dockerfile and some simple instructions so the devs have something to work with. Sadly our CloudFoundry usecase is not that easy to share.
cromega
on 12 Nov 2015
An update:
The increasing memory consumption was observed on an upgrade of ES (1.6.0->2.0.0) and Kibana (4.1.1->2.0.0). The Elasticsearch update used the existing data files (including existing .kibana index).
Memory usage on a clean install (no old version data) stabilized and is not growing on its own.
Is there a way through the kibana app to force a garbage collection GC() on nodejs?
I saw that a recommended technique was registering a signal handler to a USR signal and have it perform a Garbage Collection. This would help us determine if the node instance is really lazy collection or an actual leak.
oth3r1if3
on 12 Nov 2015
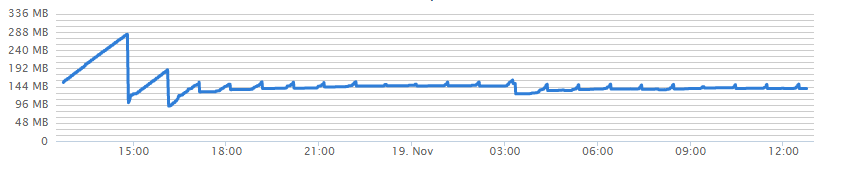
FWIW, here is a graph of memory usage of Kibana 4.2 running in a Cloud Foundry linux container:

You can see how memory consumed steadily increases (irrespective of whether Kibana is being used or not), before the process is terminated because it consumes its allocated 300MB of RAM.
mrdavidlaing
on 13 Nov 2015
I can reproduce this by just running Kibana 4.2 (from the linx x86_64 zip) in a ubuntu/trusty64 box with local elasticsearch (from the repo) and no configuration (just running /opt/kibana/bin/kibana for an hour). And it wasn't even with much data, the whole /var/lib/elasticsearch was under 100MB.
 ktosiek
on 15 Nov 2015
ktosiek
on 15 Nov 2015
Reproduced linear memory growth with almost no usage in a container with Dockerfile like:
FROM kibana:latest
EXPOSE 5601
RUN apt-get update && \
  apt-get install -q -y netcat && \
  apt-get clean && \
  kibana plugin --install elastic/sense
COPY kibana.yml /etc/
CMD kibana serve -c /etc/kibana.yml
kibana.yml:
server:
  port: 5601
  host: "0.0.0.0"

elasticsearch:
  url: "http://elasticsearch:9200"
  preserveHost: true
  startupTimeout: 15000
  pingTimeout: 5000
  requestTimeout: 300000
 aides
on 16 Nov 2015
aides
on 16 Nov 2015
Does anyone have an actual log of the linux oom_killer slaying the process? I've tried to replicate an issue where the server actually leaks, as opposed to just using memory before garbage collecting, but everything seems fine. I'm not familiar with how Cloud Foundry's watchdog process works, but afaict, garbage collection bring the memory back in line as usual.
rashidkpc
on 16 Nov 2015
@rashidkpc
[Sat Nov 14 01:50:40 2015] node invoked oom-killer: gfp_mask=0xd0, order=0, oom_score_adj=0
[Sat Nov 14 01:50:40 2015] node cpuset=690ab0122d1d41134058ee45f28d11294b6e07d10b0cd18c913ecb441090cbb9 mems_allowed=0
[Sat Nov 14 01:50:40 2015] CPU: 2 PID: 4787 Comm: node Tainted: G         C    3.16.0-0.bpo.4-amd64 #1 Debian 3.16.7-ckt11-1+deb8u2~bpo70+1
[Sat Nov 14 01:50:40 2015] Hardware name: Google Google, BIOS Google 01/01/2011
[Sat Nov 14 01:50:40 2015]  0000000000000000 ffff8800b9f45c00 ffffffff815457f4 ffff8803d9744210
[Sat Nov 14 01:50:41 2015]  ffffffff81542d07 0000000000000000 ffff8803e34ebc98 000000010000000e
[Sat Nov 14 01:50:41 2015]  0000000100000000 0000000000000001 01ff8803000000d0 0000000000000000
[Sat Nov 14 01:50:41 2015] Call Trace:
[Sat Nov 14 01:50:41 2015]  [<ffffffff815457f4>] ? dump_stack+0x41/0x51
[Sat Nov 14 01:50:41 2015]  [<ffffffff81542d07>] ? dump_header+0x76/0x1ec
[Sat Nov 14 01:50:41 2015]  [<ffffffff8115095c>] ? find_lock_task_mm+0x4c/0xa0
[Sat Nov 14 01:50:41 2015]  [<ffffffff81150e6a>] ? oom_kill_process+0x28a/0x3e0
[Sat Nov 14 01:50:41 2015]  [<ffffffff810f163c>] ? css_next_descendant_pre+0x1c/0x60
[Sat Nov 14 01:50:41 2015]  [<ffffffff811b119b>] ? mem_cgroup_iter+0x13b/0x2f0
[Sat Nov 14 01:50:41 2015]  [<ffffffff811b506f>] ? mem_cgroup_oom_synchronize+0x50f/0x580
[Sat Nov 14 01:50:41 2015]  [<ffffffff811b4550>] ? mem_cgroup_try_charge_mm+0xb0/0xb0
[Sat Nov 14 01:50:41 2015]  [<ffffffff811516f0>] ? pagefault_out_of_memory+0x10/0x80
[Sat Nov 14 01:50:41 2015]  [<ffffffff8105d1f6>] ? __do_page_fault+0x536/0x540
[Sat Nov 14 01:50:41 2015]  [<ffffffff8116b728>] ? vm_mmap_pgoff+0xd8/0x100
[Sat Nov 14 01:50:41 2015]  [<ffffffff8154dde8>] ? page_fault+0x28/0x30
[Sat Nov 14 01:50:41 2015] Task in /690ab0122d1d41134058ee45f28d11294b6e07d10b0cd18c913ecb441090cbb9 killed as a result of limit of /690ab0122d1d41134058ee45f28d11294b6e07d10b0cd18c913ecb441090cbb9
[Sat Nov 14 01:50:41 2015] memory: usage 1536000kB, limit 1536000kB, failcnt 162
[Sat Nov 14 01:50:41 2015] memory+swap: usage 0kB, limit 18014398509481983kB, failcnt 0
[Sat Nov 14 01:50:41 2015] kmem: usage 0kB, limit 18014398509481983kB, failcnt 0
[Sat Nov 14 01:50:41 2015] Memory cgroup stats for /690ab0122d1d41134058ee45f28d11294b6e07d10b0cd18c913ecb441090cbb9: cache:204KB rss:1535796KB rss_huge:0KB mapped_file:4KB writeback:0KB inactive_anon:24KB active_anon:1535952KB inactive_file:16KB active_file:8KB unevictable:0KB
[Sat Nov 14 01:50:41 2015] [ pid ]   uid  tgid total_vm      rss nr_ptes swapents oom_score_adj name
[Sat Nov 14 01:50:41 2015] [29686]     0 29686    11951     4089      28        0             0 supervisord
[Sat Nov 14 01:50:41 2015] [29708]     0 29708    30288     2421      47        0             0 nginx
[Sat Nov 14 01:50:41 2015] [29710]    33 29710    30438     1633      45        0             0 nginx
[Sat Nov 14 01:50:41 2015] [29712]    33 29712    30392      987      45        0             0 nginx
[Sat Nov 14 01:50:41 2015] [ 4787]     0  4787   609985   384474    1528        0             0 node
[Sat Nov 14 01:50:41 2015] Memory cgroup out of memory: Kill process 4787 (node) score 1005 or sacrifice child
[Sat Nov 14 01:50:41 2015] Killed process 4787 (node) total-vm:2439940kB, anon-rss:1523400kB, file-rss:14496kB
@rashidkpc that "watchdog" is our workaround for the issue. It's just a oneliner that wraps the process and kills it if it eats too much memory.It has nothing to do with CloudFoundry. The reason we have to use said "watchdog" is because the server process leaks memory. Just like ~20 others have reported.
cromega
on 16 Nov 2015
Hi,
Using this docker file:
FROM kibana:latest
COPY ./config/kibana.yml /opt/kibana/config/
and letting it run over night without using kibana.
Node reached 1.5GB of memory killing my ES container.
Can we do anything to help you track this problem?
 dngferreira
on 17 Nov 2015
dngferreira
on 17 Nov 2015
The current workaround for us is to set a memory limit on the container and set it to restart on failure.
This is acceptable in the short term, but of course it would be nice to know if you need more information to get this fixed.
fpighi
on 17 Nov 2015
I added this (https://github.com/elastic/kibana/pull/5409) to 4.3. So we can take heapdumps. If someone with growing usage could take one and upload it somewhere when usage is high that would be really helpful
rashidkpc
on 17 Nov 2015
NOTE: When taking snapshots please take at least two, allowing memory to grow between them. This helps us to see what is being created but not trashed.
spalger
on 17 Nov 2015
Whilst learning about Node's GC, I came across this - https://github.com/nodejs/node/issues/2738#issuecomment-148425971 -
which suggests that the problem might be that node is unable to detect how much memory is available in some (specifically container based PaaS) environments.
As an experiment I deployed a modified version of bin/kibana to Cloud Foundry that limits the amount of heap space (in MB) node can use using the --max-old-space-size flag.
Specifically, bin/kibana now launches kibana using:
exec "${NODE}" --max-old-space-size=100 "${DIR}/src/cli" ${@}
The graph below shows the results - the red line is from a standard Kibana 4.2.0 deployed into a 300MB container - note how it exhausts the available memory regularly and is killed by the OOM watchdog.
The blue line is Kibana 4.2.0 with the additional --max-old-space-size=100 startup flag.
Note how:
(a) Node's GC seems to be kicking fairly frequently and reclaiming memory
(b) There are frequent CPU usage "spikes", which must correspond to the GC process.

So, its possible that rather than a memory leak, we have a case where Node is just failing to run the GC unless you explicitly tell hit how much heap it is allowed to consume.
@PSiAU, @nfnty , @peterholak, @ricardojdsilva87, @lonangel, @ktosiek, @aides, @fpighi - I'm very interested to hear if a similar --max-old-space-size=100 startup flag fixes the linear memory growth issue in your test environments.
mrdavidlaing
on 18 Nov 2015
@rashidkpc - Do you have any thoughts on what the "correct" amount of memory to allocate to Kibana 4.2 is?
mrdavidlaing
on 18 Nov 2015
Thanks @mrdavidlaing I'll give it a try as soon as I can and report back
fpighi
on 18 Nov 2015
@mrdavidlaing sort of depends, 100mb is probably fine currently.
rashidkpc
on 18 Nov 2015
@rashidkpc Thanks!
Would you accept a PR that extendeds bin/kibana such that:
NODE_OPTIONS="${NODE_OPTIONS:=--max-old-space-size=250}"
exec "${NODE}" $NODE_OPTIONS "${DIR}/src/cli" ${@}
max-old-space-size did the trick for me, too.
(Disregard the first two peaks)
aides
on 19 Nov 2015
@aides - what environment are you running in? What --max-old-space-size setting did you use?
mrdavidlaing
on 19 Nov 2015
@mrdavidlaing
It is a docker container built from kibana:latest with bin/kibana modified to run as following:
...
exec "${NODE}" --max-old-space-size=100 "${DIR}/src/cli" ${@}
Monitoring was done via Tutum.co container monitoring.
There was no load on Kibana since container start.
I think I'll try to create dumps from that environment later, too.
aides
on 19 Nov 2015
12.04 on a Xen vm on amazon (HVM)
On Nov 10, 2015 6:35 AM, "David Laing" [email protected] wrote:
@jraby https://github.com/jraby, @PSiAU https://github.com/PSiAU -
Out of interest, are you guys running Kibana inside a container, on a
Ubuntu VM, or on baremetal?—
Reply to this email directly or view it on GitHub
https://github.com/elastic/kibana/issues/5170#issuecomment-155396277.
jraby
on 19 Nov 2015
Hello,
I have updated to kibana 4.2.1 but it has the same problem as 4.2.0
I've edited kibana startup script to be
exec "${NODE}" --max-old-space-size=250 "${DIR}/src/cli" ${@}
I'll leave it running and will check later if the memory usage is stable.
Thanks for the help
ricardojdsilva87
on 19 Nov 2015
The node process after the changes remained stable at 250MB (~6% of the servers total memory)

UPDATE:
After leaving kibana running for a day, the memory usage stayed around the same values

ricardojdsilva87
on 19 Nov 2015
I have OOM killer log (VM had 2GB RAM):
[9827667.988558] Out of memory in UB 5517: OOM killed process 8709 (node) score 0 vm:5478276kB, rss:1712056kB, swap:1977324kB
Now, server has 6GB RAM and kibana 4.2.0 with sense and marvel app goes up to 6GB RAM after 24hours.
 danrimal
on 20 Nov 2015
danrimal
on 20 Nov 2015
Using the --max-old-space-size=150 seems to fix the problem using docker.
Just as a safe side I have a 300mb limit on the container but it hasn't been triggered yet.
dngferreira
on 20 Nov 2015
Looks like --max-old-space-size is working nicely, thanks @mrdavidlaing
Note: I was originally adding --max-old-space-size to /etc/init.d/kibana in the args parameter instead of /opt/kibana/bin/kibana. You need to add it to /opt/kibana/bin/kibana or it will not work.
PSiAU
on 23 Nov 2015
I'm also happy to report that the PR from @mrdavidlaing also fixes the memory leak for us. :+1:
thomasmarkus
on 23 Nov 2015
Can we get this fix into a release please? I've noticed that bin/kibana in the repo still doesn't limit memory usage.
 FlorinAndrei
on 2 Dec 2015
FlorinAndrei
on 2 Dec 2015
We've also recently run into a similar issue with Kibana 4.3.
Edit: Will try the max-old-space-size fix.
 dbason
on 4 Dec 2015
dbason
on 4 Dec 2015
Same issue here: Kibana 4.3 in Docker 1.6.2 on AWS EC2
It works like Cookie Monster -- nom, nom, nom...
 dyakhnov
on 4 Dec 2015
dyakhnov
on 4 Dec 2015
Same here, in my case I had a t2.micro instance running both Kibana 4.3 and ElasticSearch 2.1
With this particular setup ElasticSearch ended up crashing (presumably by the OOM killer) but it seems that the issue was with the nodejs application
@mrdavidlaing saved the day for me :)
Any plans for a 4.3.1 with this patch any soon? :+1:
 ricardclau
on 4 Dec 2015
ricardclau
on 4 Dec 2015
--max-old-space-size=250 appears to fix it for me, process size seems to hover around 300 MB, give or take a few, no more OOM. Using Kibana 4.2.1
FlorinAndrei
on 4 Dec 2015
I'm closing this because https://github.com/elastic/kibana/pull/5451 addresses this issue by allowing you to explicitly set node's GC settings via a NODE_OPTIONS environment variable. Should hopefully make the 4.4 release.
FWIW, in a low memory environment you should be able to prevent OOM errors by starting using:
NODE_OPTIONS="--max-old-space-size=200" bin/kibana
Adjusting 200 such that 100MB + 200MB < the the memory in MB available in your container.
mrdavidlaing
on 8 Dec 2015
Adding for posterity: https://github.com/nodejs/node/issues/2683
rashidkpc
on 3 Jan 2016
Given this issue was reproducible, perhaps the "not reproducible" tag should be removed?
 austinchambers
on 8 Jan 2016
austinchambers
on 8 Jan 2016
See latest comment in https://github.com/elastic/kibana/pull/5451, the systemd service is broken due to this. Who thought > was a valid comment character?
 ageis
on 10 May 2017
ageis
on 10 May 2017
@ageis, not us. Make sure you're using our APT repository.
 tylersmalley
on 10 May 2017
tylersmalley
on 10 May 2017
Related issues
 timmolter
·
3Comments
timmolter
·
3Comments
 bhavyarm
·
3Comments
bhavyarm
·
3Comments
 Ginja
·
3Comments
Ginja
·
3Comments
 LukeMathWalker
·
3Comments
LukeMathWalker
·
3Comments
 cafuego
·
3Comments
cafuego
·
3Comments
Most helpful comment
I'm closing this because https://github.com/elastic/kibana/pull/5451 addresses this issue by allowing you to explicitly set node's GC settings via a
NODE_OPTIONSenvironment variable. Should hopefully make the 4.4 release.FWIW, in a low memory environment you should be able to prevent OOM errors by starting using:
Adjusting
200such that 100MB + 200MB < the the memory in MB available in your container.