Jtapplecalendar: Things go crazy with "Hide Bottom Bar on Push" - Progress to Infinite Scrolling
So the latest commits fixed the problem with the infinite scrolling, but they created another problem:
If you have the calendar on a view controller embedded on a tab bar controller and you push a new view controller on top of it using the option "Hide Bottom Bar on Push", when you go back to the calendar it's all wrong. It was driving me crazy, took me forever to realize the problem was that option.
I added an example here:
https://github.com/dbmrq/JTCalTest/tree/third-attempt
Check out the third-attempt branch, run the app, go to the second tab, tap the "Push VC" row and then go back to the previous VC. You'll see the calendar flashes and ends up at the wrong section. Then if you disable the "Hide Bottom Bar on Push" option on the second VC and try again it all works fine. This wasn't happening a month ago, so it was caused by something on the last few commits.
That happens because I set the calendar height to be half the height of the view controller. So when you push a view controller without the tab bar and then go back to the controller with the tab bar it thinks the size changed and the calendar reloads and messes things up. So for now I can work around this by setting an explicit height for the calendar view, but this wasn't happening before, and I think it would be better if we could change the height without any problems. Whatever the calendar view does when its height changes, it should do it before it's even visible, and it should come back to the same section it was at before, so the change wouldn't be visible at all, instead of the flash we're getting now.
Like I said, for now I can just set the height explicitly, so this isn't such a big deal, but I thought you should know about it. Cheers. :)
 dbmrq
dbmrq
All 43 comments
PS: I also had some problems with reloadData() that I could fix with the withanchor option, so if that's what caused any of these problems it was worth it. 🍻
dbmrq
on 25 Jun 2017
Alright, i now have time to look at the files you have sent.
I will check them out now.
 patchthecode
on 26 Jun 2017
patchthecode
on 26 Jun 2017
@dbmrq ok so with the 1st, 2nd and 3rd attempt, which would be preferable?
it seems there there were some problems.
you mentioned that the configureCalendar function was called twice on reload.
I have now changed this. It will be called only once. (on master branch)
Here is your file with changes. The master branch now** seems to be infinite.
JTCalTest-master.zip
The withAnchor option was added for devs who wanted to reload the calendar which already started at some offset already. They did not want to reload, and then scroll to the offset because there would be a quick moment when the calendar started at offset 0 before scrolling to their desired date.
Let me know if this file worked. I will take a look at the 2nd attempt branch.
patchthecode
on 26 Jun 2017
Adding related issue here to keep track -> https://github.com/patchthecode/JTAppleCalendar/issues/403
Man, you really do get elaborate with your test apps. Slowness and Offset. thanks. haha.
Anyway, your 2nd-Try branch looks ok.
I also looked at 3rd try.
You said that when you popped back from the VC, that it aligned with the wrong date.
Put this in your viewDidAppear for now until i debug it.
override func viewWillAppear(_ animated: Bool) {
        super.viewWillAppear(animated)

        let focusDate = calendarView.visibleDates().monthDates.first?.date
        self.calendarView.reloadData(withanchor: focusDate)
    }
Haha, I didn't realize I was using an older version of the library in my app than in the example; I couldn't reproduce the problem and I didn't understand why. So I thought maybe it had something to do with the offset being too small or too long, so I added the option to try it so I could test it on the fly. But I still couldn't reproduce the problem, so I thought it could be because my calendar was slower, so I added the option to make the code slower or faster, but I still couldn't reproduce it. Then I realized I got the code from the master branch, and when I updated the library in my app the problem was gone.
So yeah, the second version is fine. :)
Then I started getting the problem when popping the VC and I made the third version. For now I'm working around it, like I said it's no big deal.
As for the master branch, awesome, now it works perfectly. o/
I think that's the better option, instead of keeping a reference to the start and end dates they're calculated whenever they're needed. Another thing that would be nice is if we could access the calendar's current start and end dates, so we could compare them with what they should be. Something like:
if self.startDate != calendarView.startDate || self.endDate != calendarView.endDate {
    calendarView.reloadData() // Here the calendar would use
                              // self.startDate and self.endDate, which are
                              // computed properties calculated on the spot.
}
And I think my definitions of startDate and endDate could be the default if the user doesn't add the configureCalendar function. So it would be a infinite scrolling calendar starting today right out of the box.
dbmrq
on 26 Jun 2017
cool. 👍
And I think my definitions of startDate and endDate could be the default if the user doesn't add the configureCalendar function. So it would be a infinite scrolling calendar starting today right out of the box.
I'll investigate it some more to see the possibility. It really looks promising. Thanks for your help man.
patchthecode
on 26 Jun 2017
Thank you. 🍻
dbmrq
on 27 Jun 2017
I just found another issue... I'm not sure if it's the library or if I'm doing something wrong.
There seems to be some unbounded memory growth. Everytime I scroll I reload the data so that the previous and the next months get recalculated. Every time that happens the app uses more and more memory though. You can see it in the degub navigator by selecting the memory section. Here's how it looks in my app:
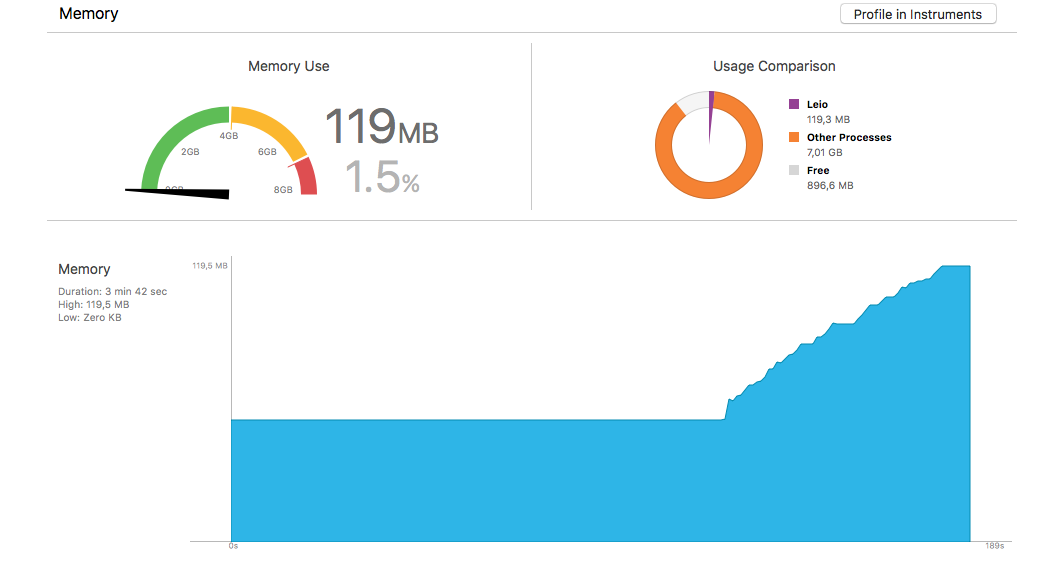
In that example app the growth is a lot less dramatic, but I think it still happens. Check out the third-attempt branch, check the memory usage chart and scroll back and forth a bit, tap "Today", scroll some more, tap "Today", scroll some more and so on. You'll see that if you scroll enough the memory will keep rising. That shouldn't happen, right?
Also if you tap the "profile in instruments" button I think there are a few memory leaks.
dbmrq
on 4 Jul 2017
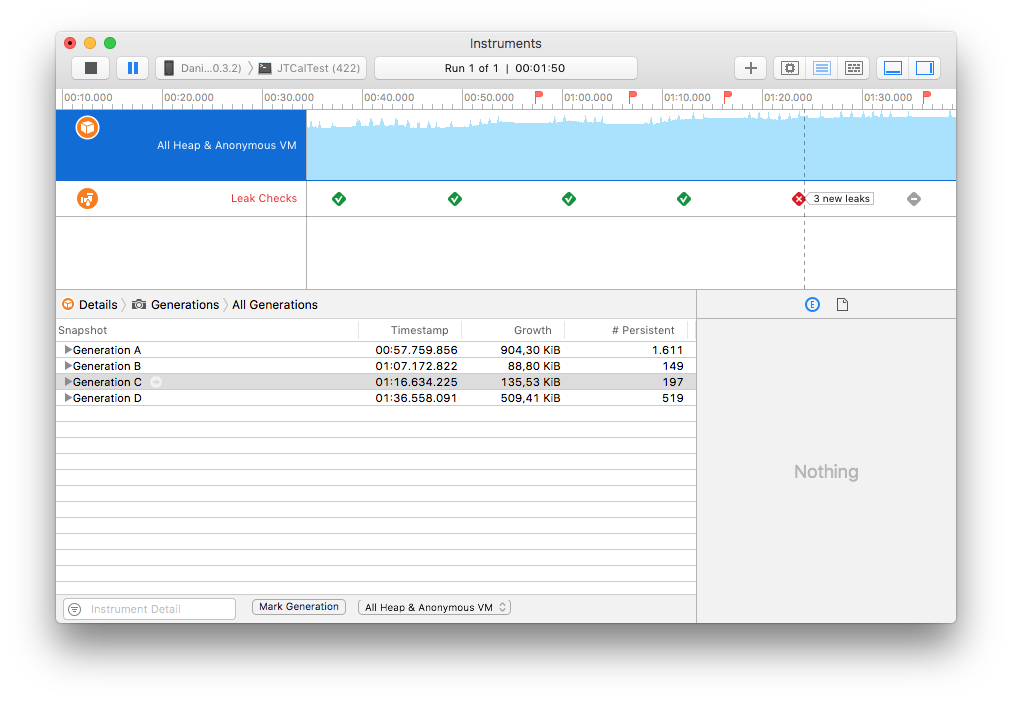
Here's the test app's profile, I just scrolled right 5 times, tapped "Today", marked a generation and kept repeating that a few times:
dbmrq
on 4 Jul 2017
I think the problem is reloadData().
Here's another example:
https://github.com/dbmrq/JTCalTest/tree/memory-example
If you run the app and just tap the "Reload" button the memory usage already rises a bit. If you keep scrolling around and reloading more and more it rises more and more:
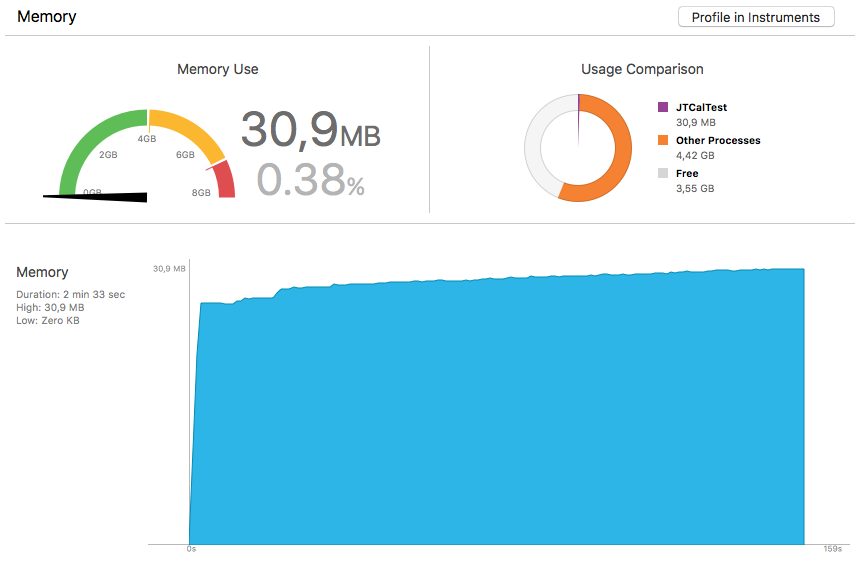
That shouldn't happen, right? When you reload the data it should free the memory that was used before, not keep piling up on it. On this sample app it eventually reaches a plateau... in my app it seems it never does, I can't figure out why. Still I think it shouldn't be happening in the first place.
dbmrq
on 4 Jul 2017
Ok. I definitely have to look into this.
This should not be happening. I never checked this because i know my objects are being released.
Will look after 4th July stuffs
patchthecode
on 4 Jul 2017
As an experiment I added this to viewDidAppear() in the test app:
for _ in 0...100000 {
    calendarView.reloadData()
}
The result is definitely not good:
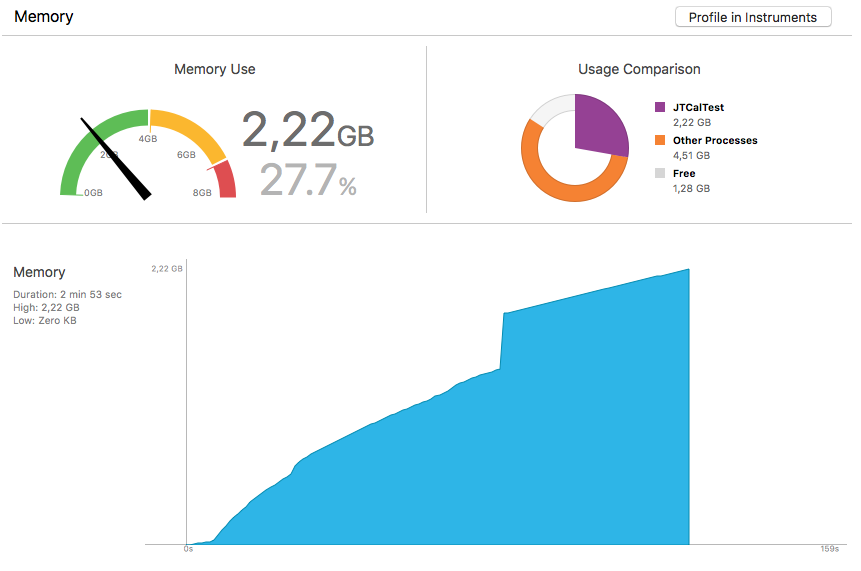
If I hadn't killed the app it would have kept going.
So it seems there really is a problem with reloadData(). It shouldn't keep using more and more memory like that.
Ideally we wouldn't even have to call reloadData(). The documentation says it should be used sparingly. But it's the best we have so far to get the infinite scrolling. And even calling reloadData() often this shouldn't happen.
dbmrq
on 4 Jul 2017
Reload data should be used sparingly only because it recreates the layout.
But this should never happen. Will look in a bit.
patchthecode
on 4 Jul 2017
I updated the sample app with a "Reload 100000 times" button: https://github.com/dbmrq/JTCalTest/tree/memory-example
Just tap the button and watch the memory go crazy.
No problem. Happy holidays. :)
dbmrq
on 4 Jul 2017
@patchthecode Any news on this?
dbmrq
on 13 Jul 2017
@dbmrq real busy 3 weeks. Will be just a bit free this weekend. Will take a look. No worries.
patchthecode
on 13 Jul 2017
Alright then, thanks. :)
dbmrq
on 13 Jul 2017
@dbmrq what profile tool were you using to see the memory? I just have a chance to look at this.
Im looking for that Profile view you showed and i'm not finding it.
patchthecode
on 18 Jul 2017
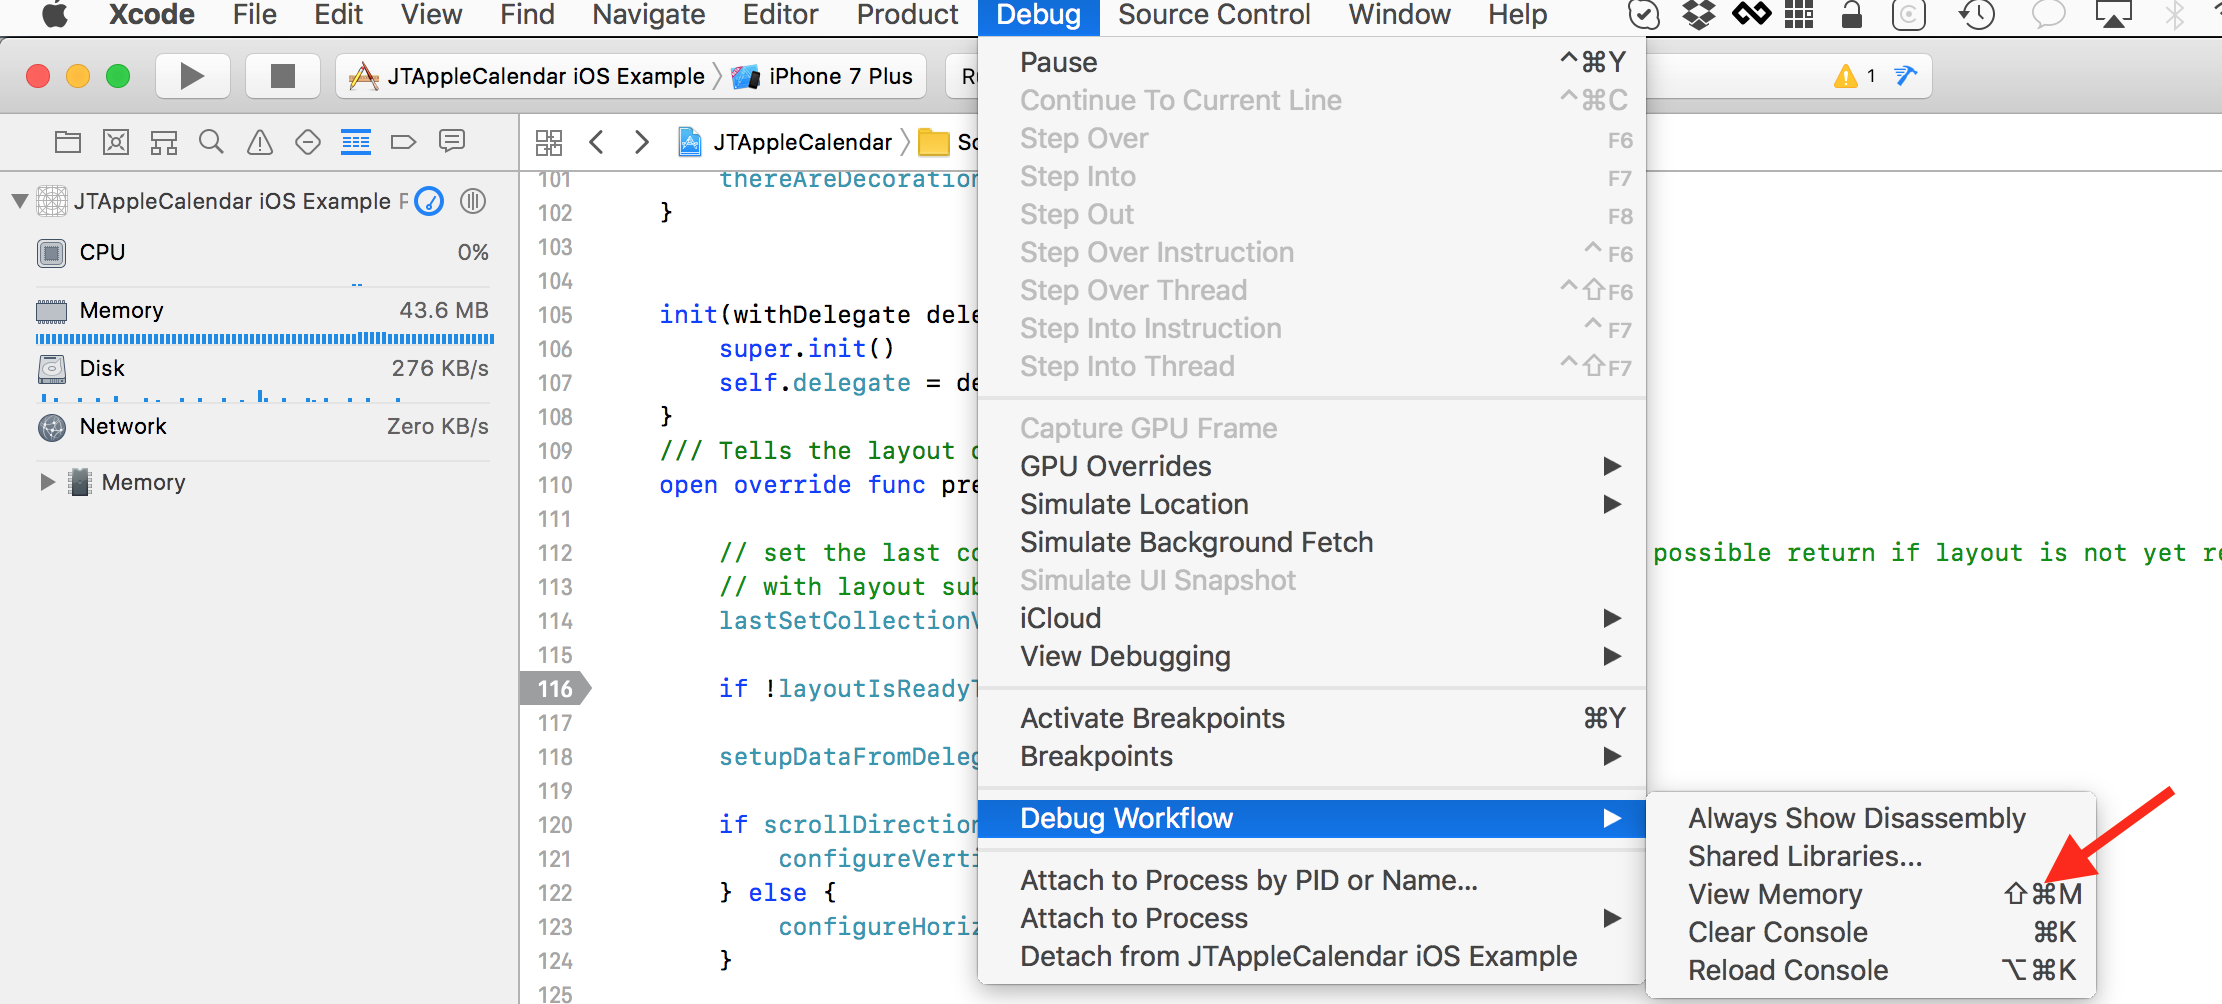
@patchthecode At the debug panel you can sel
dbmrq
on 18 Jul 2017
Oops, that was an accident, I'm on my phone. 🤦🏻♂️
Anyway, at the debug panel you can select Memory and you'll see the charts I sent, and then you can select "Profile" on the upper right corner for a morr extensive profile.
Thanks! :)
dbmrq
on 18 Jul 2017
@dbmrq do you mean this?
I clicked on it, but still no charts. Lol, seems i'm noob at this.
patchthecode
on 18 Jul 2017
@patchthecode No, at the left bar where it says "CPU", "Memory" etc. just tap Memory and you'll see the chart. Then on the upper right corner you'll see the "Profile" button. :)
dbmrq
on 18 Jul 2017
xD i see it. thanks!
patchthecode
on 18 Jul 2017
No problem. :)
Em ter, 18 de jul de 2017 às 13:48, JTAppleCalendar <
[email protected]> escreveu:
xD i see it. thanks!
—
You are receiving this because you were mentioned.
Reply to this email directly, view it on GitHub
https://github.com/patchthecode/JTAppleCalendar/issues/470#issuecomment-316125631,
or mute the thread
https://github.com/notifications/unsubscribe-auth/APFMKmE1vOKaB5gR2LoHZGhp2J36zkggks5sPOHDgaJpZM4OEtrC
.
dbmrq
on 18 Jul 2017
@dbmrq here ->
JTCalTest-third-attempt.zip
I think this new version works. I also think i worked some of the hard code i was doing before.
When reloadData is called, the layout is trashed, so i had some code to try prevent that.
This made things difficult as it seemed i was coding "against the grain".
Also, the newly introduced cell prefetching was causing some other subtle issues. So i gave up and coded it the way Apple recommended. https://developer.apple.com/documentation/uikit/uicollectionview/1771771-prefetchingenabled
Note
When prefetching is enabled the
collectionView:cellForItemAtIndexPath:
method on the collection view delegate is called in advance of when the cell is required. To avoid > inconsistencies in the visual appearance, use the
collectionView:willDisplayCell:forItemAtIndexPath:
delegate method to update the cell to reflect visual state such as selection.
patchthecode
on 28 Aug 2017
Awesome, I saw something weird was happening on reloadData, but I didn't know what it was. I'll try the new code tonight and let you know. :)
dbmrq
on 28 Aug 2017
@dbmrq keep in mind this code change is experimental. But for now it looks more sturdy than the last logic.
patchthecode
on 28 Aug 2017
@dbmrq i also wanted to know your thoughts on forcing users to implement the new
willDisplayCell function. It seems that in order to fix those subtle bugs related to inconsistencies in the visual appearance, (according to Apple) there is no other way to do this. The good news is that the code you put in there will be the same code you have in your cellForItemAtIndex function. You will see this in the sample zip file i sent you. I just dont like that it looks so ugly however.
patchthecode
on 28 Aug 2017
there are still some issues ok. Its code in progress.
patchthecode
on 28 Aug 2017
No problem, I'll stick with the previous version for my app and wait until this is better tested.
As for forcing users to implement willDisplayCell, I think that's fine. Now that the calendar is a subclass of UICollectionView I actually think it should be as close to UICollectionView as possible and use as many of its functions as possible, instead of creating another layer on top of it. That way when users want to change the behavior of something they can just google how to do it for collection views and apply it to the calendar, instead of coming here and bugging you. :)
dbmrq
on 28 Aug 2017
Ok, I just took a look at your code, but the problems I mentioned still seem to be happening.
There are two different problems, so maybe I should open another issue to keep track of them separately. Let me know if you want me to do that.
The first problem is the one on the title of this issue. Like I said
[…] tap the "Push VC" row and then go back to the previous VC. You'll see the calendar flashes and ends up at the wrong section.
That still happens in the code you just sent me. If you tap "Push VC", go back and then try to go left you'll see it doesn't work. The calendar should always be on the middle section, but it goes back to the first one.
The second issue is less visible but more serious: the unbounded memory growth and memory leaks. Apparently you did something to prevent reloadData() being called multiple times, so the code I used to test it doesn't work anymore, but that only masks the problem.
Here's the result from the Allocations instrument (like I said, you can reproduce this if you run the app, go to the "Memory" section and tap the "Profile in Instruments" button):
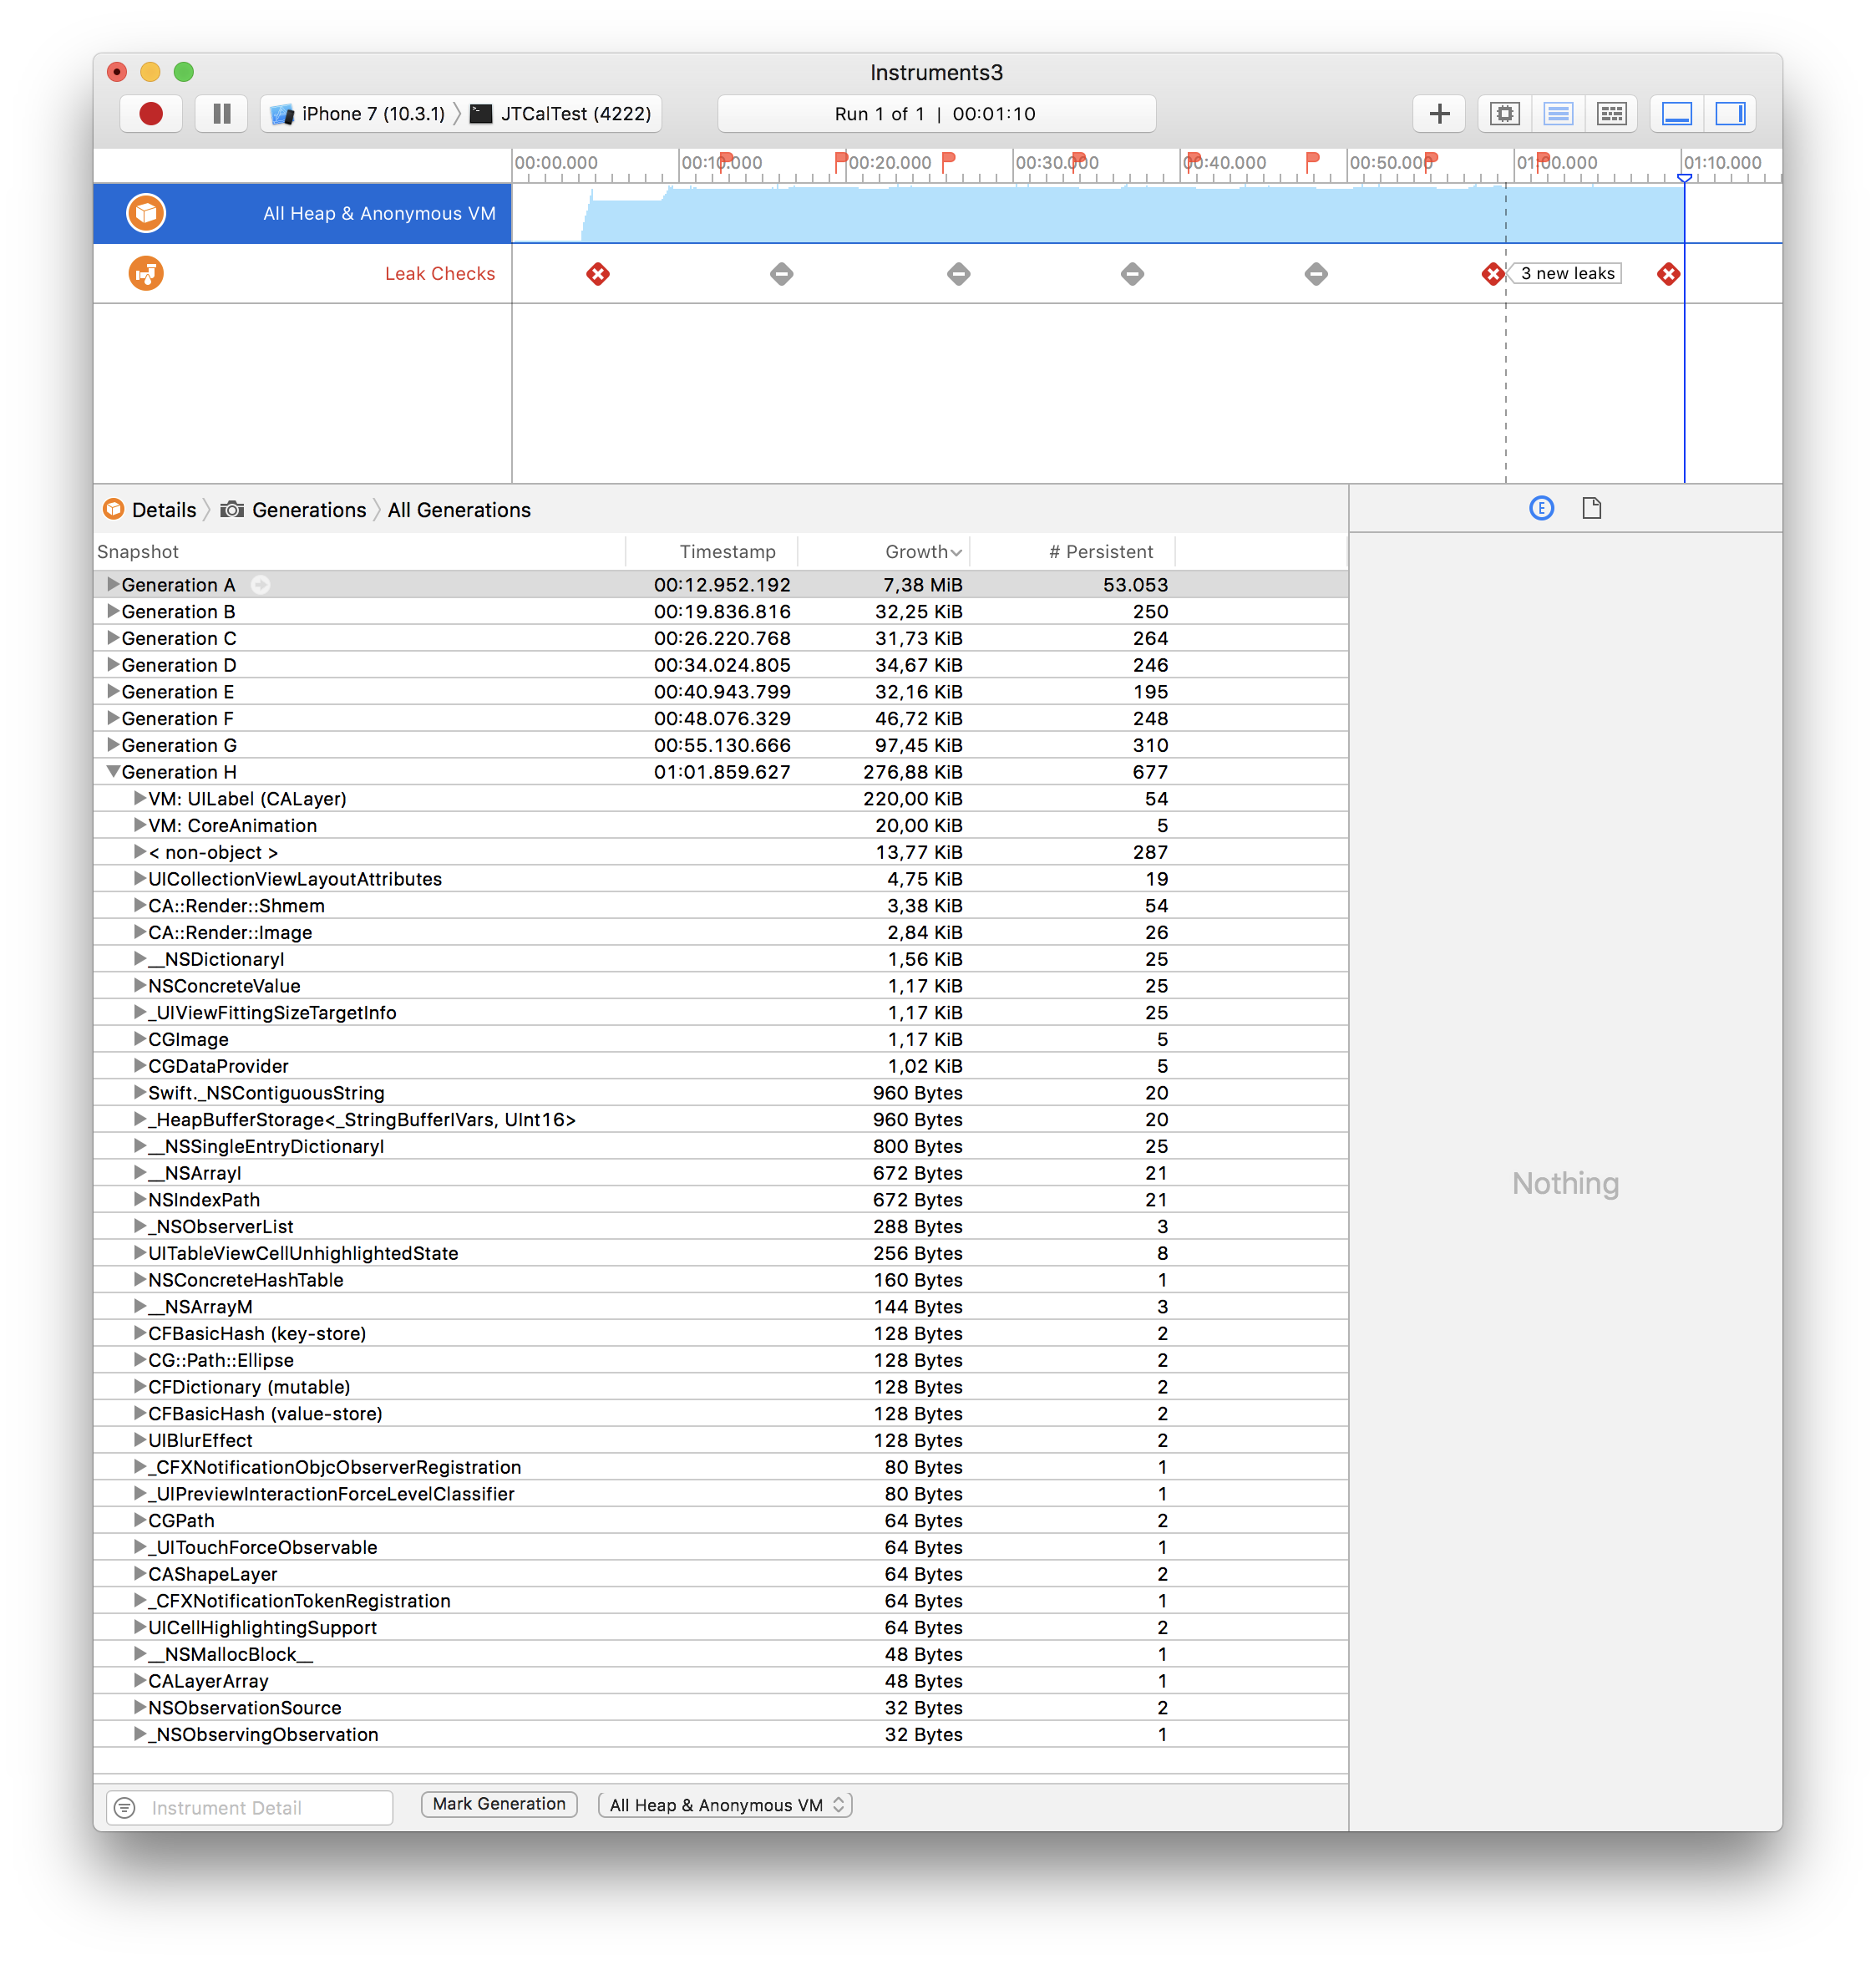
What I did here was (1) scroll right, (2) tap today, (3) mark a generation and (4) repeat multiple times. After each iteration the app ends up in the same state as before, so it shouldn't be using any more memory, but you can see it always does, the memory usage just keeps growing and growing. You can see in the screenshot that a lot of that memory is being used to allocate UILabels, and it looks like that memory is never deallocated. And then you can see there are also memory leaks.
You can check these links about the Allocations instrument:
https://medium.com/@kazmiekr/what-every-ios-developer-should-be-doing-with-instruments-d1661eeaf64f
dbmrq
on 29 Aug 2017
Here's something that could be a clue:
https://stackoverflow.com/a/38145757/3539651
[…] every time a cell is shown and an new image is passed to the image view the old image should be freed.
This could not happen if you store a reference to the old image elsewhere, for instance a cache or an array.
The question is dealing with images, but I think it could apply here. Are references to the cells or any of their elements stored anywhere (like an array)? Apparently that could cause that memory not to be freed on reloadData().
I'm also not sure what is happening here, but the memory usage shouldn't keep growing like that. Like it says in that first link I mentioned:
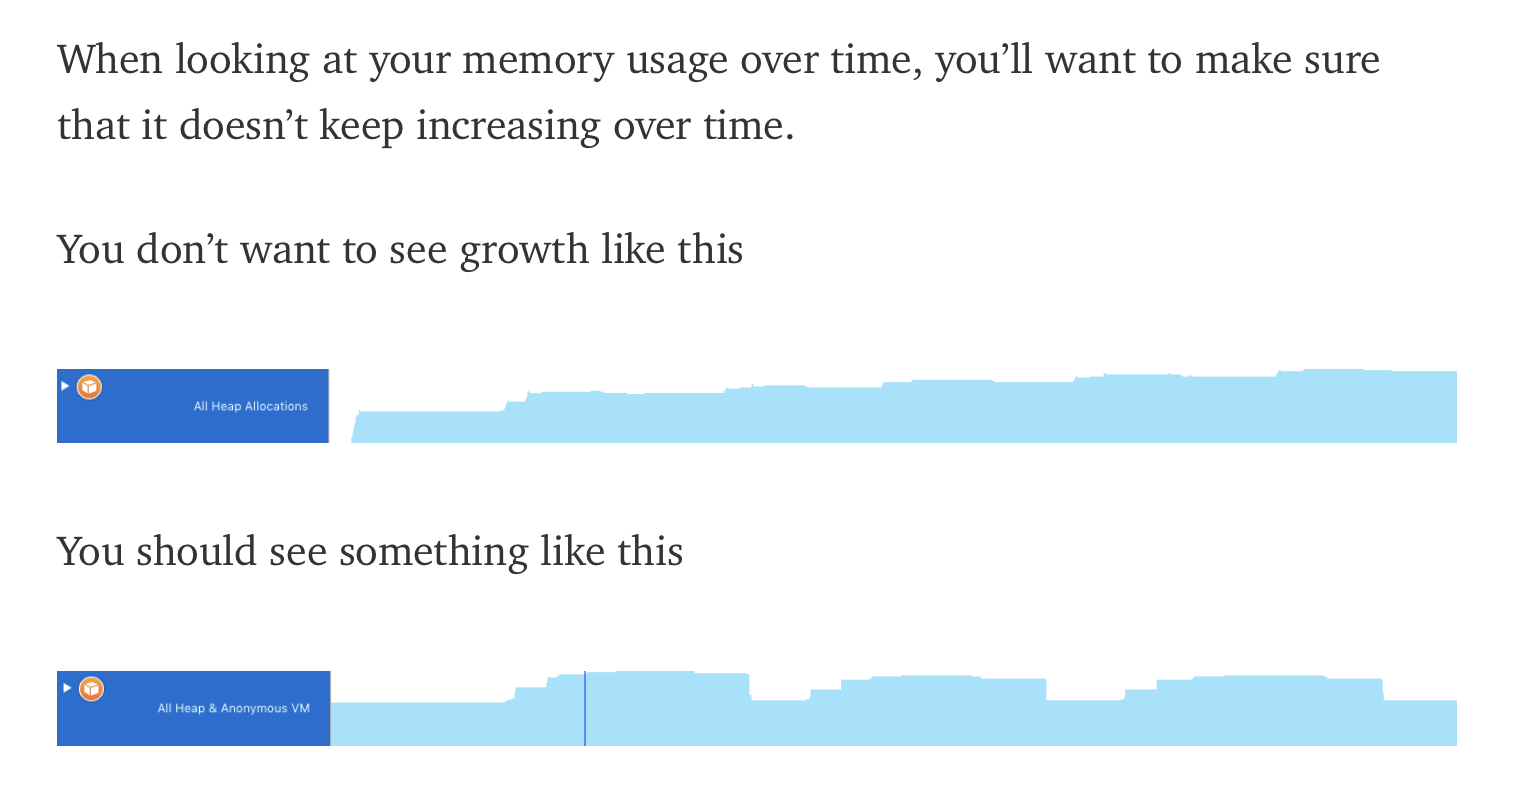
dbmrq
on 29 Aug 2017
@dbmrq I tried every thing to recreate the memory leaks you are seeing. I do not know how you got those with the files i sent you :/
Here is the Projectfiles again ->
JTCalTest-third-attempt.zip
Here is vid1 showing no leaks ->
NoMemLeaks.mp4.zip
Here is vid2 showing pushVC works ->
PushVCWorks.mov.zip
Concerning the increasing memory, I am still looking into what is causing this
patchthecode
on 29 Aug 2017
Sometimes I got the leaks right after I begun testing, and sometimes it took like 20 generations until it happened. Also I see you're using Xcode 9… I tried it with Xcode 8. I don't have the beta on this machine, but I'll try it soon. Anyway it shouldn't happen with either. But I think the main problem is the increasing memory anyway.
As for pushing the VC, that's very weird. I tried your files with both the iPhone 7 and 7 Plus simulators and it doesn't work properly on either. I don't get why it doesn't happen with you, the only difference I can think of is the Xcode version. I'll try it with the beta soon. This isn't that serious either though, I already circumvented it by calling reloadData() on the previous versions. The main thing is the memory growth. Thanks for looking into it. :)
dbmrq
on 30 Aug 2017
Aha, I tried it in Xcode 9 and you're right, the problems don't happen. I suppose the leaks could be Apple bugs that were fixed. With the VC pushing issue I'm not sure what's happening, I thing it should work the same as in Xcode 8, but, well, let's hope it keeps working when the final version is released.
The memory growth is even worse in Xcode 9, though. While in my previous example there was usually a growth of around 30Kb per generation, now I'm getting about 150Kb.
dbmrq
on 30 Aug 2017
@dbmrq oh man, i didnt realize you were using XCode 8.
Yes there are memory leaks in Xcode 8. After looking into it some time ago, i realized it was Apple bugs. I've been using Xcode 9 for quite some time now.
Ok. now that both problems are resolved, I will now totally focus on the increasing memory problem now. Thank you.
You will hear a response from me in a little while.
patchthecode
on 30 Aug 2017
Yeah, I have to stick to Xcode 8 to be able to update my app. 🤷♂️
I don't know how much time you have and when you're going to implement infinite scrolling out of the box, but if you plan on doing it soon maybe it's not even worth it to take too much time looking into this problem right now, since it's only that bad because of the workaround we came up with in #403. With a better infinite scrolling solution (like this) no one would have to keep reloading the calendar so much, so the memory growth wouldn't be much of a problem. Still it shouldn't be happening and reloading the calendar should free the previous memory, but it wouldn't be that bad.
Thanks for looking into all this. :)
dbmrq
on 30 Aug 2017
@dbmrq in terms of the reload problem. For master branch code, i just did the profile, and it only rose to 18MB Max. Then it stopped growing. I tried a number of things to mess with it. I think all looks ok with it. (unless im wrong).
patchthecode
on 18 Sep 2017
That with those files you sent me? Weird, here the app starts running with about 50 MB already. Or do you mean 18 MB is the total growth.
Anyway, it's hard to be sure of the results when testing manually, that's why I was calling reloadData() 100000 times in my code. Now that doesn't work anymore, but I think to be sure you should comment out whatever you did to block it and try doing that, writing some code to call reloadData() a huge number of times. Then we'll know for sure if the memory reaches a plateau or keeps rising forever. When I tried it it was rising to ridiculous amounts, like more than 2 GB in that screenshot I sent you.
Also I'm sorry to bring bad news, but that problem in #142 is still happening for me after all. :/
I didn't mention it before because I wanted to send you an example so you can try it, but I didn't have the time to set it up yet. I'll do it soon.
Thanks again for looking into all this. :)
dbmrq
on 18 Sep 2017
ok, i meant the code on master branch seemed ok.
Ok here's what, I change your code and try it with latest master code.
Then i'll test it by removing the code for the reload for loop.
Will respond here to you again.
patchthecode
on 18 Sep 2017
Alright, I think that's the safest option anyway. Thanks!
dbmrq
on 18 Sep 2017
@patchthecode Any updates on the infinite scrolling?
 hanyuone
on 21 Jul 2018
hanyuone
on 21 Jul 2018
finally closing this issue.
This wont be a feature of this lib.
But I will create an example of how it can be done soon.
patchthecode
on 14 Mar 2019
Related issues
 gotamafandy
·
3Comments
gotamafandy
·
3Comments
 VladFrolov
·
4Comments
VladFrolov
·
4Comments
 leo150
·
3Comments
leo150
·
3Comments
 Fatalution
·
3Comments
Fatalution
·
3Comments
 oddpandadesign
·
5Comments
oddpandadesign
·
5Comments
Most helpful comment
@patchthecode Any updates on the infinite scrolling?