Ionic-framework: Ionic 3.1.1 MAJOR MEMORY LEAK in the most basic ionic 3 app.
Ionic version: (check one with "x")
[X ] 3.1.1
_running on iOS10_
I'm submitting a ... (check one with "x")
[X ] bug report
Current behavior:
Scrolling creates a terrible memory leak.
Expected behavior:
Memory should be released after scrolling.
Steps to reproduce:
ionic start scrollingtest blank
The ONLY modification made thereafter was to add 10 paragraphs to the "home" page in src/pages/home/home.html, outlined below, albeit im only going to show 1 paragraph here:
<ion-content padding>
  The world is your oyster.
  <p>
    If you get lost, the <a href="http://ionicframework.com/docs/v2">docs</a> will be your guide.
  </p>
  <p>
    Lorem ipsum dolor sit amet, consectetur adipiscing elit. Praesent convallis nisi at metus auctor, nec egestas mauris vestibulum. Curabitur id pretium massa. Vestibulum maximus sagittis imperdiet. Cras pretium dui a dolor scelerisque iaculis. Fusce convallis velit in mi ultrices, ac imperdiet arcu pulvinar. Sed ornare luctus nulla a suscipit. Praesent pulvinar quis quam ac tristique. Vivamus id nibh sed risus tincidunt hendrerit. Class aptent taciti sociosqu ad litora torquent per conubia nostra, per inceptos himenaeos. Suspendisse egestas sapien quis orci tempor finibus.
  </p>

<!-- note, i added the same paragraph 10 times in-order to test scrolling, just seems redundant to paste them all in this issue report -->
ok ... then run: ionic build --prod
Then open the ios app in xcode, and test run it on an actual device running iOS 10.
The app loads and displays the "home" page.
_While running, select the "debug navigator" tab, and then select "memory" to monitor memory usage._
Next, just scroll the page up and then down continuously and it adds approximately ~1.5mb of memory usage with every scroll.
That memory is NEVER released after scrolling has ended. Eventually the app will crash due to this issue.
Screen shot attached after scrolling up then down, then up etc etc approximately 30 times:

Ionic info: (run ionic info from a terminal/cmd prompt and paste output below):
Cordova CLI: 6.5.0
Ionic Framework Version: 3.1.1
Ionic CLI Version: 2.2.3
Ionic App Lib Version: 2.2.1
Ionic App Scripts Version: 1.3.7
ios-deploy version: 1.9.1
ios-sim version: 5.0.13
OS: macOS Sierra
Node Version: v7.9.0
Xcode version: Xcode 8.3 Build version 8W120l
Note, i have tried a further test with the new WKWebView vs the UIWebView, and while initial memory usage is much lower, the memory increases during scrolling still persist.
 gitdisrupt
All 18 comments
https://drive.google.com/file/d/0Bzwe5hrqVKjhNU9aNlQ4a2RGTXc/view?usp=sharing
https://drive.google.com/file/d/0Bzwe5hrqVKjha01fcmxOMk1JSG8/view?usp=sharing
Hey, @gitdisrupt thanks for opening an issue with us. So in the two videos above you can see my testing of this issue. The first one is of our conference app and the second one is a blank app with a bunch of paragraphs added (as in your test). Also, the conference app test is with WK and the blank test is with UI. As you can see from those videos I am not able to reproduce any memory leaks. Would you be able to share a repo I could use to reproduce this issue? Thanks!
 jgw96
on 9 May 2017
jgw96
on 9 May 2017
I dont know how else to demonstrate other than to record an actual session, but i have created a repo of the exact example from my issue report here: https://github.com/gitdisrupt/Ionic3iOS10ScrollMemoryLeak.git
Did you run on an actual device running iOS10? Versions i have tested: 10.3.1 and 10.3.2
Note my Ionic info as listed in my report as well:
Cordova CLI: 6.5.0
Ionic Framework Version: 3.1.1
Ionic CLI Version: 2.2.3
Ionic App Lib Version: 2.2.1
Ionic App Scripts Version: 1.3.7
ios-deploy version: 1.9.1
ios-sim version: 5.0.13
OS: macOS Sierra
Node Version: v7.9.0
Xcode version: Xcode 8.3 Build version 8W120l
I tried to replicate this issue in my project. I have just updated to Ionic v3.2 rather than v3.1.1 but I cannot replicate the memory leak when scrolling. The attached image shows memory profiling in xcode when running on the simulator.
Immediately after launch I scrolled up and down around 30 times, no change to memory allocation at all. I then moved to a page that has a big virtualscroll list. Scrolled up and down maybe 30 times again. This is the slight increase in memory usage you can see, but this memory usage is due to loading base64 images for all the items that are being scrolled.
I then changed to a page that has a long 500+ item list and scrolled up and down for about a minute and memory utilization stayed flat. Note that this page does NOT have any images in the list items so no memory increase due to handling base64 encoded images in memory.
So the short version is, I can't reproduce a memory leak tied to scrolling on ionic v3.2

 ghenry22
on 11 May 2017
ghenry22
on 11 May 2017
Your system information:
Cordova CLI: 6.5.0
Ionic Framework Version: 3.2.0
Ionic CLI Version: 2.2.3
Ionic App Lib Version: 2.2.1
Ionic App Scripts Version: 1.3.7
ios-deploy version: 1.9.1
ios-sim version: 5.0.13
OS: macOS Sierra
Node Version: v6.10.3
Xcode version: Xcode 8.3.2 Build version 8E2002
ghenry22
on 11 May 2017
I have followed up with @manucorporat on this issue and he is going to take a look. Unfortunately, no matter what I try I am not able to repro at the moment.
jgw96
on 11 May 2017
As it relates to 3.1.1 ...
If you are not able to reproduce this behavior I have to assume that your system info does not match mine exactly and that the problem is specific to one or more of the versions i have installed.
I will also try 3.2 as soon as i have a chance.
gitdisrupt
on 13 May 2017
Any further info on this?
I was very careful not to change anything other than to add the paragraphs like noted above. The rest of all the code was generated by the ionic CLI... and still i see a huge memory problem.
Apple will most likely reject the app because of this problem.
gitdisrupt
on 14 May 2017
@gitdisrupt Unfortunately we have not been able to reproduce this issue on our end. Would you mind checking your app on your device with safari dev tools instead of the memory tool in xcode? The reason I recommend this is because the xcode memory tools can be misleading in the fact that it's not actually measuring memory usage of the javascript heap of the app, instead, it is reading the memory used by the kernel / OS itself. So based off the same concept I described here, the OS will not free up memory used by the JS virtual machine if it 1. thinks the action that used that memory is going to happen often and 2. thinks that it has plenty of memory to spare. So, while the JS heap memory will be shrinking every time the JS engine runs garbage collection, that does not mean that the memory that iOS has allocated to the browser will shrink, and, if iOS did start freeing up memory when it has plenty of memory available you would actually see performance issues. Also, it's important to remember that high memory usage does not === a memory leak and in fact operating systems are built to take the most advantage of the resources (in this case ram) available to it, especially on mobile devices.
jgw96
on 15 May 2017
Ill give that a shot. Thanks for the detailed answer. And yes, i understand that it does not necessarily === a memory leak ... i only assumed it was a leak since it seemed GC was not clearing out the memory usage i was seeing grow in XCode.
gitdisrupt
on 17 May 2017
Awesome, thanks @gitdisrupt! Yeah, XCode does not provide the best tools for hybrid apps, unfortunately, but safari dev tools are pretty decent and will be much more accurate for testing memory usage.
jgw96
on 17 May 2017
Hello @gitdisrupt, since we are not able to reproduce this issue I am going to close this issue for now. Thanks for using Ionic!
jgw96
on 18 May 2017
Ok so i can accept your note about XCode tools not really being the best for profiling a hybrid app, but as it related to this issue, there is no doubt a problem that still persists unfortunately.
After building and running the example above, and scrolling continuously for about an hour, the app crashes with the error: Terminated due to memory issue
I do not agree that this issue should be closed.
gitdisrupt
on 30 May 2017
We have this issue on an Android App too. Adds 2-3 MB of heap usage on every user action like tapping some GUI item until the App is almost unresponsive.
My System info:
Cordova CLI: 6.5.0
Ionic Framework Version: 3.2.1
Ionic CLI Version: 2.2.2
Ionic App Lib Version: 2.2.1
Ionic App Scripts Version: 1.3.7
ios-deploy version: Not installed
ios-sim version: Not installed
OS: Windows 10
Node Version: v6.9.1
Xcode version: Not installed
This is a blocking issue for us and will most likely end in a project suspension because the customer will not accept this app performance!
 kashban
on 7 Jun 2017
kashban
on 7 Jun 2017
Hi, my example app have also been experiencing the same issue of memory leak. I have used the infinity scroll in order to display items in the screen and the memory consumption is going a way to high when the user scrolls down.
https://github.com/vitorsilvalima/ionic-tmdb
 vitorsilvalima
on 16 Jul 2017
vitorsilvalima
on 16 Jul 2017
In our case it turned out to have a different origin: Due to an unexperienced developer timers were started all over the place which invoked Angular's change detection several times a second. After sorting this out I found the performance to be ok and no memory leak has been seen on infinite scroll lists on our part.
kashban
on 14 Aug 2017
I don't know if anyone else tried when creating a new blank Ionic project, at the moment of profiling in the Safari Developer Tools I see a 220MB memory usage for starters. How can this be? Is this normal?
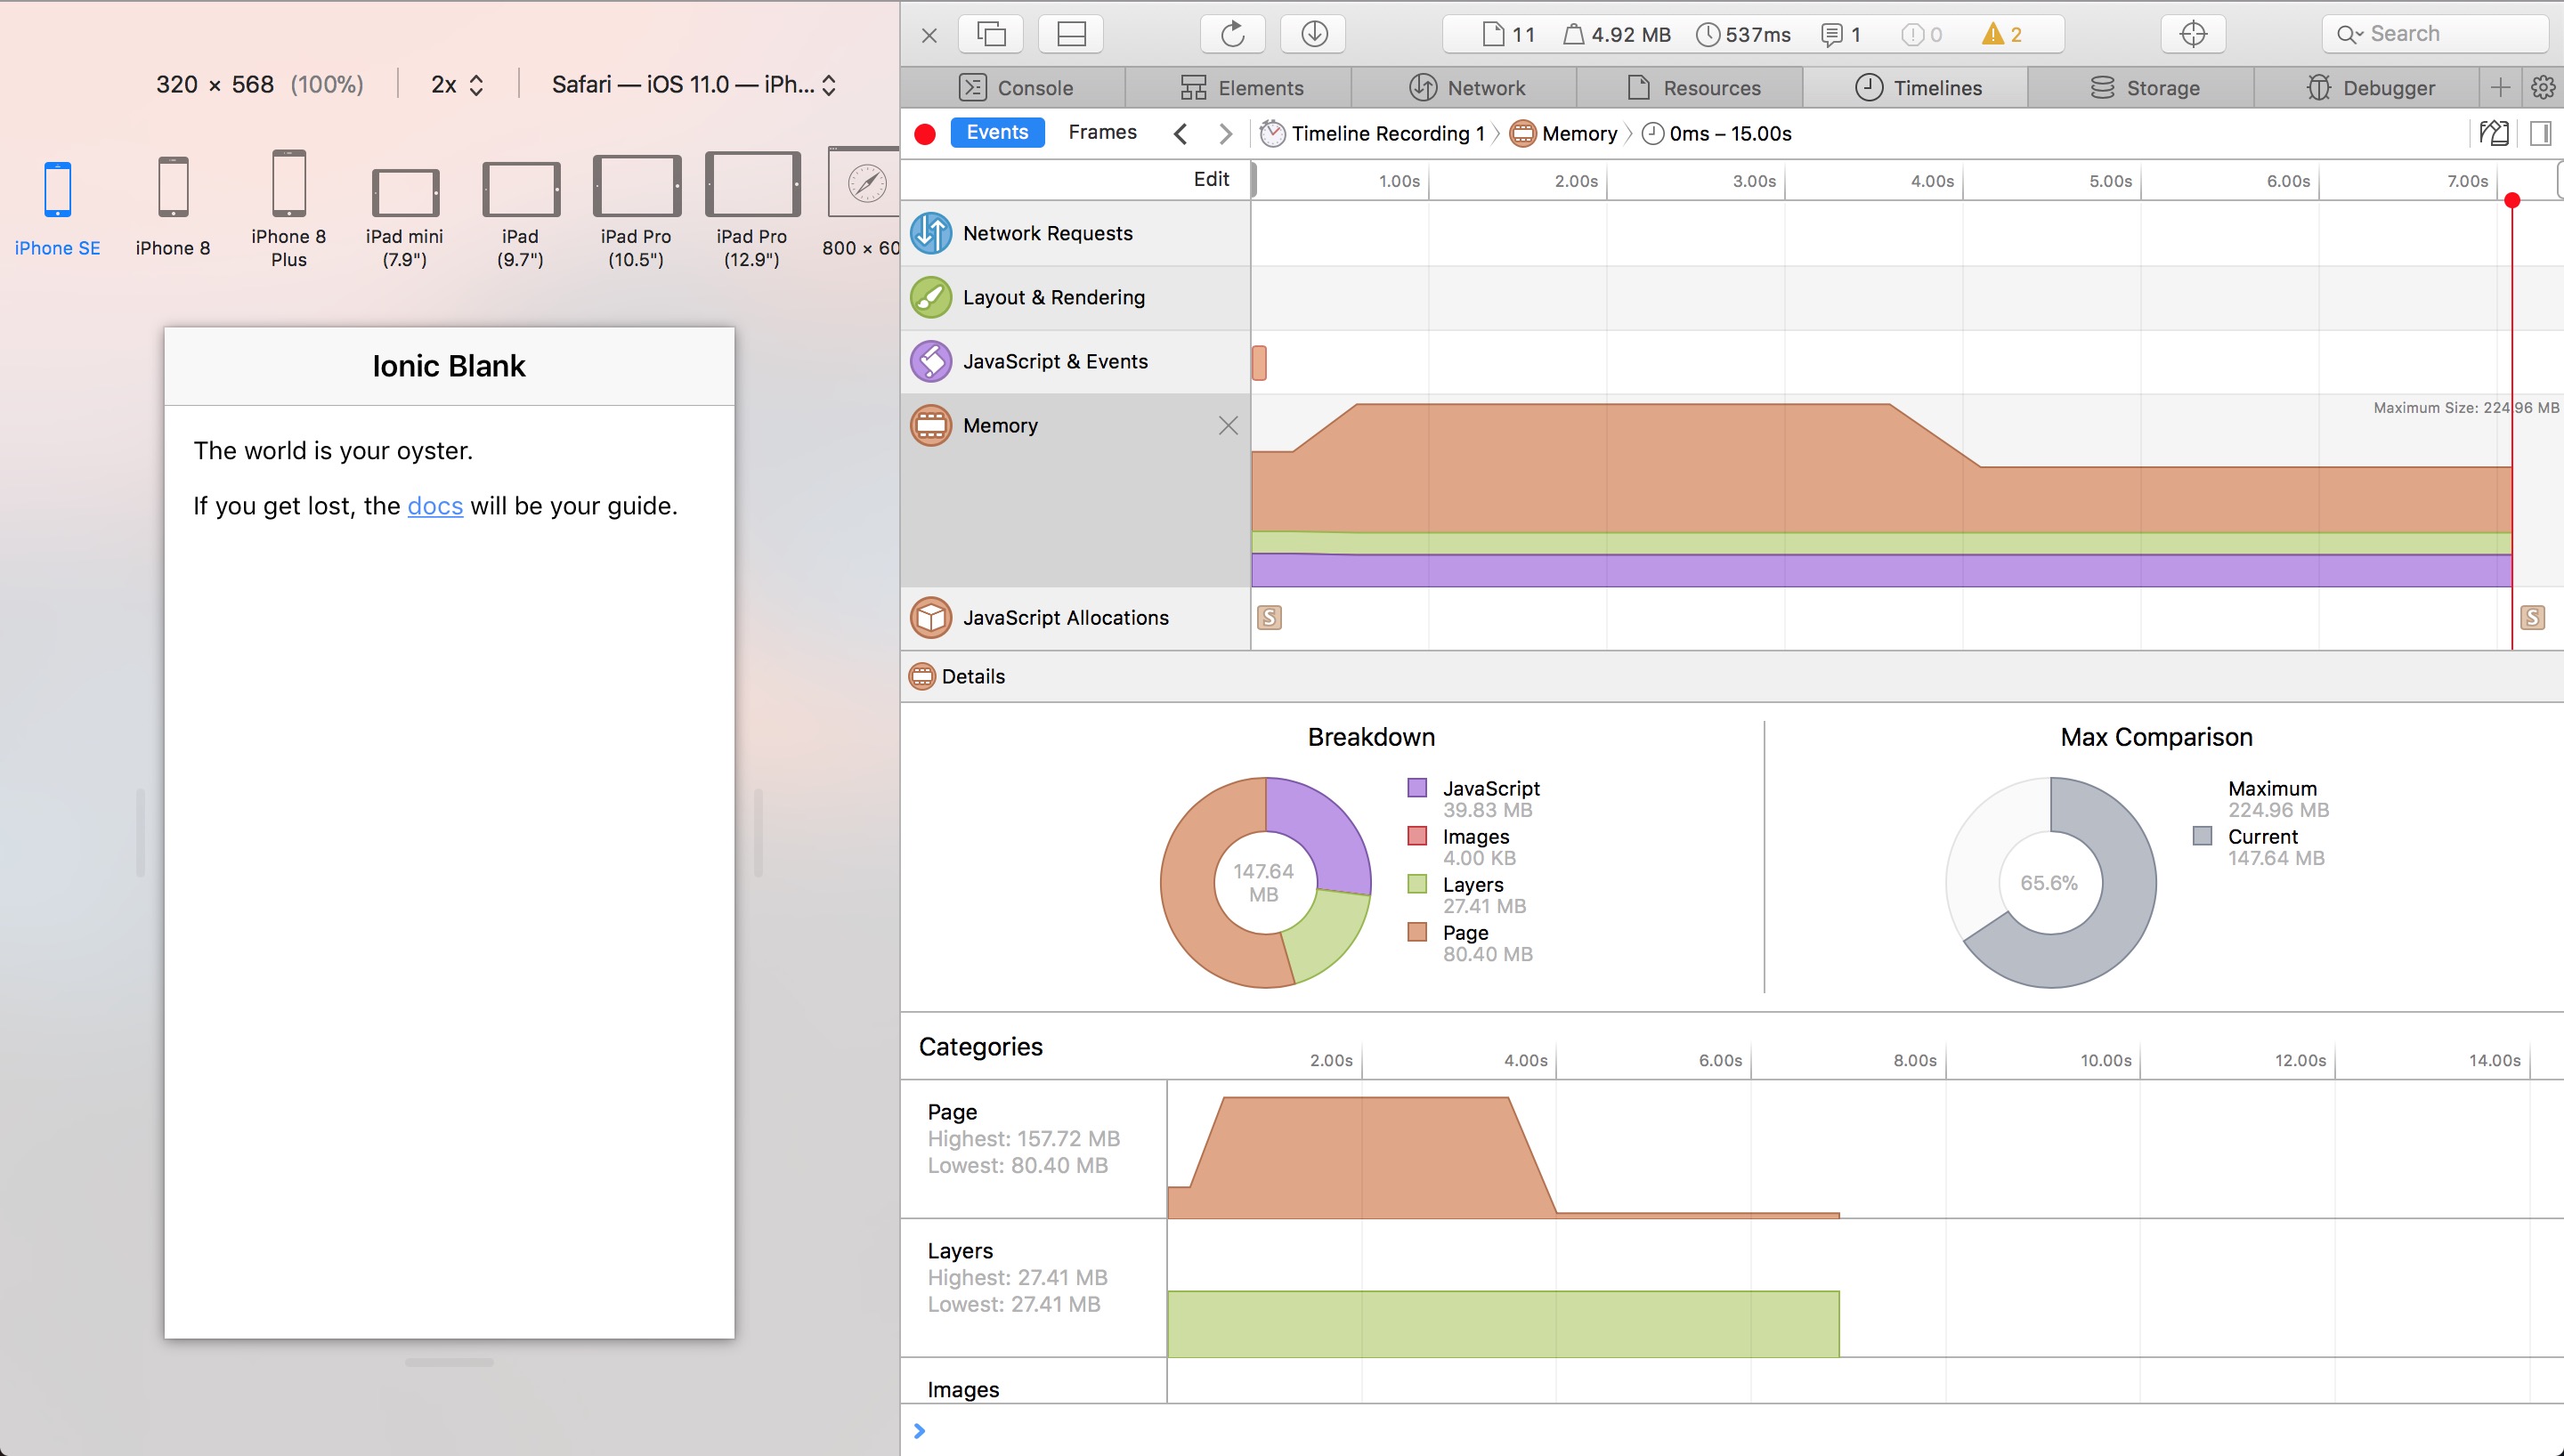
 ghost
on 4 Apr 2018
ghost
on 4 Apr 2018
I created a new angular project with the Angular CLI and profiled it to see the difference. Seems that angular is the responsible for 150MB in memory for starters.
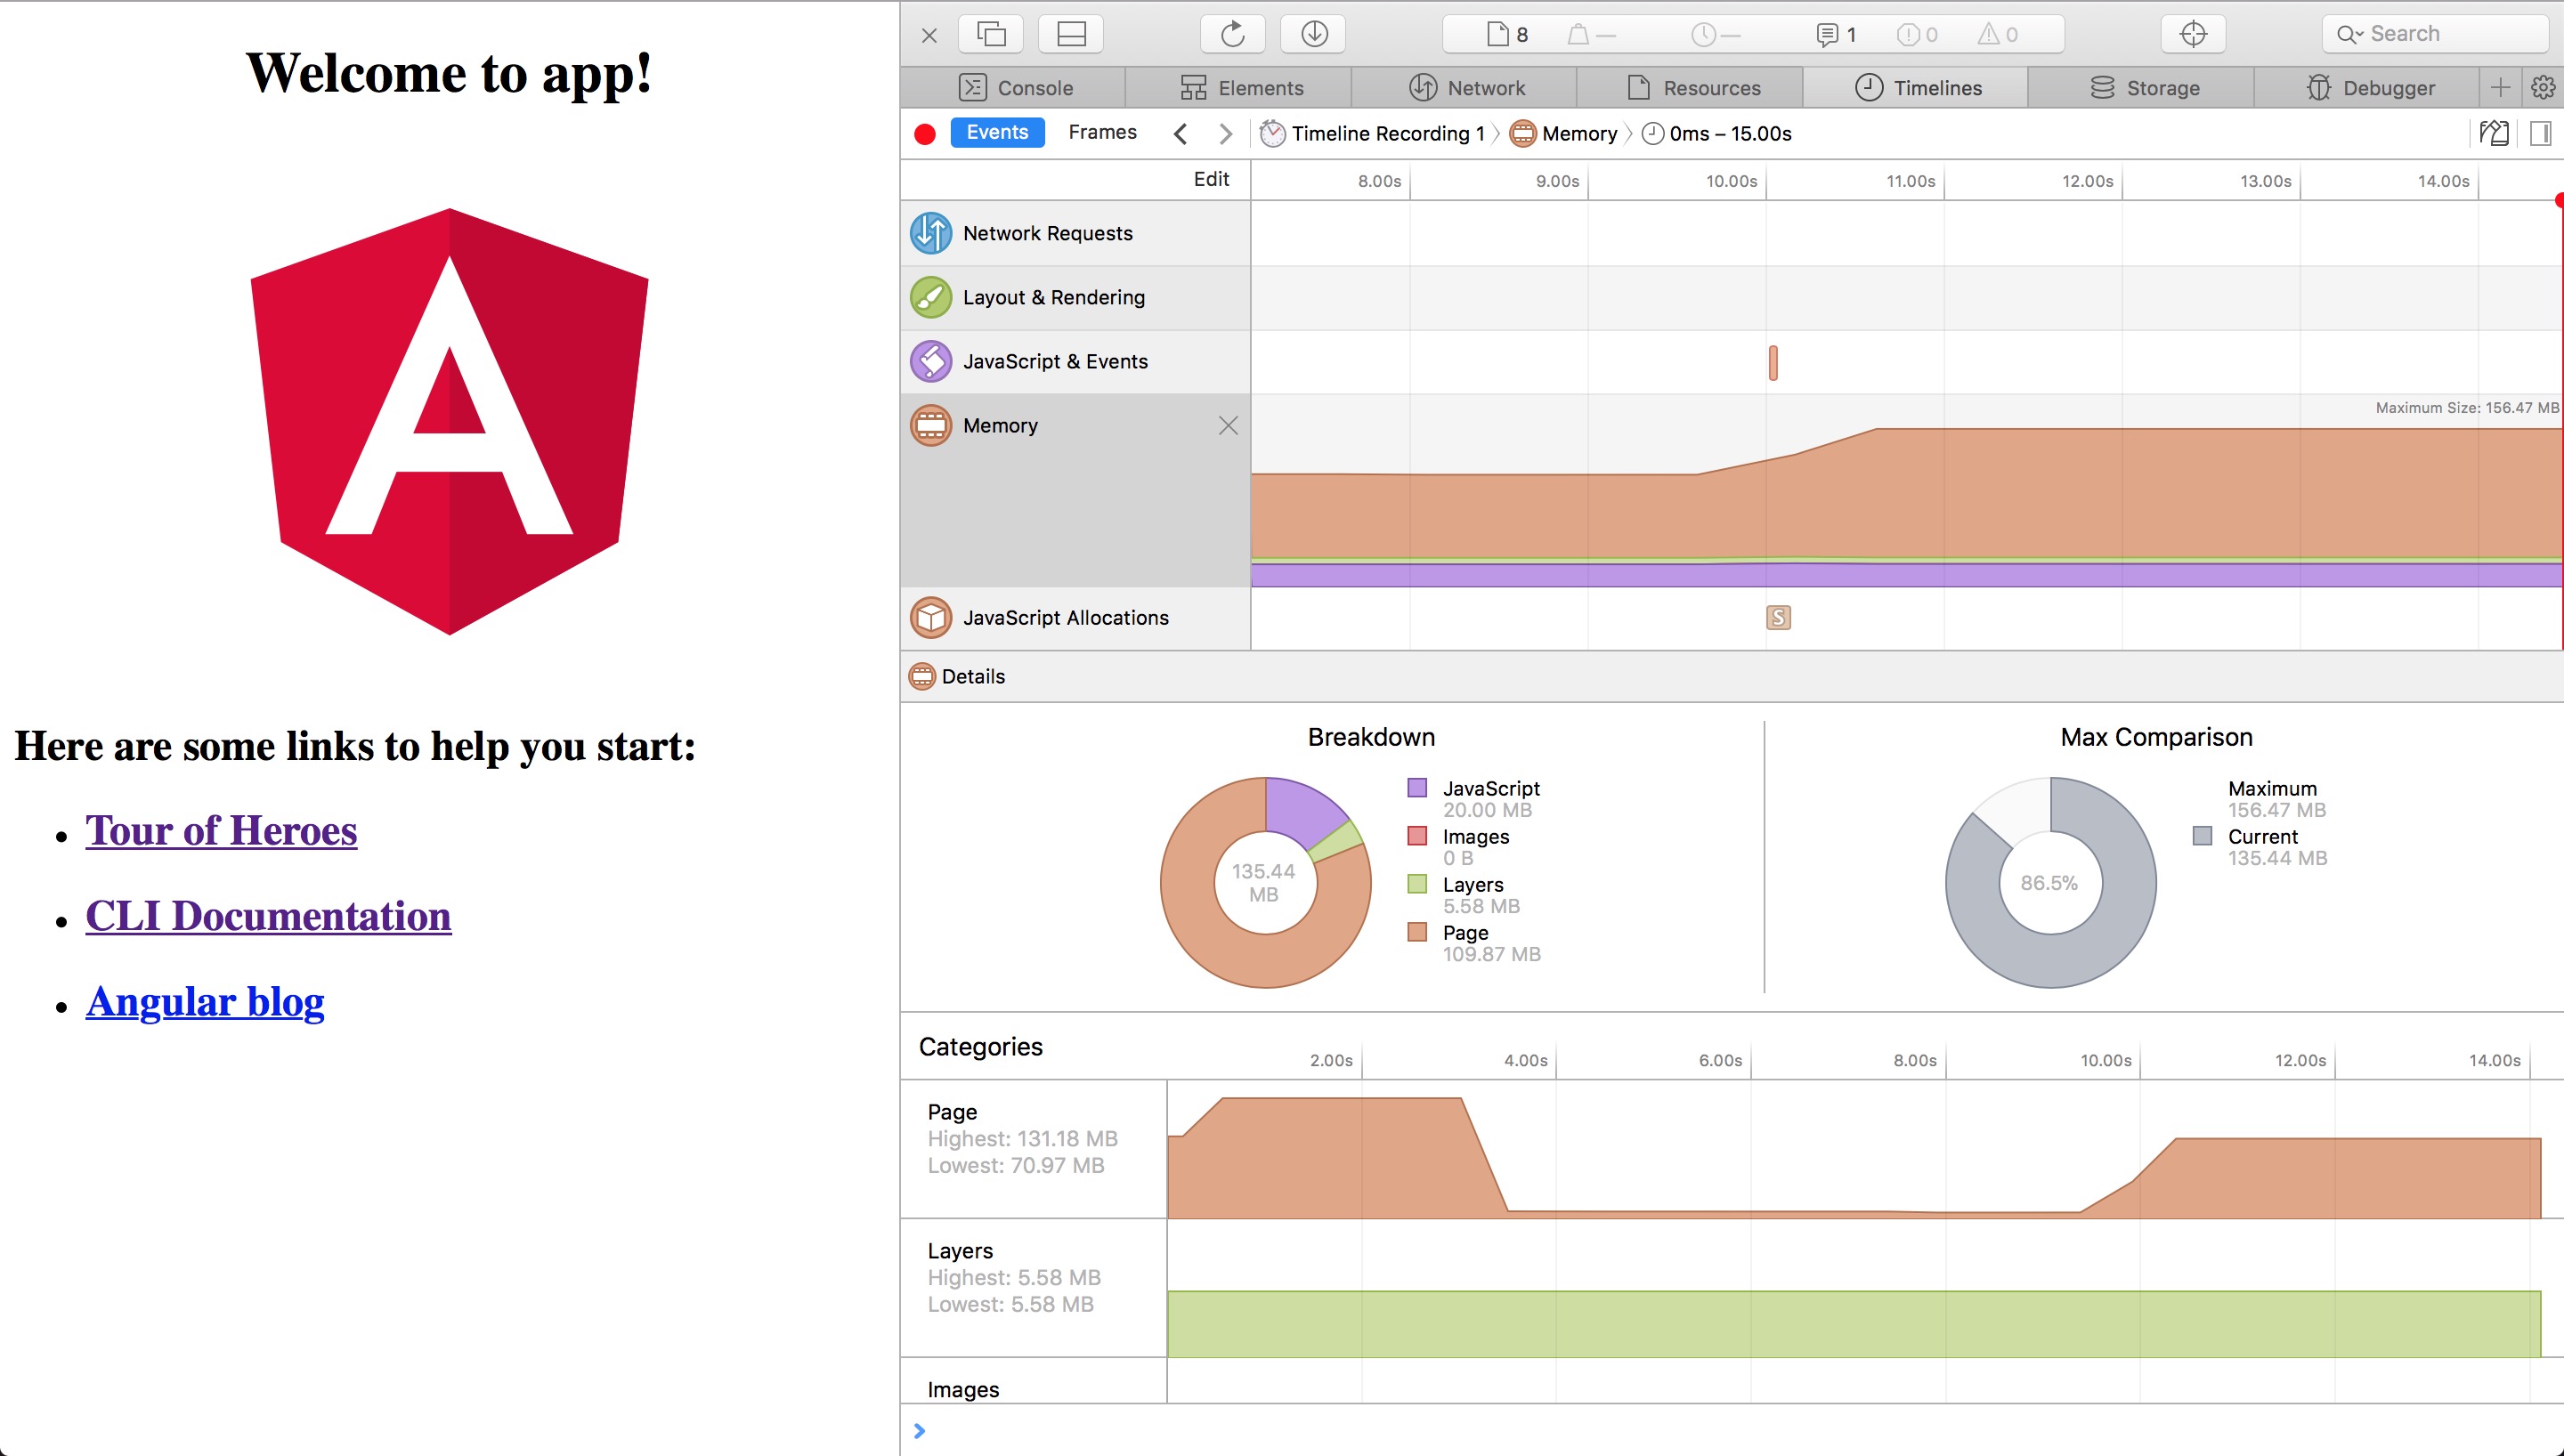
ghost
on 4 Apr 2018
Thanks for the issue! This issue is being locked to prevent comments that are not relevant to the original issue. If this is still an issue with the latest version of Ionic, please create a new issue and ensure the template is fully filled out.
![ionitron-bot[bot] picture](https://avatars1.githubusercontent.com/in/8640?v=4&s=40) ionitron-bot[bot]
on 1 Sep 2018
ionitron-bot[bot]
on 1 Sep 2018
Related issues
 Macstyg
·
3Comments
Macstyg
·
3Comments
 gio82
·
3Comments
gio82
·
3Comments
 SebastianGiro
·
3Comments
SebastianGiro
·
3Comments
 masimplo
·
3Comments
masimplo
·
3Comments
 brandyscarney
·
3Comments
brandyscarney
·
3Comments
Most helpful comment
@gitdisrupt Unfortunately we have not been able to reproduce this issue on our end. Would you mind checking your app on your device with safari dev tools instead of the memory tool in xcode? The reason I recommend this is because the xcode memory tools can be misleading in the fact that it's not actually measuring memory usage of the javascript heap of the app, instead, it is reading the memory used by the kernel / OS itself. So based off the same concept I described here, the OS will not free up memory used by the JS virtual machine if it 1. thinks the action that used that memory is going to happen often and 2. thinks that it has plenty of memory to spare. So, while the JS heap memory will be shrinking every time the JS engine runs garbage collection, that does not mean that the memory that iOS has allocated to the browser will shrink, and, if iOS did start freeing up memory when it has plenty of memory available you would actually see performance issues. Also, it's important to remember that high memory usage does not === a memory leak and in fact operating systems are built to take the most advantage of the resources (in this case ram) available to it, especially on mobile devices.