Incubator-superset: [Chart]Echarts pie chart quirks in 0.38
Describe the bug
There remain some quirks in the new Echarts-based pie chart.
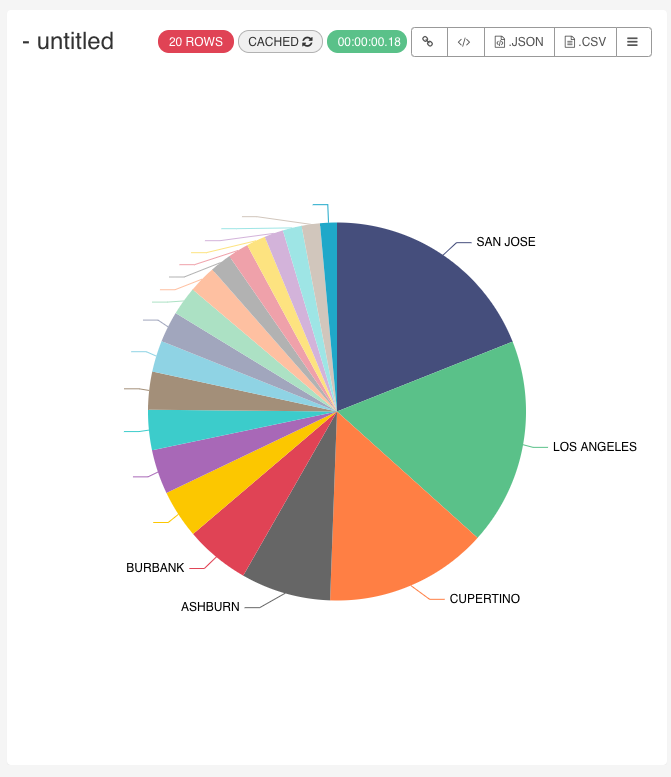
If label lines are turned on and there is no label, e.g. the label is disabled for the slice because it doesn't meet the percent threshold, you have lines coming off the slices with no associated text.
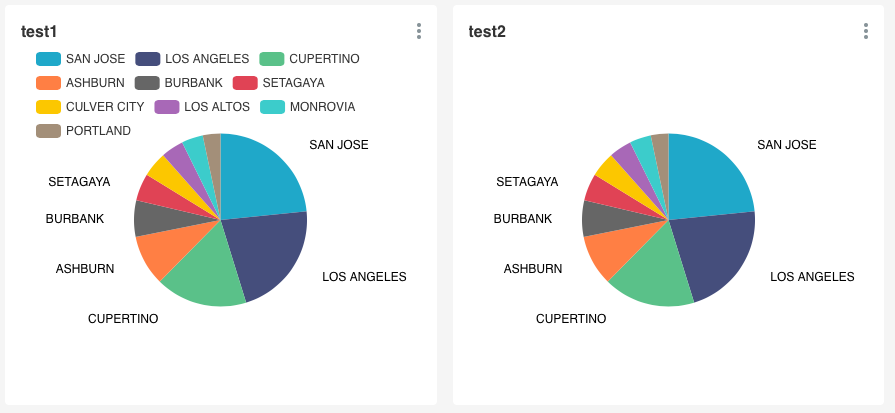
The chart layout isn't automatic with the legend. If you want to fit the legend, you have to manually resize the pie chart smaller so the legend will fit. With the legend showing, the chart isn't shifted down vertically to use the unused whitespace. The chart thus needs to be smaller than before with the legend showing.
Screenshots
Example of 1st item:
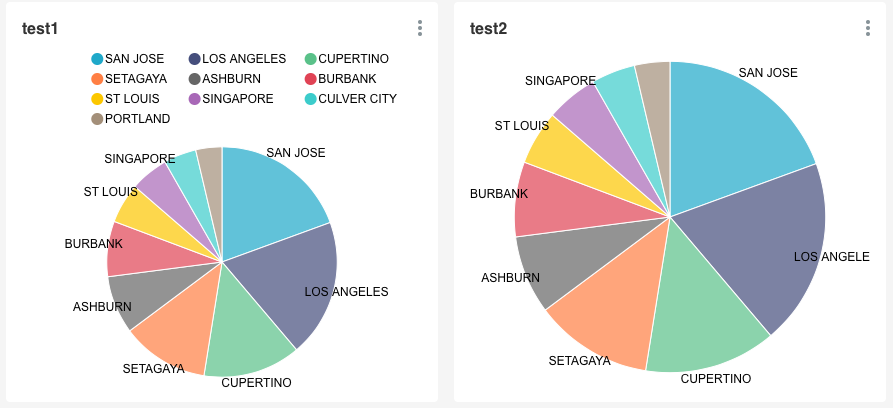
Example of 2nd item:
In 0.37 the chart size and layout was automatic and would fill available whitespace.
In 0.38, you need to manually size the chart to fit available white space. Also, the chart layout doesn't shift down to accomodate the legend.
cc @bryanck
@eugeniamz
 junlincc
All 4 comments
Issue-Label Bot is automatically applying the label #bug to this issue, with a confidence of 0.71. Please mark this comment with :thumbsup: or :thumbsdown: to give our bot feedback!
Links: app homepage, dashboard and code for this bot.
![issue-label-bot[bot] picture](https://avatars2.githubusercontent.com/in/27079?v=4&s=40) issue-label-bot[bot]
on 5 Nov 2020
issue-label-bot[bot]
on 5 Nov 2020
I looked into disabling individual lines when adding the threshold parameter, but it appears it can currently only be defined for all slices under the series.labelLine property. I believe we'd need to make it possible to pass a callback to labelLine that enables/disables it per slice, similar to how label.formatter currently works. At any rate the change would need to be done in ECharts.
Similarly, automatic resizing of the chart based on the legend size is currently not supported. However, I understood that the core ECharts committers are considering adding this feature in an upcoming release.
I would almost propose opening tickets on the ECharts GitHub repo, so we can continue the discussion and coordinate fixing these issues there.
 villebro
on 10 Nov 2020
villebro
on 10 Nov 2020
the more i think about this .. the more i want to hide all legend by default...
junlincc
on 20 Nov 2020
new Echarts pie chart is available! check out https://github.com/apache-superset/superset-ui/pull/852
closing this issue
junlincc
on 4 Dec 2020
Related issues
 sashank
·
3Comments
sashank
·
3Comments
 ghost
·
3Comments
ghost
·
3Comments
 lenguyenthedat
·
3Comments
lenguyenthedat
·
3Comments
 fly-high-bj
·
3Comments
fly-high-bj
·
3Comments
 ylkjick532428
·
3Comments
ylkjick532428
·
3Comments
Most helpful comment
I looked into disabling individual lines when adding the threshold parameter, but it appears it can currently only be defined for all slices under the
series.labelLineproperty. I believe we'd need to make it possible to pass a callback tolabelLinethat enables/disables it per slice, similar to howlabel.formattercurrently works. At any rate the change would need to be done in ECharts.Similarly, automatic resizing of the chart based on the legend size is currently not supported. However, I understood that the core ECharts committers are considering adding this feature in an upcoming release.
I would almost propose opening tickets on the ECharts GitHub repo, so we can continue the discussion and coordinate fixing these issues there.