Incubator-superset: Filters not being applied on annotation layers
Filters fail to be applied on annotation layers added to a time series line chart. The filter will only be applied to the base line chart onto which the annotation layers were added. The annotation layer graphs remain the same.
Expected results
Filters to be applied on annotation layers
Actual results
Filters are only applied to the base chart. Annotation layer graphs remain unchanged.
Screenshots
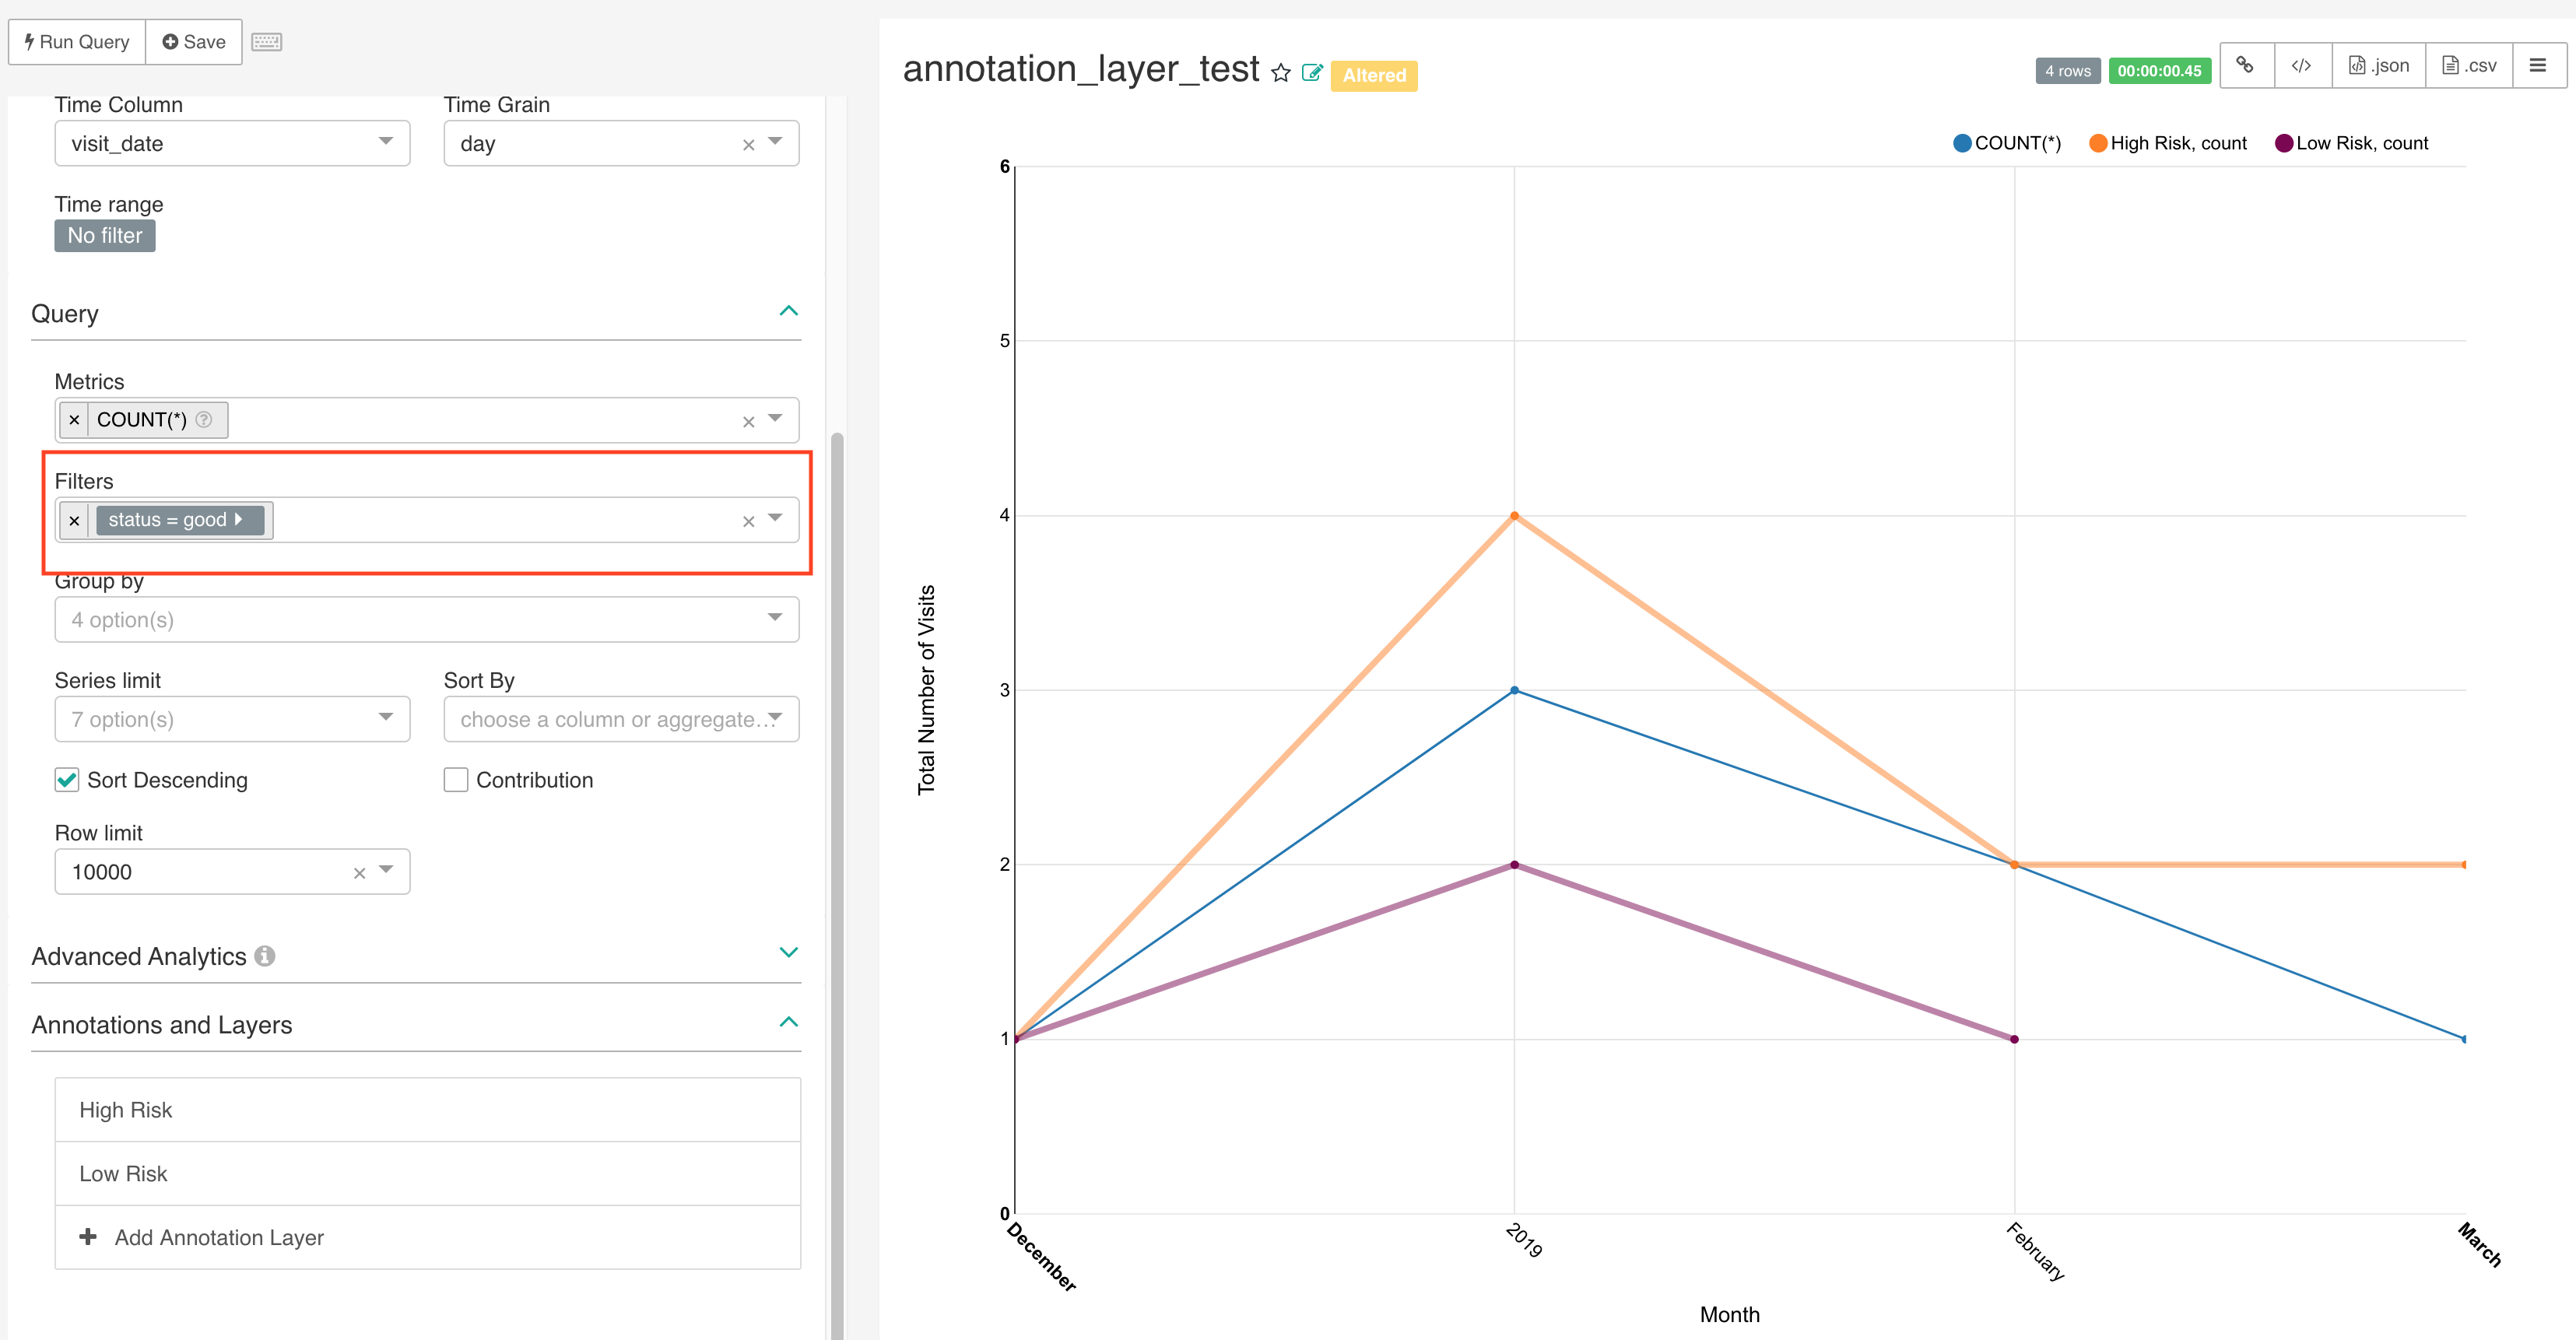
The chart below shows the number of visits to a facility observed between December and March. There are three line graphs: The blue line graph which is the base graph, plots the total number of visits made in a month. The other two line graphs represent two added annotation layers, the High Risk layer(orange) and Low Risk layer(maroon). Each of these annotation layers show the total visits done for each of the risk cases per month.

On applying a filter as highlighted by the red box, the values of the line graphs remain the same for both the annotation layers (High risk and low risk line graphs). Only values of the base chart(blue graph) are updated.
Environment
- superset version:
0.34.0 - python version:
3.6
Steps to reproduce
1) Plot a time series
2) Add annotation layers (also time series)
3) Apply a filter
Checklist
Make sure these boxes are checked before submitting your issue - thank you!
- [x] I have checked the superset logs for python stacktraces and included it here as text if there are any.
- [x] I have reproduced the issue with at least the latest released version of superset.
- [x] I have checked the issue tracker for the same issue and I haven't found one similar.
 HusnaHariz
All 2 comments
Issue-Label Bot is automatically applying the label #bug to this issue, with a confidence of 0.97. Please mark this comment with :thumbsup: or :thumbsdown: to give our bot feedback!
Links: app homepage, dashboard and code for this bot.
![issue-label-bot[bot] picture](https://avatars2.githubusercontent.com/in/27079?v=4&s=40) issue-label-bot[bot]
on 25 Nov 2019
issue-label-bot[bot]
on 25 Nov 2019
This issue has been automatically marked as stale because it has not had recent activity. It will be closed if no further activity occurs. Thank you for your contributions. For admin, please label this issue .pinned to prevent stale bot from closing the issue.
![stale[bot] picture](https://avatars3.githubusercontent.com/in/1724?v=4&s=40) stale[bot]
on 24 Jan 2020
stale[bot]
on 24 Jan 2020
Related issues
 fly-high-bj
·
3Comments
fly-high-bj
·
3Comments
 josephtyler
·
3Comments
josephtyler
·
3Comments
 ylkjick532428
·
3Comments
ylkjick532428
·
3Comments
 dinhhuydh
·
3Comments
dinhhuydh
·
3Comments
 gbrian
·
3Comments
gbrian
·
3Comments
Most helpful comment
Issue-Label Bot is automatically applying the label
#bugto this issue, with a confidence of 0.97. Please mark this comment with :thumbsup: or :thumbsdown: to give our bot feedback!Links: app homepage, dashboard and code for this bot.