Incubator-superset: druid connector multiple time shift bug
Superset version: 0.26.2
superset druid connector bug with time series - line chart. when we use more than one time shift like 1 day, 1 week time shift, the chart will show like this:
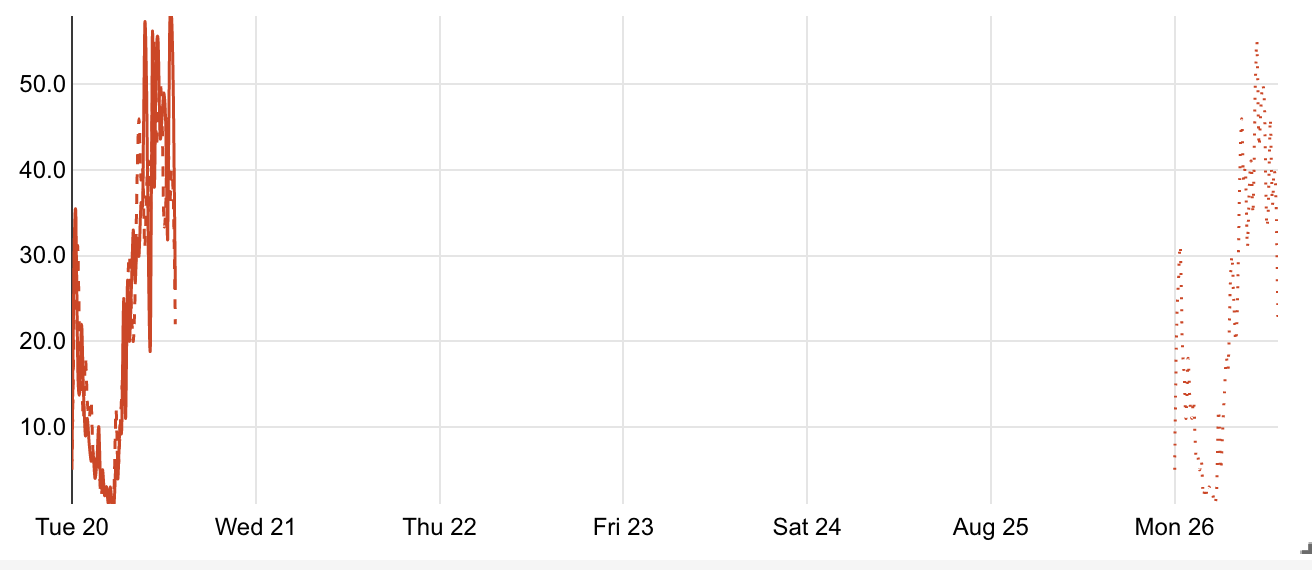
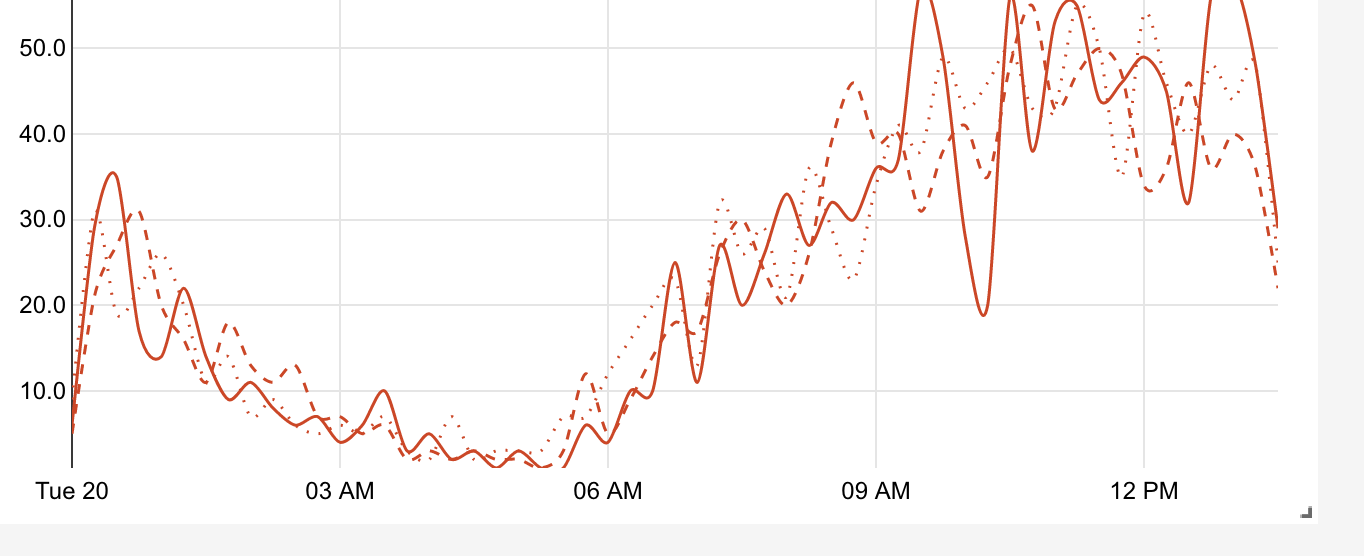
Expected results
three lines separate and render data within the whole x-axis
what you expected to happen.
the chart could render correctly like above image.
How to reproduce the bug
- Go to 'Chart', new chart, select a datasource.
- make a chart with viz type: 'time series - line chart'. then in the
advanced analytics, choose more than one time shift. - press
Run Query
Advanced Analytics like below

Environment
(please complete the following information):
- superset version:
0.26.2 - python version:
2.7
Checklist
Make sure these boxes are checked before submitting your issue - thank you!
- [x ] I have checked the superset logs for python stacktraces and included it here as text if there are any.
- [ x] I have reproduced the issue with at least the latest released version of superset.
- [x ] I have checked the issue tracker for the same issue and I haven't found one similar.
Additional context
We debug and find the root cause, the cache key will be conflict for those time shift. That means 1 week time shift will use 1 day time shift's data.
Why the cache_key conflct? https://github.com/apache/incubator-superset/blob/0.26.2/superset/viz.py#L342 because the difference of 1 day and 1 week key was delete.
Does anyone have the same problem? should we change the logic of cache_key?
 yamyamyuo
All 2 comments
Issue-Label Bot is automatically applying the label #bug to this issue, with a confidence of 0.97. Please mark this comment with :thumbsup: or :thumbsdown: to give our bot feedback!
Links: app homepage, dashboard and code for this bot.
![issue-label-bot[bot] picture](https://avatars2.githubusercontent.com/in/27079?v=4&s=40) issue-label-bot[bot]
on 20 Aug 2019
issue-label-bot[bot]
on 20 Aug 2019
This issue has been automatically marked as stale because it has not had recent activity. It will be closed if no further activity occurs. Thank you for your contributions. For admin, please label this issue .pinned to prevent stale bot from closing the issue.
![stale[bot] picture](https://avatars3.githubusercontent.com/in/1724?v=4&s=40) stale[bot]
on 19 Oct 2019
stale[bot]
on 19 Oct 2019
Related issues
 gbrian
·
3Comments
gbrian
·
3Comments
 john-bodley
·
3Comments
john-bodley
·
3Comments
 XiaodiKong
·
3Comments
XiaodiKong
·
3Comments
 josephtyler
·
3Comments
josephtyler
·
3Comments
 joshuacano
·
3Comments
joshuacano
·
3Comments
Most helpful comment
Issue-Label Bot is automatically applying the label
#bugto this issue, with a confidence of 0.97. Please mark this comment with :thumbsup: or :thumbsdown: to give our bot feedback!Links: app homepage, dashboard and code for this bot.