Incubator-superset: Remove and Re-align the Bar values on clicking the legend
Make sure these boxes are checked before submitting your issue - thank you!
- [x] I have checked the superset logs for python stacktraces and included it here as text if any
- [x] I have reproduced the issue with at least the latest released version of superset
- [x] I have checked the issue tracker for the same issue and I haven't found one similar
Superset version
23.3
Actual Results
Hi Team , when trying to uncheck the legend in the time series bar chart , The bar values does not clean up . This appear for both grouped and stacked chart .
Before unchecking the legend
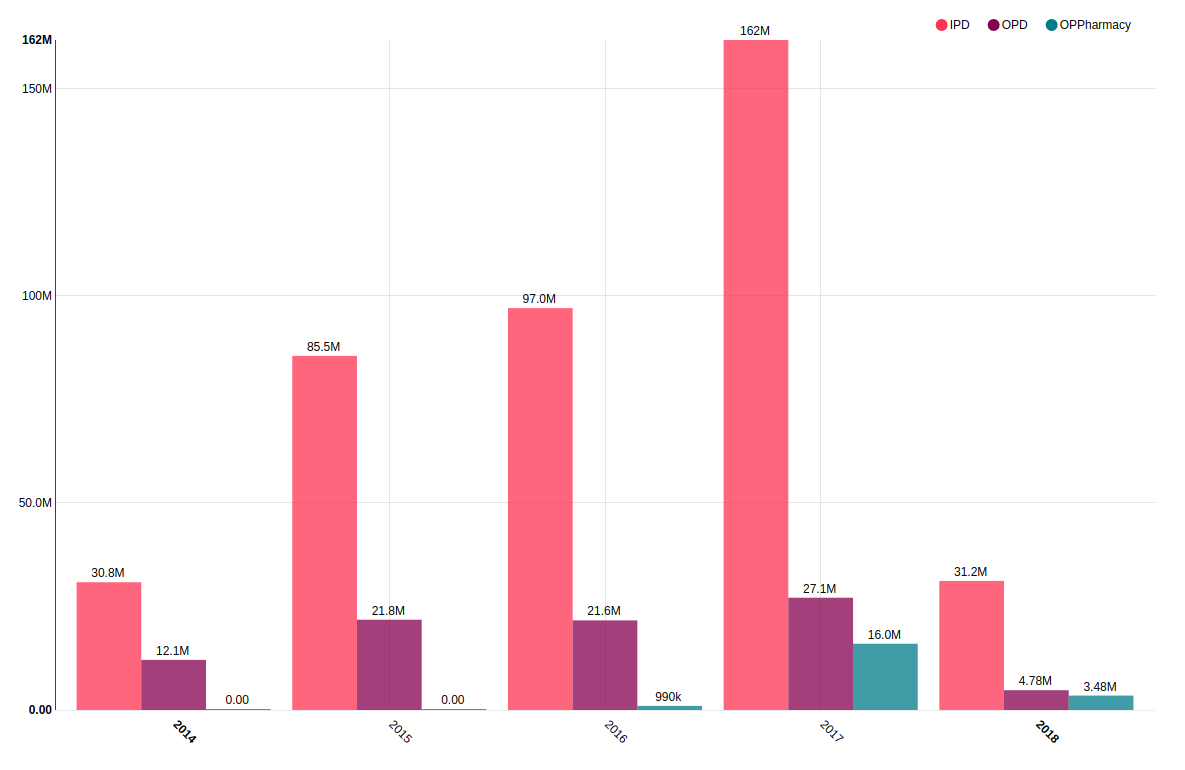
After unchecking the legend , i have unchecked (IPD) in the legend , But still the bar values appear .
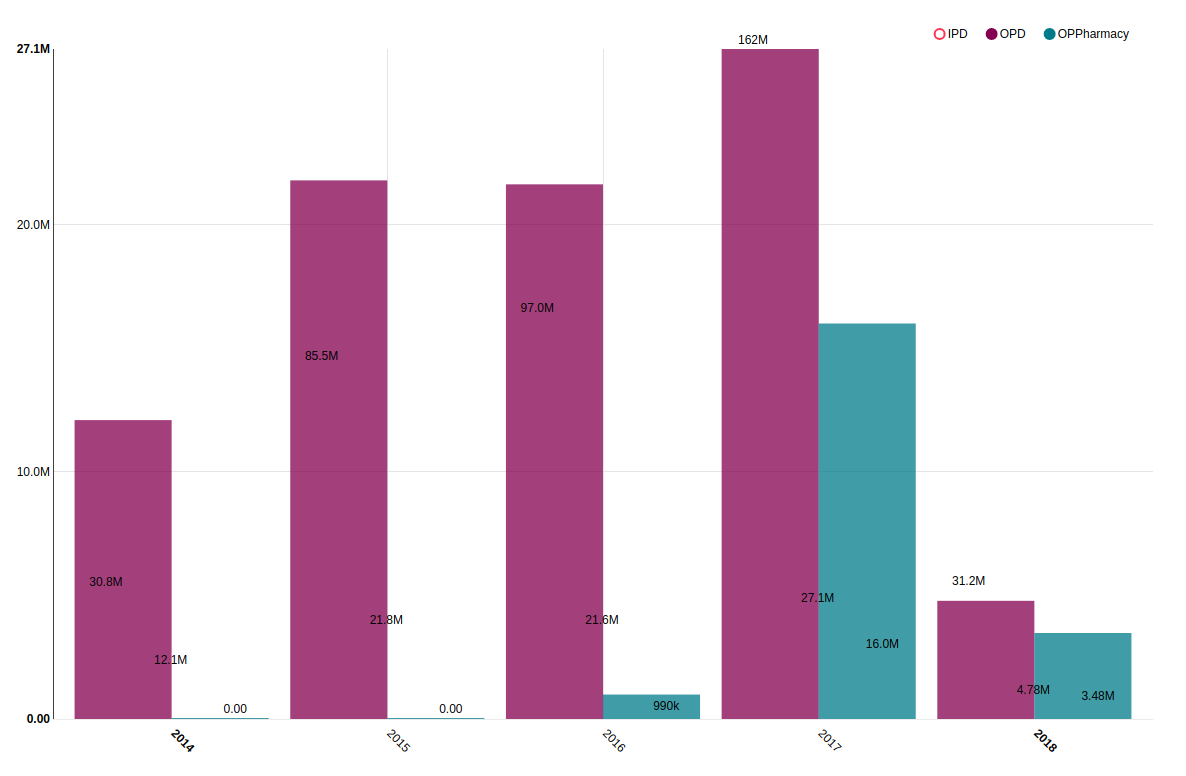
Expected Results
When the legend(s) is/are unchecked the bar values for that legend(s) should not be visible and the bar values for the remaining bars should be re-aligned .
Steps to Reproduce
- create a chart with time series bar as visualisation type
- choose a metric and choose a column under group by
- check the legends and bar values check box
- Now in the chart click on the legend to uncheck it .
 shyam2794
All 5 comments
Hi Team ,
Any update on this ..
shyam2794
on 26 Mar 2018
We are also having a similar issue in our use case of showing markers in line charts, where unchecking/rechecking a legend renders the new line without markers.
Steps to reproduce:
- Create a line chart with a metric and multiple groups
- Check the "Show Markers" option in Style
- Uncheck and recheck a group via the legend
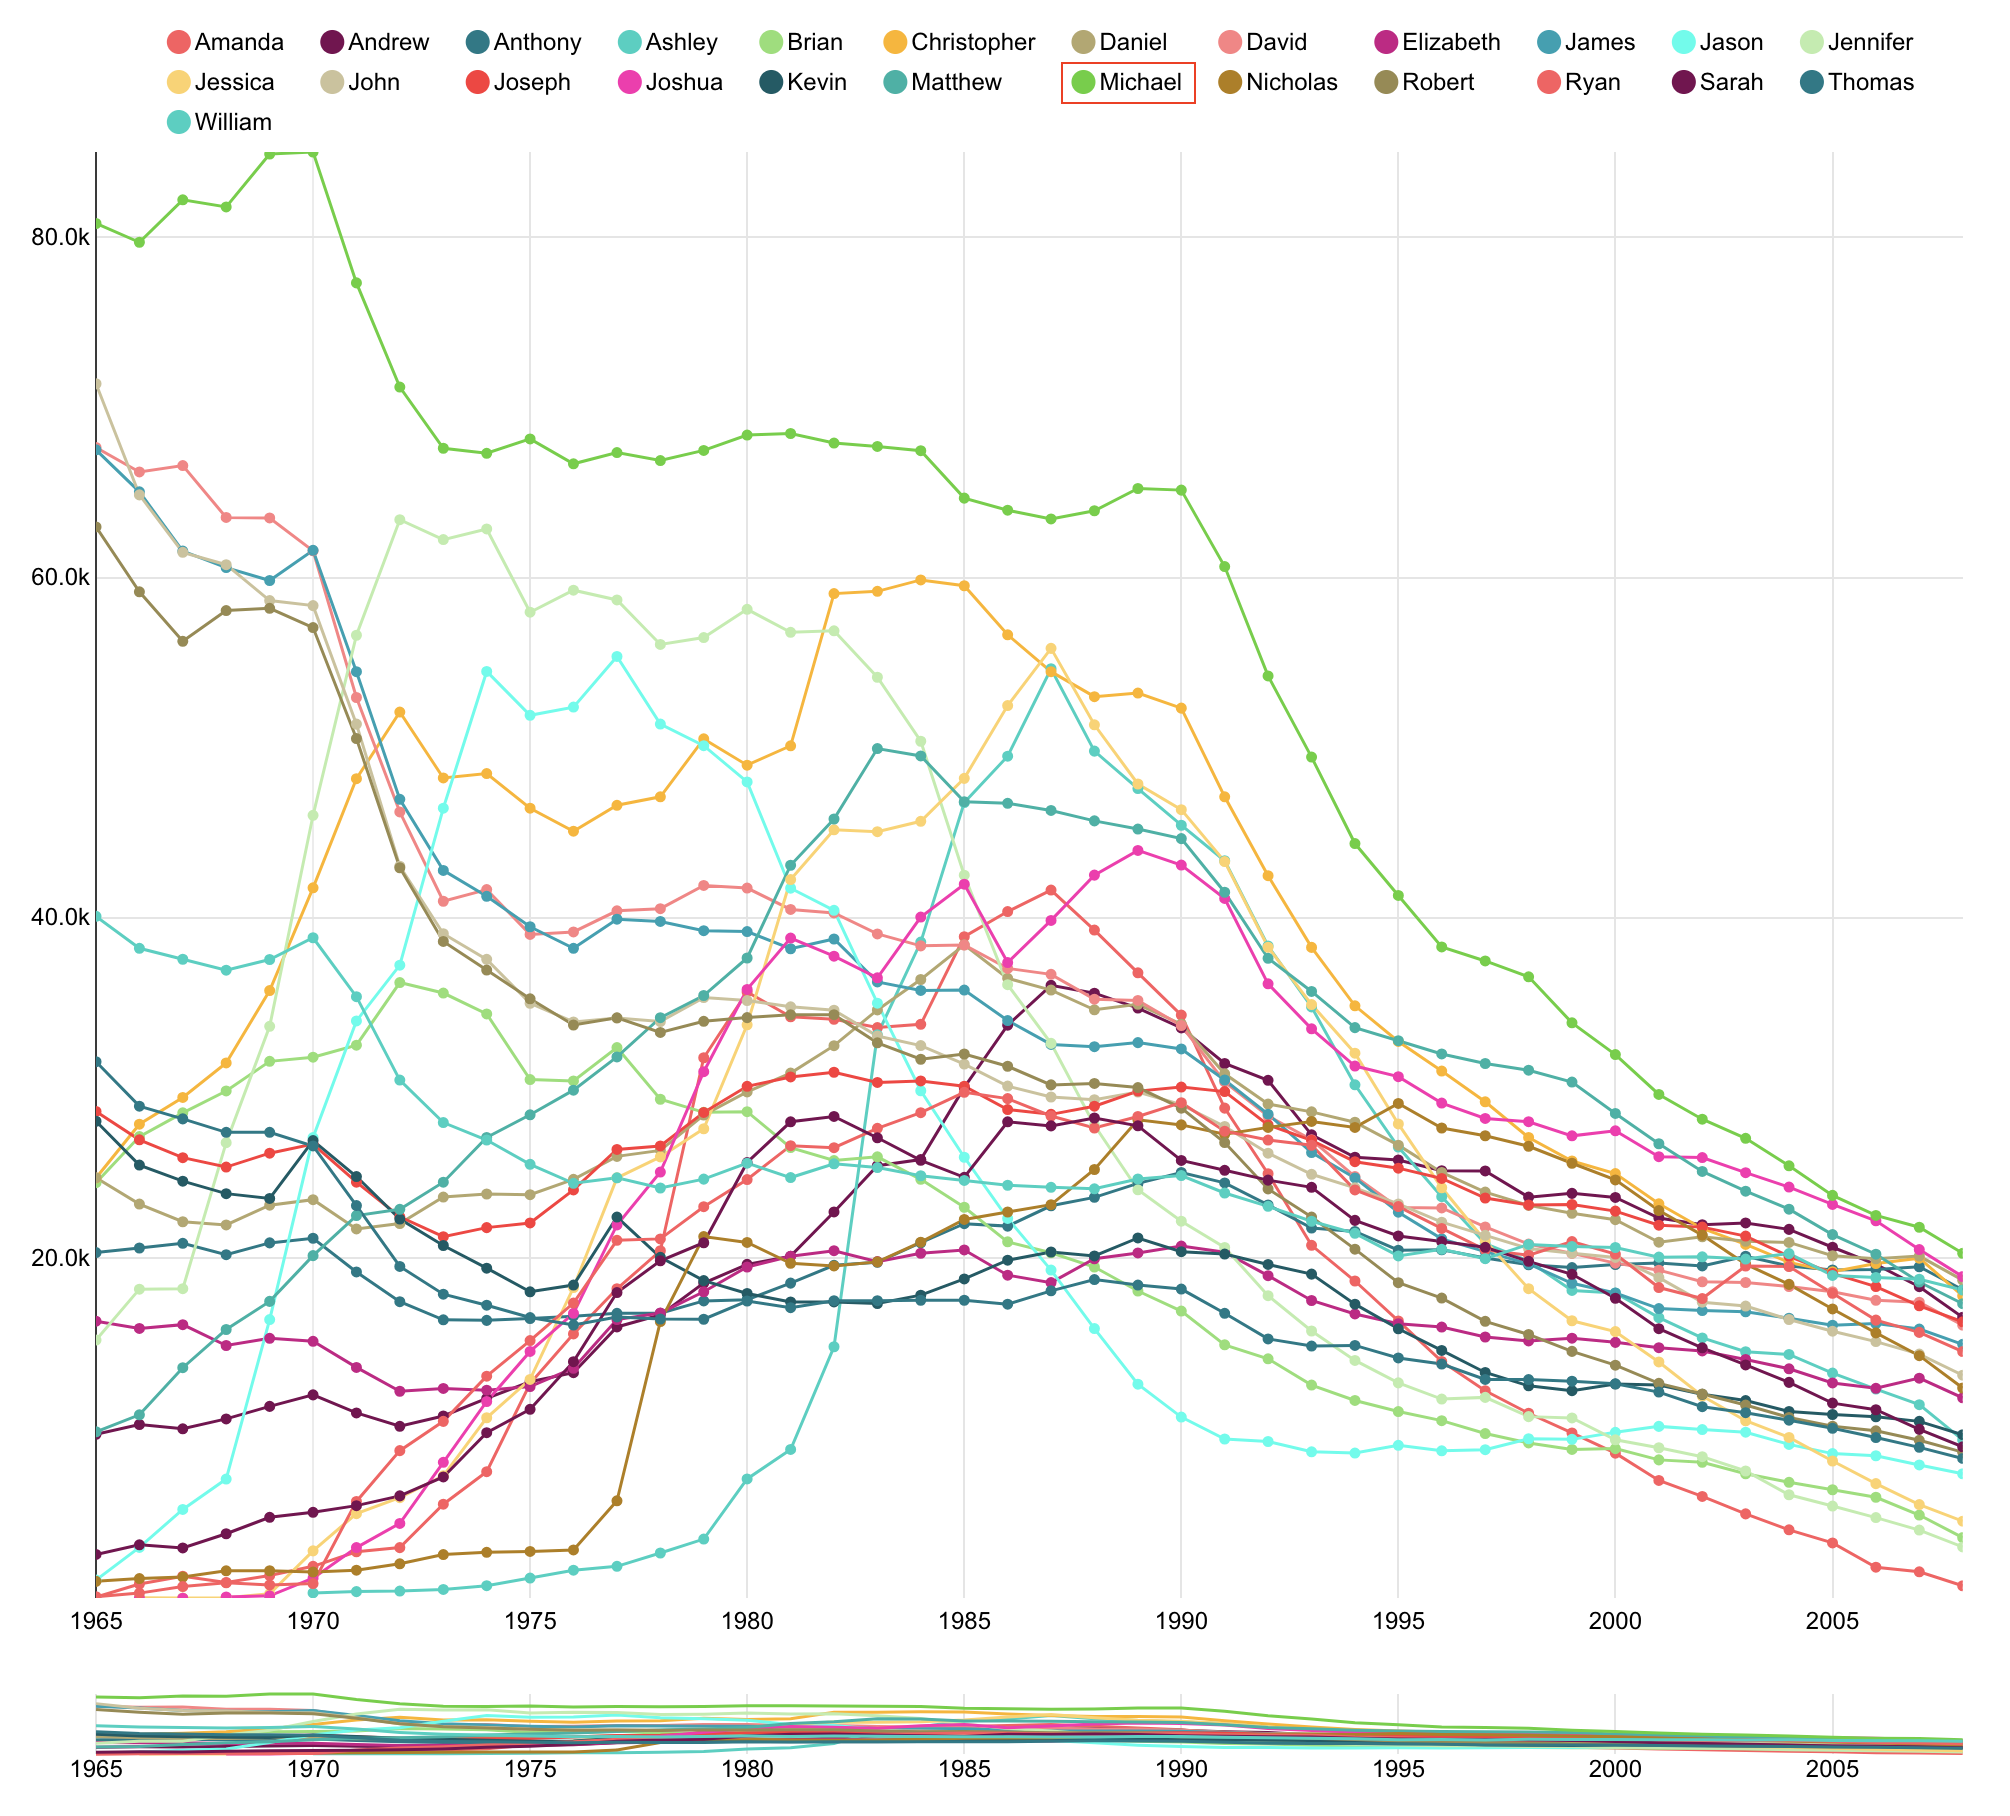
Before uncheck/recheck:
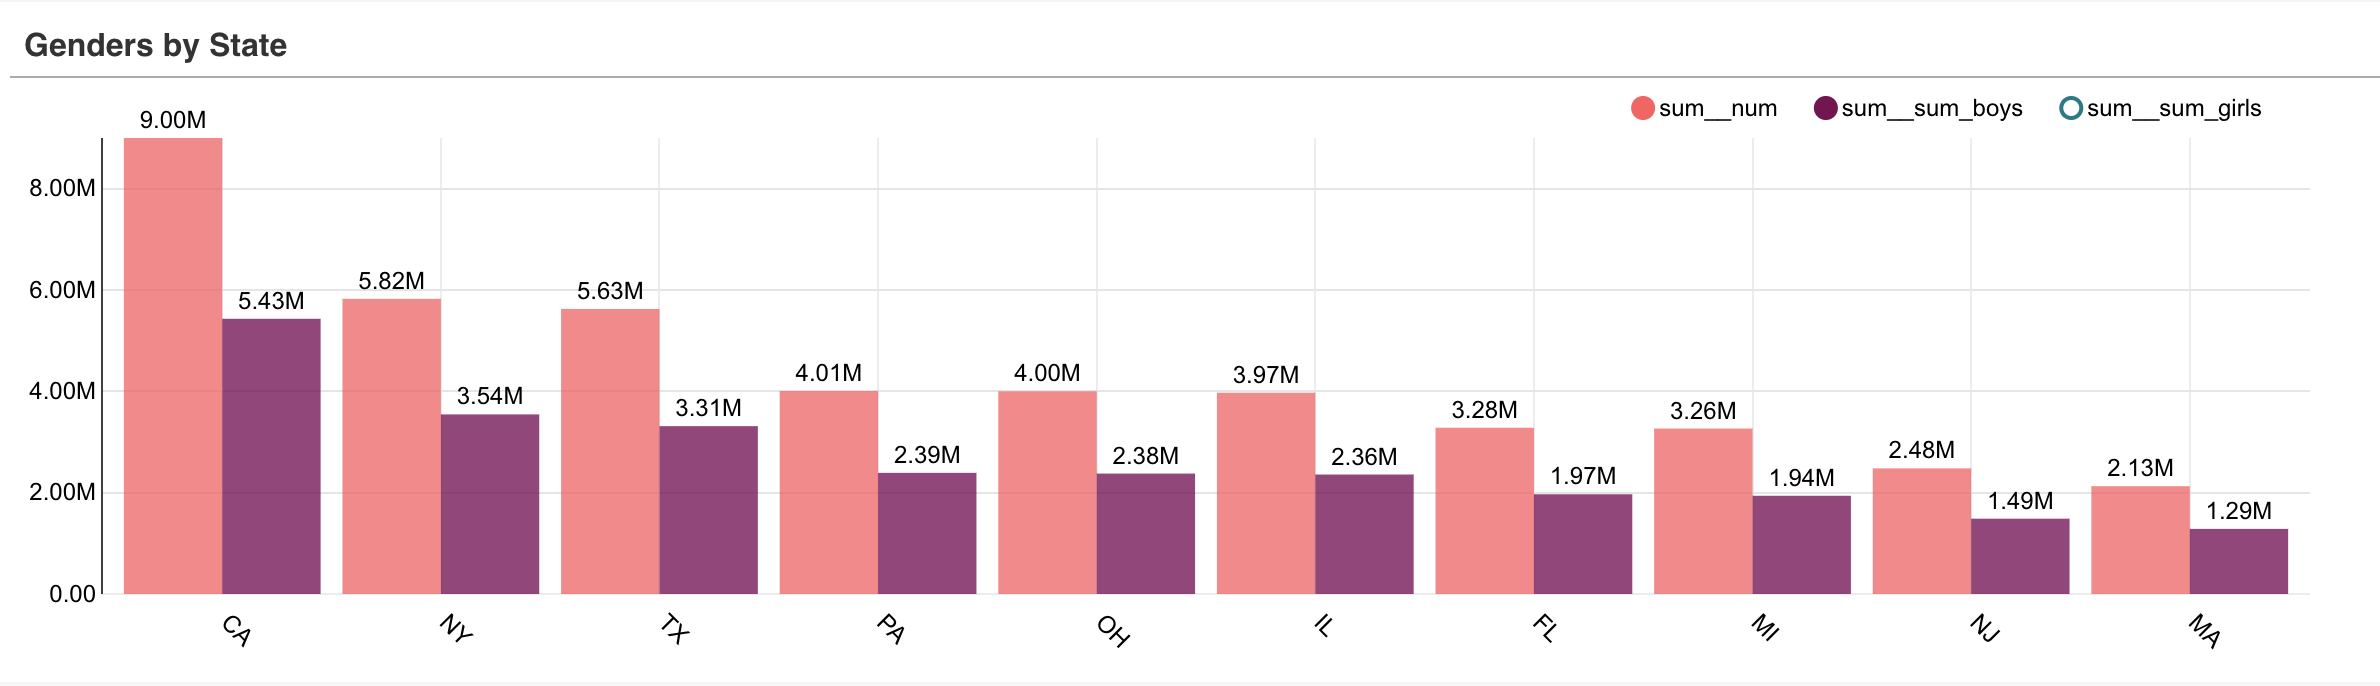
After uncheck/recheck:

EDIT: My bad, seems to already be described here https://github.com/apache/incubator-superset/issues/3614. If the line chart issue is unrelated to the bar chart issue, I can move the conversation to the other ticket.
 jeffreythewang
on 7 Jun 2018
jeffreythewang
on 7 Jun 2018
I also met this bug. I fix it by adding following code to NVD3VIs.js file:
find
case 'dist_bar':
        chart = nv.models.multiBarChart()
          .showControls(showControls)
          .reduceXTicks(reduceXTicks)
          .groupSpacing(0.1); // Distance between each group of bars.
add the following code:
chart.legend.dispatch.on('legendClick',function (evt) {
              svg.selectAll('.bar-chart-label').remove();
              setTimeout(function () {
                  if(!fd.show_bar_value){
                      svg.selectAll('.bar-chart-label').remove();
                  }
                  addTotalBarValues(svg, chart, data, stacked, fd.y_axis_format);

              }, animationTime + 1);


          })
And the label are there~
 zhihaozhang
on 19 Oct 2018
zhihaozhang
on 19 Oct 2018
This issue has been automatically marked as stale because it has not had recent activity. It will be closed if no further activity occurs. Thank you for your contributions.
![stale[bot] picture](https://avatars3.githubusercontent.com/in/1724?v=4&s=40) stale[bot]
on 10 Apr 2019
stale[bot]
on 10 Apr 2019
This seems like a valid thing to add, no?
 KennethEnevoldsen
on 31 Oct 2019
KennethEnevoldsen
on 31 Oct 2019
Related issues
 tmccartan
·
3Comments
tmccartan
·
3Comments
 john-bodley
·
3Comments
john-bodley
·
3Comments
 dinhhuydh
·
3Comments
dinhhuydh
·
3Comments
 XiaodiKong
·
3Comments
XiaodiKong
·
3Comments
 amien90
·
3Comments
amien90
·
3Comments
Most helpful comment
I also met this bug. I fix it by adding following code to NVD3VIs.js file:
find
add the following code:
And the label are there~