Incubator-superset: Are there any ways to set the color for the chart specifically
Hi team,
Right now,When I refresh the dashboard the color of the chart would change automatically.I want to set the color for the chart and dont' change after refresh.
Could you please tell me are there any ways?
Thanks
 ijyun
ijyun
All 20 comments
@ijyun - not at the moment. Could be an interesting feature to implement. I know several people have enquired about it.
 alanmcruickshank
on 31 Mar 2017
alanmcruickshank
on 31 Mar 2017
It's somewhat challenging. Currently we guarantee that metrics of the same name in a dashboard will be the same color across charts.
There's this function/object that cycles through the palette and provide a new color for new expressions and memoizes as it goes. If you ask for Metric 1 twice it'll give you the same color.
Early on I would hash "Metric 1" and provide a color based on the hash so that "Metric 1" would ALWAYS be the same color. The problem there was that with say 8 colors, you relatively often get in situation where a chart with say 2 or 3 metrics will get the same color twice, and that's no good. A chart with "Metric 1" and "Metric 2" might have the same color for both 1 out of 8 times...
Someone in the community said they pre-populate that memoized object with an array of all their important metrics.
For reference:
https://github.com/airbnb/superset/blob/master/superset/assets/javascripts/modules/colors.js#L51
Somehow f you call category21 for an array of metrics, before you render the dashboard, colors for these metrics will be deterministic.
 mistercrunch
on 3 Apr 2017
mistercrunch
on 3 Apr 2017
Hi mistercrunch
we are interesting in this feature, can you give an advise to understand better the mechanism how is working now and how we can implement this feature .
Thanks
 olegIn80
on 26 Jul 2017
olegIn80
on 26 Jul 2017
It'd be nice to support different color schemes, and allow people to pick a default in their environment. It would also be nice to make "Colors" one of the core set of controls, cohesive across visualizations, but that's a bit more complicated.
For now the categorical colors are defined here:
https://github.com/apache/incubator-superset/blob/master/superset/assets/javascripts/modules/colors.js#L6
A first step might be to define an object with different color sets, and add a new control to most visualizations that would allow to pick the color set. And add a new DEFAULT_COLOR_SET variable in superset/config.py.
mistercrunch
on 26 Jul 2017
Hello guys!
Do you have any update about that?
In my company different products use different colors but same superset, in my particular case I can not use unique color pallet.
 renanoliveira
on 16 Jan 2018
renanoliveira
on 16 Jan 2018
It's somewhat easy to add new palettes and set one as default but you'll have to do this in your fork.
https://github.com/apache/incubator-superset/blob/master/superset/assets/javascripts/modules/colors.js#L130
It could be nice to add an environment variable to define your default color scheme without having to alter the code and bake your own build.
mistercrunch
on 17 Jan 2018
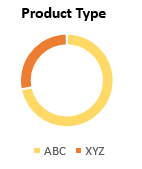
Agreed, this would be a great feature to have. To be able to change colors for any chart customized for each breakdown of the Group By feature.
For example, have a pie chart with 2 different categories and custom pick which colors those categories show up in the pie chart. See below image as an example.
 shinabarger
on 7 Jun 2018
shinabarger
on 7 Jun 2018
There's now a way to do this that should work in most cases:
http://superset.apache.org/faq.html#is-there-a-way-to-force-the-use-specific-colors
mistercrunch
on 7 Jun 2018
There's now a way to do this that should work in most cases:
http://superset.apache.org/faq.html#is-there-a-way-to-force-the-use-specific-colors
mistercrunch
on 7 Jun 2018
@mistercrunch I tried to enforce a colors in the link described way but wasn't really successful. Have you experience in defining colors in superset and maybe a more precise experience?
 frischknechtna
on 22 Jun 2018
frischknechtna
on 22 Jun 2018
@mistercrunch I've also tried that method as SO question without success.
 dominijk
on 31 Jan 2019
dominijk
on 31 Jan 2019
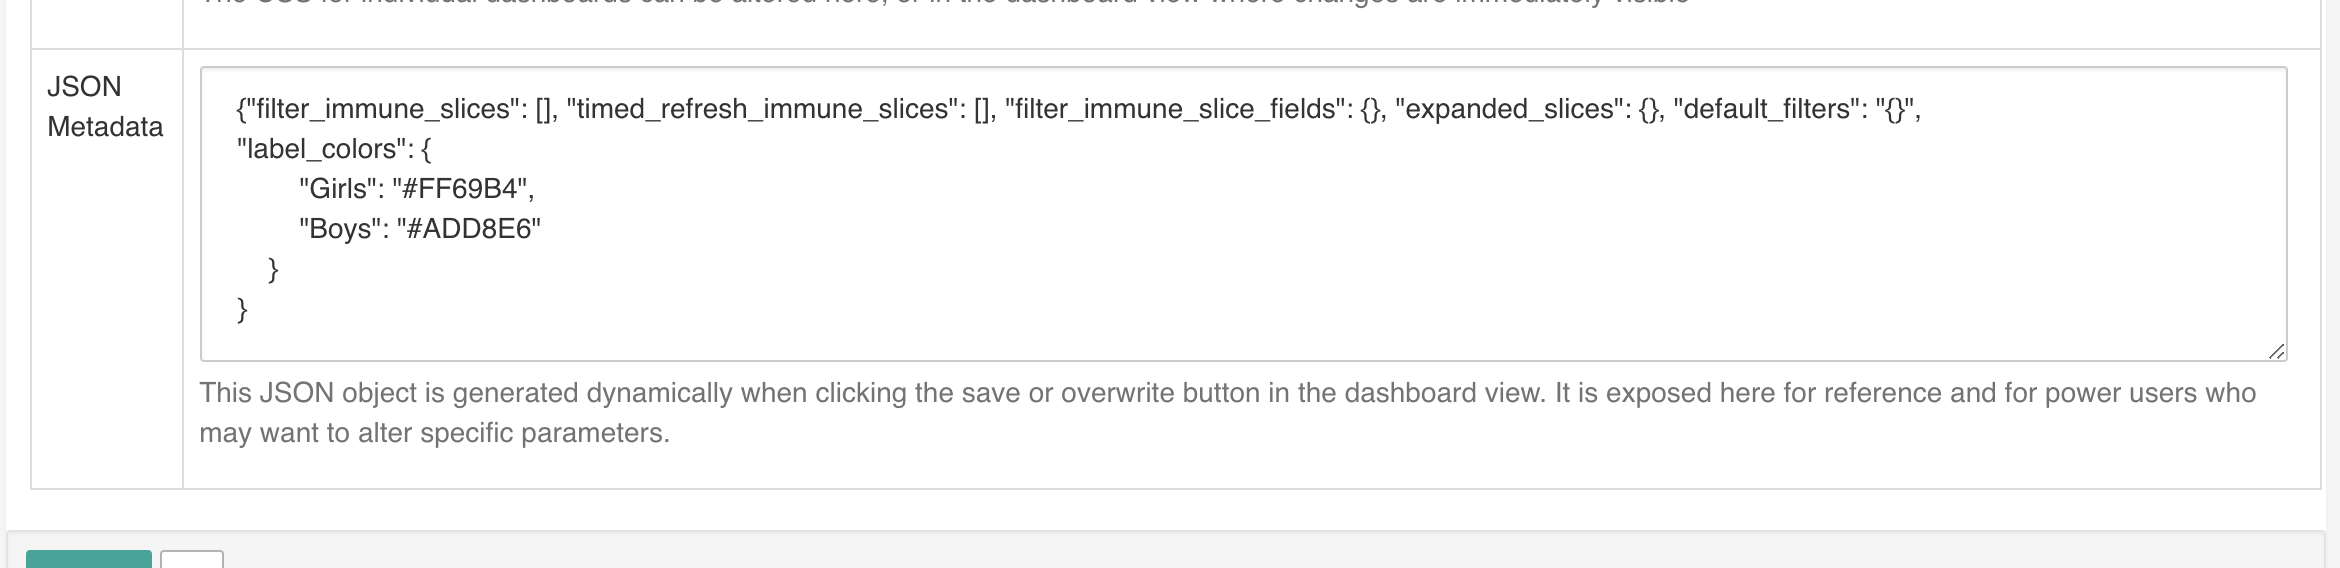

{"filter_immune_slices": [], "timed_refresh_immune_slices": [], "filter_immune_slice_fields": {}, "expanded_slices": {}, "default_filters": "{}",
"label_colors": {
        "Girls": "#FF69B4",
        "Boys": "#ADD8E6"
    }
}
I got that to work but for me the chart must also be set to the default colour scheme
dominijk
on 1 Feb 2019
Wait do you want to set colors a specific way or do you want the default color scheme?
mistercrunch
on 1 Feb 2019
Specific colours for keys but these persist across an entire instance of superset. Per dashboard is fine but I will test as a scheme if that can be key specific?
With the dashboard code it will only alter the chart if the chart is using the default colour scheme (for me) if you select a different colour scheme the override does not work.
dominijk
on 1 Feb 2019
I'd be nice to add a global environment setting for this, I'm not sure why this only applies to the default color scheme, but that's not the intended behavior.
mistercrunch
on 1 Feb 2019
I can confirm you have to have this set to the default color scheme to work.
 mlberg
on 10 Feb 2019
mlberg
on 10 Feb 2019
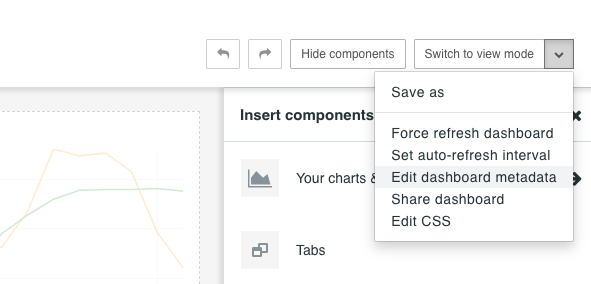
@mistercrunch How do I get to the "JSON Metadata" view from your top screenshot?
 rangerscience
on 12 Mar 2019
rangerscience
on 12 Mar 2019
@rangerscience viewing the dashboard, click "Edit Dashboard", then click the ▼ menu and select "edit dashboard metadata".
 danmdoherty
on 1 Apr 2019
danmdoherty
on 1 Apr 2019
HI @mistercrunch I have tried ur method but it is showing an error has occurred I have given exactly without any error can u give some more info regarding this
 mohan770
on 2 Apr 2020
mohan770
on 2 Apr 2020
Related issues
 fly-high-bj
·
3Comments
fly-high-bj
·
3Comments
 joshuacano
·
3Comments
joshuacano
·
3Comments
 thoralf-gutierrez
·
3Comments
thoralf-gutierrez
·
3Comments
 lenguyenthedat
·
3Comments
lenguyenthedat
·
3Comments
 josephtyler
·
3Comments
josephtyler
·
3Comments