Version
4.4.0
Steps to reproduce
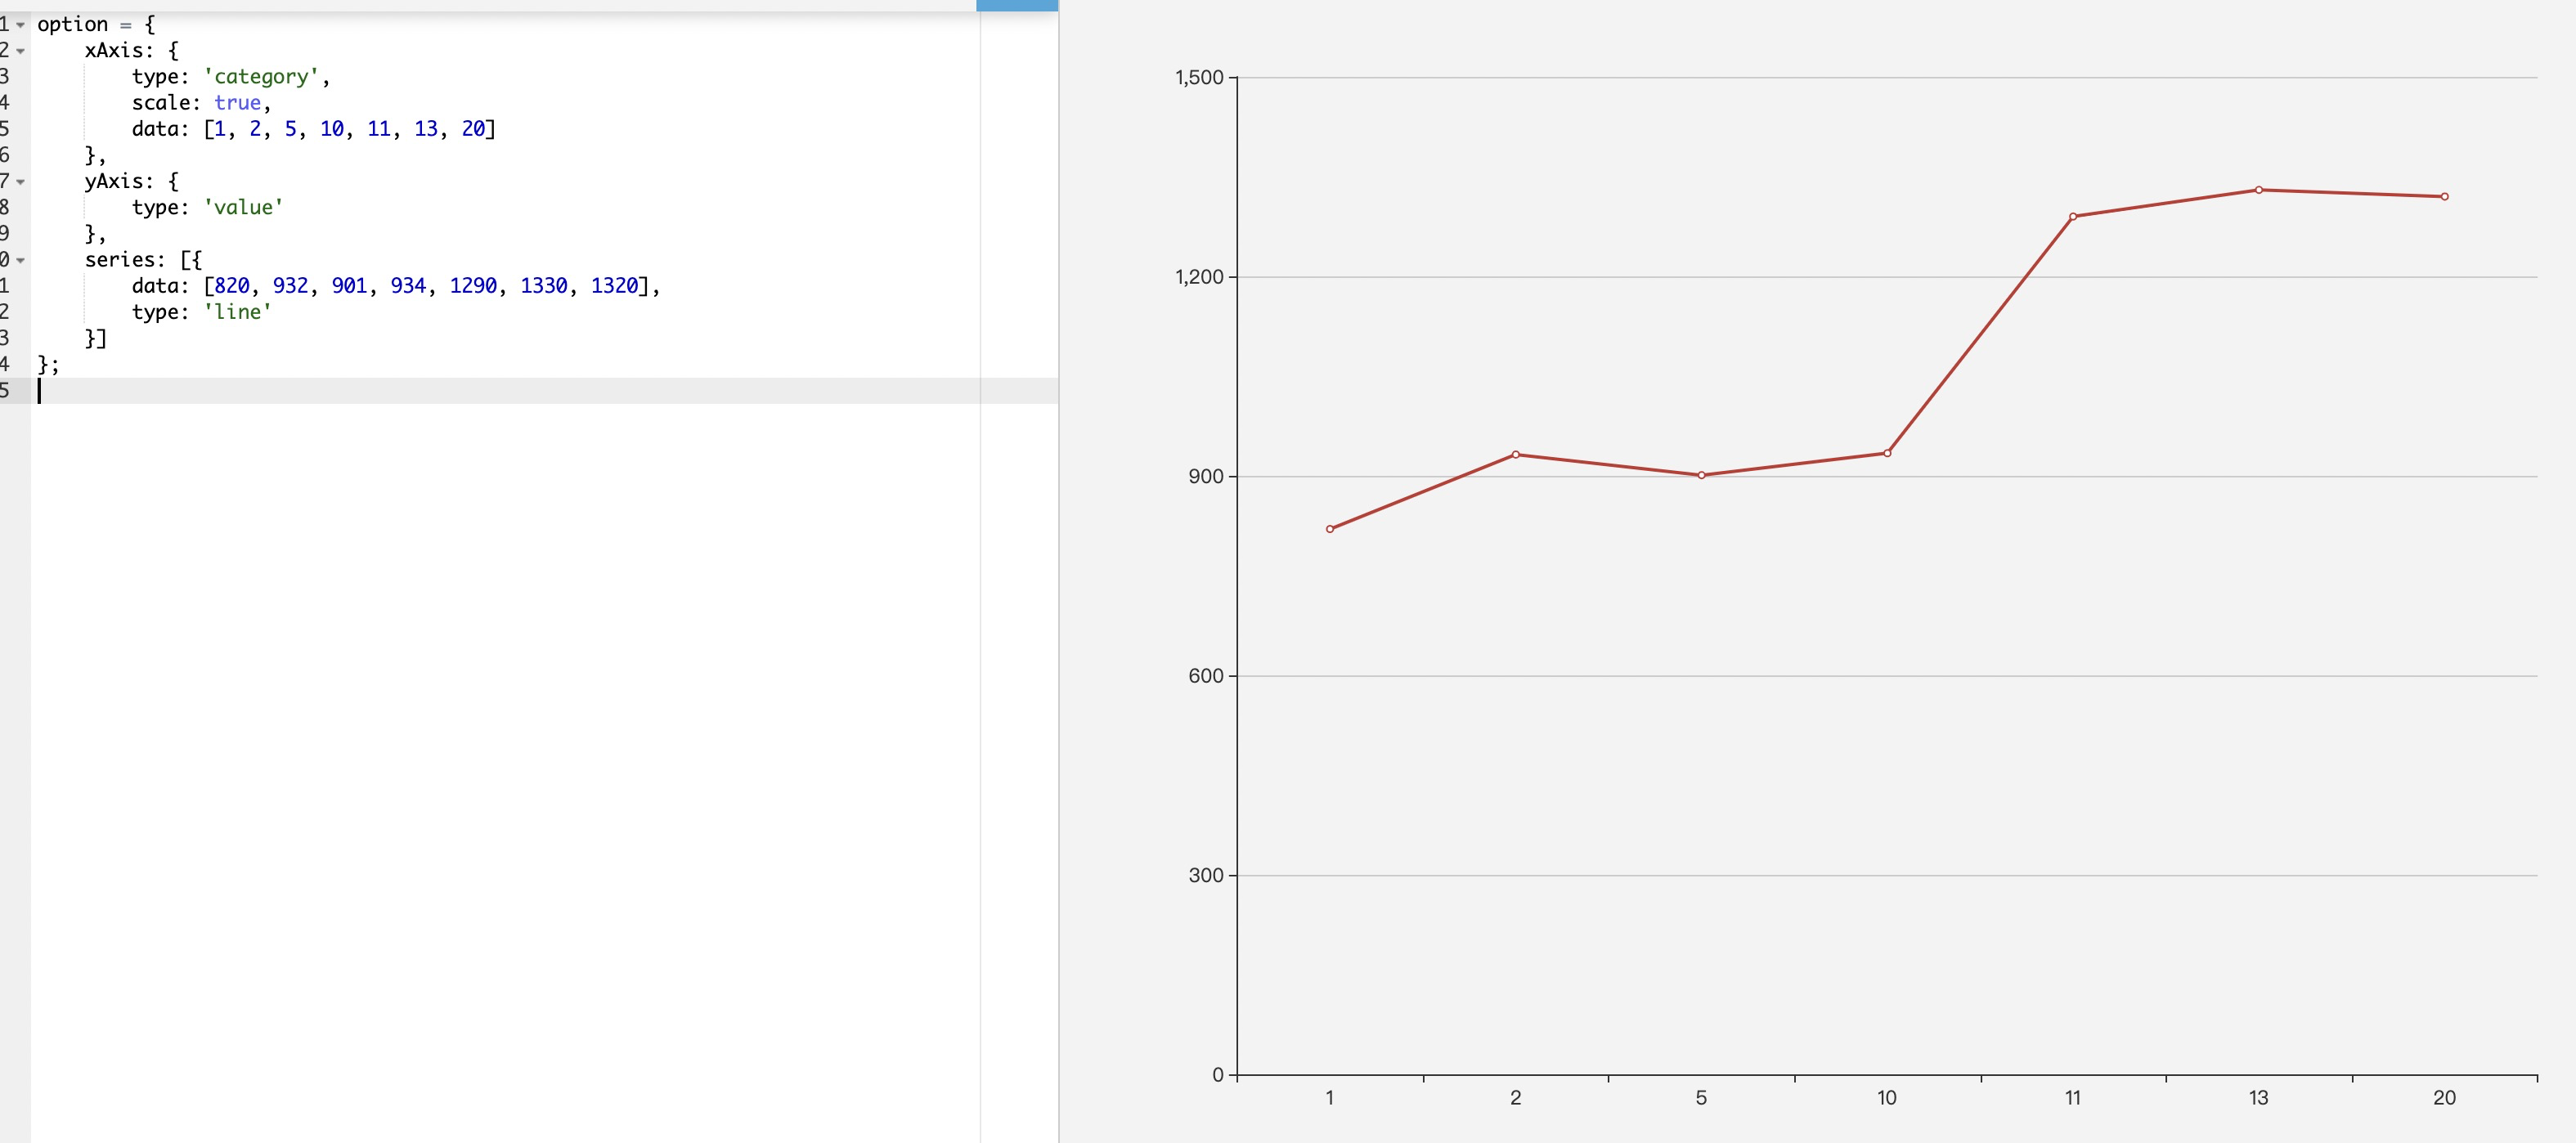
配置项如下:
option = {
xAxis: {
type: 'category',
scale: true,
data: [1, 2, 5, 10, 11, 13, 20]
},
yAxis: {
type: 'value'
},
series: [{
data: [820, 932, 901, 934, 1290, 1330, 1320],
type: 'line'
}]
};
What is expected?
期望X轴能像Y轴一样自动分布
What is actually happening?
实际展示的一个X对应一个点,X轴展示的没达到均匀分布
 gongfuxiaocai
All 5 comments
Hi! We've received your issue and please be patient to get responded. 🎉
The average response time is expected to be within one day for weekdays.
In the meanwhile, please make sure that you have posted enough image to demo your request. You may also check out the API and chart option to get the answer.
If you don't get helped for a long time (over a week) or have an urgent question to ask, you may also send an email to [email protected]. Please attach the issue link if it's a technical questions.
If you are interested in the project, you may also subscribe our mail list.
Have a nice day! 🍵
![echarts-bot[bot] picture](https://avatars1.githubusercontent.com/in/20872?v=4&s=40) echarts-bot[bot]
on 19 Dec 2019
echarts-bot[bot]
on 19 Dec 2019
option = {
xAxis: {
type: 'value',
scale: true,
},
yAxis: {
type: 'value'
},
series: [{
data: [[1, 820], [2, 932], [5, 901], [10, 934], [11, 1290], [13, 1330], [20, 1320]],
type: 'line'
}]
};
这个意思?
 yanheSu
on 19 Dec 2019
yanheSu
on 19 Dec 2019
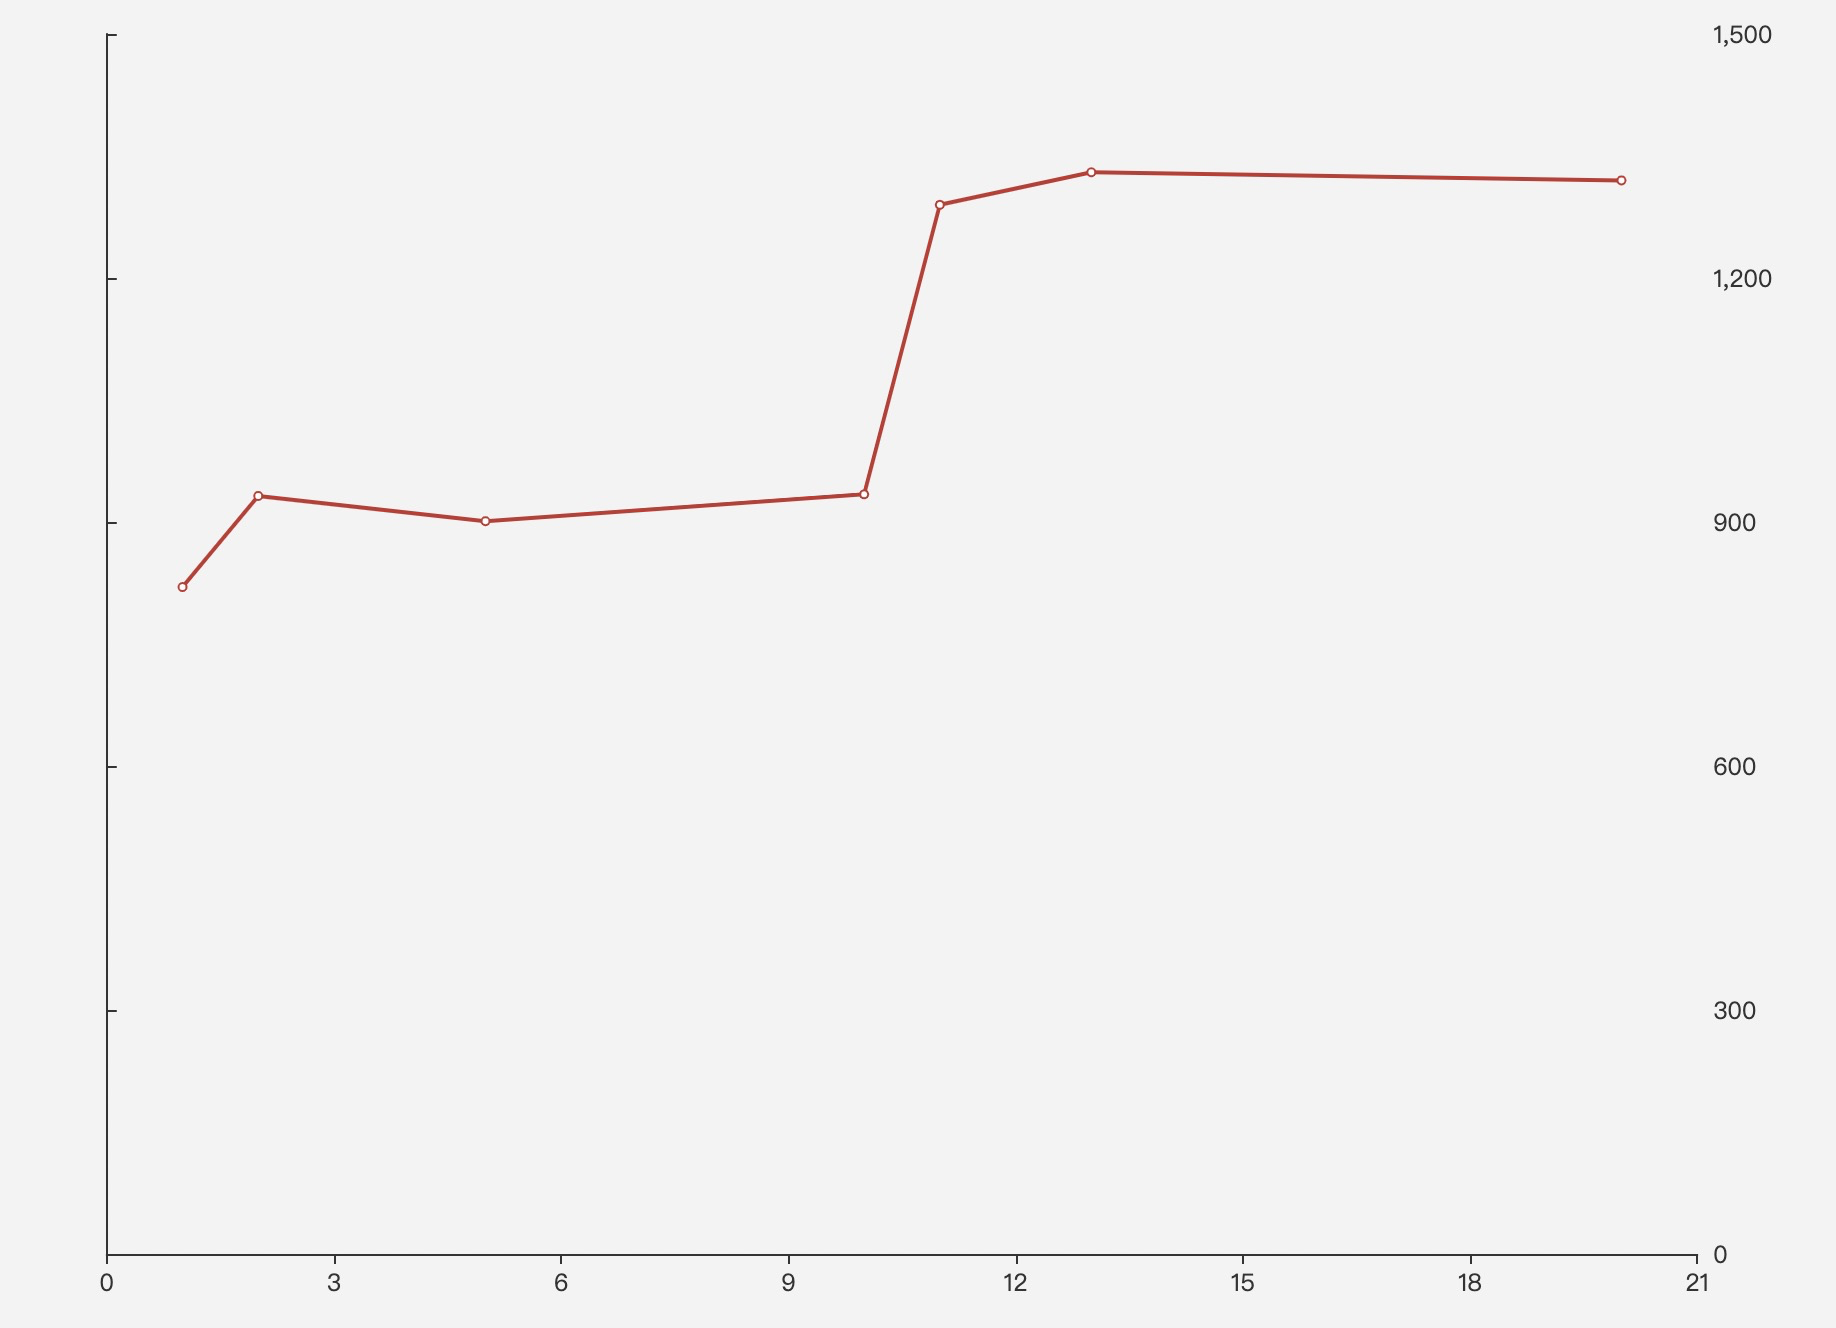
不是的哦,x轴的type是category哦;如果x轴的type是value,y轴的position会把文字定位到右边,但是刻度还在左边;
代码如下`option = {
xAxis: {
type: 'value',
scale: true,
splitLine: {
show: false,
},
},
yAxis: {
type: 'value',
splitLine: {
show: false,
},
position: 'right',
axisTick: {
inside: false,
},
},
series: [{
data: [[1, 820], [2, 932], [5, 901], [10, 934], [11, 1290], [13, 1330], [20, 1320]],
type: 'line'
}]
};`
效果图如下
gongfuxiaocai
on 19 Dec 2019
一定要保持轴类型是category么
由于将x轴类型设置为了数值轴,使y轴的轴线及刻度跟随x轴的零点位置了
如果不希望y轴轴线与刻度跟随零点,可设置yAxis.axisLine.onZero=false。
试一试下面的
var option = {
    xAxis: {
        type: 'value',

        scale: true,

        splitLine: {
        show: false,
        },
        onZero: false
    },
    yAxis: [
        {
            type: 'value',
            position: 'right',
            axisLine: {
                onZero: false
            }
        }],
    series: [{
        data: [[1, 820], [2, 932], [5, 901], [10, 934], [11, 1290], [13, 1330], [20, 1320]],
        type: 'line'
    }]
}
一定要保持轴类型是category么
由于将x轴类型设置为了数值轴,使y轴的轴线及刻度跟随x轴的零点位置了
如果不希望y轴轴线与刻度跟随零点,可设置yAxis.axisLine.onZero=false。
试一试下面的var option = { xAxis: { type: 'value', scale: true, splitLine: { show: false, }, onZero: false }, yAxis: [ { type: 'value', position: 'right', axisLine: { onZero: false } }], series: [{ data: [[1, 820], [2, 932], [5, 901], [10, 934], [11, 1290], [13, 1330], [20, 1320]], type: 'line' }] }
谢谢🙏,可以了
gongfuxiaocai
on 20 Dec 2019
Related issues
 Thinkpad93
·
3Comments
Thinkpad93
·
3Comments
 hanhui
·
3Comments
hanhui
·
3Comments
 arssam
·
3Comments
arssam
·
3Comments
 decadef20
·
3Comments
decadef20
·
3Comments
 jarben
·
3Comments
jarben
·
3Comments
Most helpful comment
一定要保持轴类型是category么
由于将x轴类型设置为了数值轴,使y轴的轴线及刻度跟随x轴的零点位置了
如果不希望y轴轴线与刻度跟随零点,可设置
yAxis.axisLine.onZero=false。试一试下面的