Incubator-echarts: Echarts visualMap categories 维度数量过多显示不全
One-line summary [问题简述]
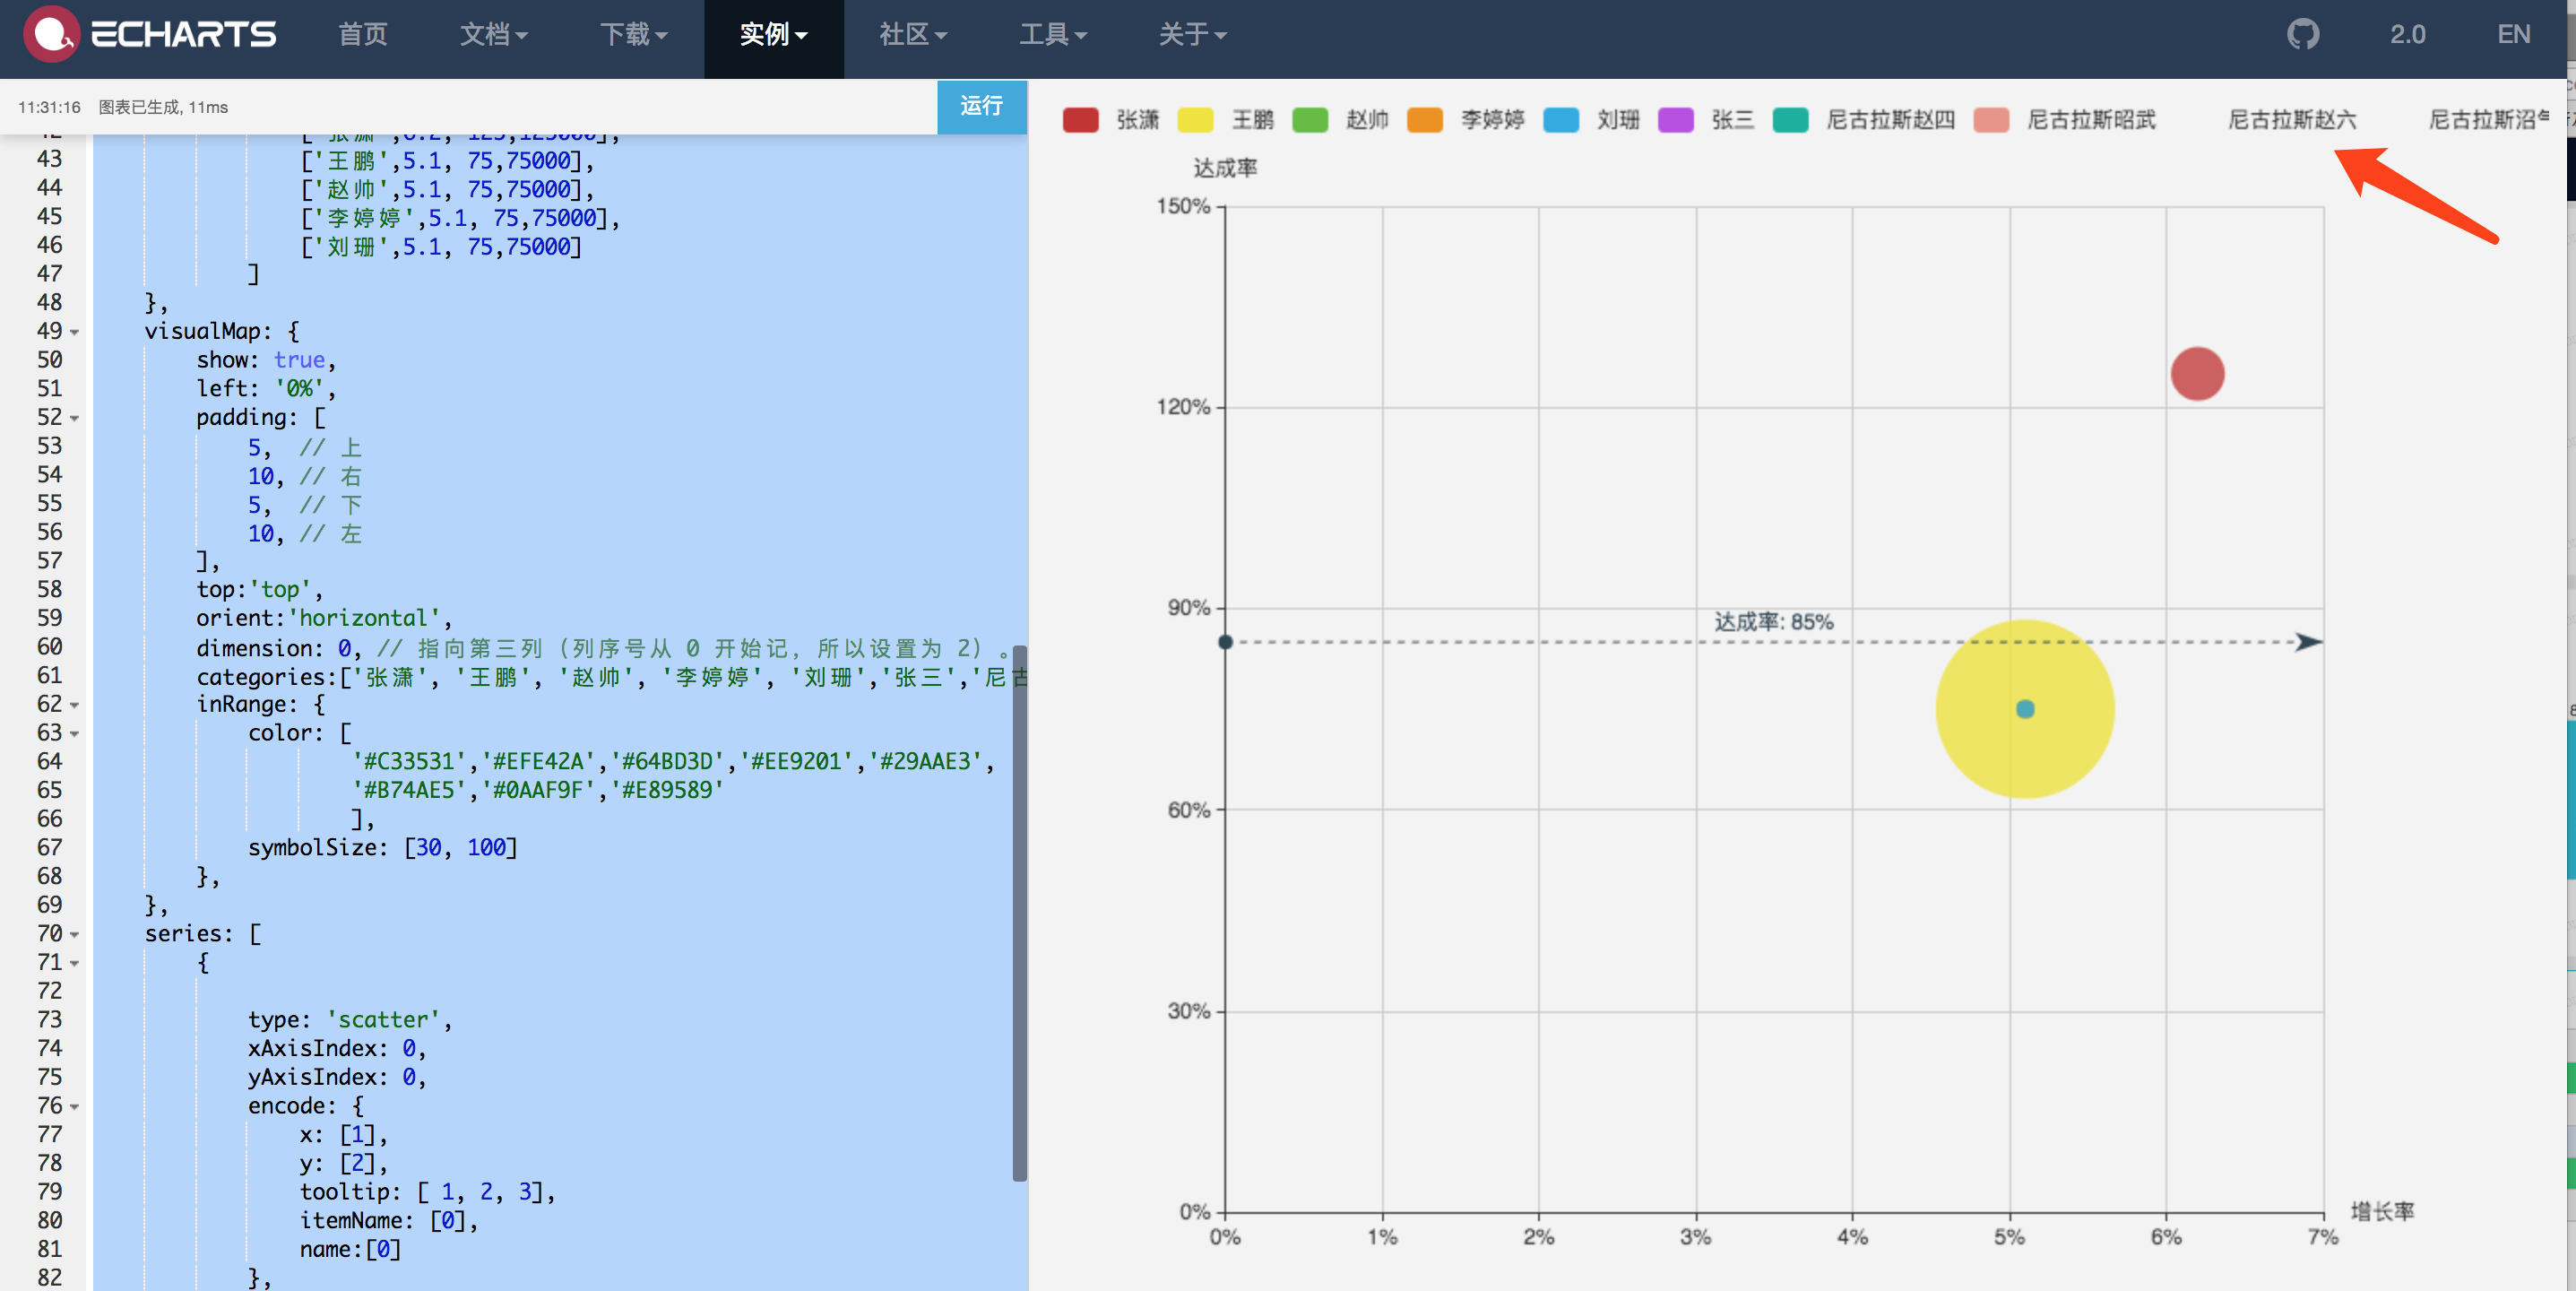
Echarts visualMap categories 数量过多显示不全
Version & Environment [版本及环境]
- ECharts version [ECharts 版本]:4.0.2
- Browser version [浏览器类型和版本]:chrome Version 66.0.3359.181
- OS Version [操作系统类型和版本]:mac 10.13.4
Expected behaviour [期望结果]
能够进行换行显示,或者有类似于legend里面的scroll条属性
ECharts option [ECharts配置项]
option = {
    grid: {
        left: '12%',
        right: '15%',
        bottom: 38
    },
    xAxis: {
        type: 'value',
        name: '增长率',
        axisLabel: {
            formatter: '{value}%'
        }
    },
    yAxis: {
        type: 'value',
        name: '达成率',
        axisLabel: {
            formatter: '{value}%'
        },
    },
    tooltip: {
        show:true,
        padding: 10,
        backgroundColor: '#222',
        borderColor: '#777',
        borderWidth: 1,
         formatter: function(obj) {
            var value = obj.value
            return `
                <div style="border-bottom: 1px solid rgba(255,255,255,.3); font-size: 18px;padding-bottom: 7px;margin-bottom: 7px">
                    ${value[0]}
                </div>
                成员销量: ${value[3]}万 <br>
                达成率: ${value[2]}%<br>
                增长率: ${value[1]}%
            `
        }
    },
    dataset: {
        source: [
                // ['姓名','增长率', '达成率','销售总额'],
                ['张潇',6.2, 125,125000],
                ['王鹏',5.1, 75,75000],
                ['赵帅',5.1, 75,75000],
                ['李婷婷',5.1, 75,75000],
                ['刘珊',5.1, 75,75000]
            ]
    },
    visualMap: {
        show: true,
        left: '0%',
        padding: [
            5,  // 上
            10, // 右
            5,  // 下
            10, // 左
        ],
        top:'top',
        orient:'horizontal',
        dimension: 0, // 指向第三列(列序号从 0 开始记,所以设置为 2)。
        categories:['张潇', '王鹏', '赵帅', '李婷婷', '刘珊','张三','尼古拉斯赵四','尼古拉斯昭武','尼古拉斯赵六','尼古拉斯沼气'],
        inRange: {
            color: [
                    '#C33531','#EFE42A','#64BD3D','#EE9201','#29AAE3',
                    '#B74AE5','#0AAF9F','#E89589'
                    ],
            symbolSize: [30, 100]
        },
    },
    series: [
        {

            type: 'scatter',
            xAxisIndex: 0,
            yAxisIndex: 0,
            encode: {
                x: [1],
                y: [2],
                tooltip: [ 1, 2, 3],
                itemName: [0],
                name:[0]
            },
        },{
            type: 'scatter',
            label: {
                show:false,
            },
            visualMap: false,
            markLine: {
                label: {
                    formatter: "{b}: {c}%",
                    position: 'middle'
                },
                data: [
                    {yAxis: 85, name: '达成率'}
                ]
            }
        }
    ]
}
;
Other comments [其他信息]
 gebilaoman
All 3 comments
请问,有人修复么
gebilaoman
on 17 Sep 2018
👍3
请问楼主 @gebilaoman 最后怎么解决的
 IEfucker
on 17 Jun 2019
IEfucker
on 17 Jun 2019
@pissang @100pah @Ovilia @deqingli
 brendan-lee
on 11 Mar 2020
brendan-lee
on 11 Mar 2020
Was this page helpful?
0 / 5 - 0 ratings
Related issues
 Thinkpad93
·
3Comments
Thinkpad93
·
3Comments
 771752687
·
3Comments
771752687
·
3Comments
 decadef20
·
3Comments
decadef20
·
3Comments
 kirazxyun
·
3Comments
kirazxyun
·
3Comments
 RoxetteI
·
3Comments
RoxetteI
·
3Comments
Most helpful comment
请问,有人修复么