Imagesharp: Performance overhead in Image<> constructor's Clear()
Prerequisites
- [x] I have written a descriptive issue title
- [x] I have verified that I am running the latest version of ImageSharp
- [x] I have verified if the problem exist in both
DEBUGandRELEASEmode - [x] I have searched open and closed issues to ensure it has not already been reported
Description
In use cases where many Image<>s are being constructed and expected to be produced at low latency, an overhead can currently be experienced due to the presence of Parallel.For in the pixel clearing code.
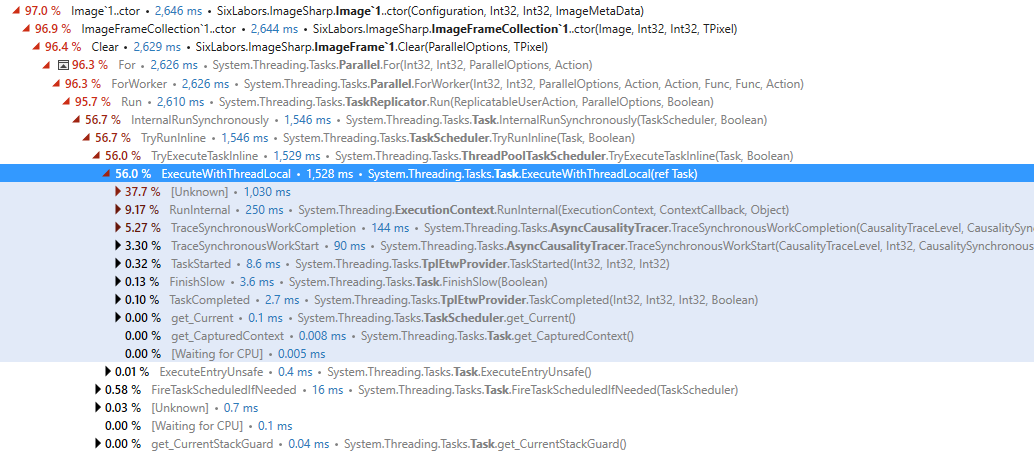
Even in the case where task inlining occurs, an overhead of around 65% can be observed. The case in this profiling involves 1x100 image created and populated each game frame.
Two points here:
Parallel.Forshould probably not be used under a certain threshold of image pixels as the overhead is larger than any benefit.- In the example cited, as we are manually populating the image, the clear is completely redundant. It may be nice to have the ability to skip the
Clearin such cases (although I could understand if this is not accepted, as it could potentially be a security concern in a multi-tenant environment).
On advice, I did try converting my image to 100x1 to reduce parallelism (since the Parallel.For is done per row) but this has no effect. The overhead was already occurred from the Parallel.For's task paradigm.
This is a low priority proposal as I can restore my local pooling of Image<>s rather than constructing a new one each time (probably necessary anyway to avoid object alloc overheads anyway).
Steps to Reproduce
Profile CPU usage for a loop like:
for (int i = 0; i < 10000; i++)
    using (var test = new Image<Rgba32>(100,1);
System Configuration
.net core 2.1, latest ImageSharp 1.0.0-beta0005
 peppy
peppy
>All comments
Did a quick benchmark. If we replace the parallel code in this scenario with a simple fill, it's 10x faster.
Need to check other dimensions but since Fill is SIMD optimized, it might well be best to simply use that in all circumstances.
c#
        internal void Clear(TPixel value)
        {
            Span<TPixel> pixels = this.GetPixelSpan();
            pixels.Fill(value);
        }
 JimBobSquarePants
on 9 Sep 2018
JimBobSquarePants
on 9 Sep 2018
Related issues
 QuantumToasted
·
3Comments
QuantumToasted
·
3Comments
 nullpainter
·
3Comments
nullpainter
·
3Comments
 vad3x
·
4Comments
vad3x
·
4Comments
 jarroda
·
3Comments
jarroda
·
3Comments
 olivif
·
3Comments
olivif
·
3Comments
Most helpful comment
Did a quick benchmark. If we replace the parallel code in this scenario with a simple fill, it's 10x faster.
Need to check other dimensions but since
Fillis SIMD optimized, it might well be best to simply use that in all circumstances.c# internal void Clear(TPixel value) { Span<TPixel> pixels = this.GetPixelSpan(); pixels.Fill(value); }