Hydrogen: how to plot with d3.js + atom + hydrogen
Hi there! First of all, your project is awesome.
Only thing is that I'm trying to plot within atom (hydrogen) using JS (d3) as I do with Python (altair).
I can't understand from docs how to use $$ tags notation with d3 library (on browser works perfectly).
Any links to examples?
You find below the code and a pic.
Thanks for your help
var d3 = require("d3");
$$.svg("");
$$.svg("");
$$.html("
$$.html("
")var w = 600;
var h = 250;
var dataset = [ 5, 10, 13, 19, 21, 25, 22, 18, 15, 13, 11, 12, 15, 20, 18, 17, 16, 18, 23, 25 ];
dataset
var xScale = d3.scaleBand()
.domain(d3.range(dataset.length))
.rangeRound([0, w])
.paddingInner(0.05);
var yScale = d3.scaleLinear()
.domain([0, d3.max(dataset)])
.range([0, h]);
//Create SVG element
var svg = d3.select("body") // change body with $$.html("
.append("svg")
.attr("width", w)
.attr("height", h);
//Create bars
svg.selectAll("rect")
.data(dataset)
.enter()
.append("rect")
.attr("x", function(d, i) {
return xScale(i);
})
.attr("y", function(d) {
return h - yScale(d);
})
.attr("width", xScale.bandwidth())
.attr("height", function(d) {
return yScale(d);
})
.attr("fill", function(d) {
return "rgb(0, 0, " + Math.round(d * 10) + ")";
});
//Create labels
svg.selectAll("text")
.data(dataset)
.enter()
.append("text")
.text(function(d) {
return d;
})
.attr("text-anchor", "middle")
.attr("x", function(d, i) {
return xScale(i) + xScale.bandwidth() / 2;
})
.attr("y", function(d) {
return h - yScale(d) + 14;
})
.attr("font-family", "sans-serif")
.attr("font-size", "11px")
.attr("fill", "white");

 rpalloni
All 4 comments
Hi @rpalloni, I've transferred this issue to the Hydrogen repo so more folks will see it.
 willingc
on 11 Dec 2018
willingc
on 11 Dec 2018
@rpalloni Please, have a look at the response I provided at stackoverflow.
Let me know if anything needs further explanation.
 n-riesco
on 11 Dec 2018
n-riesco
on 11 Dec 2018
You are stars! Thanks for your help! I only changed a bit the initial setting up according to https://github.com/jsdom/jsdom/blob/master/README.md
Here follows an example and pic maybe useful for other folks!
Grazie!
Code:
`var jsdom = require("jsdom");
const { JSDOM } = jsdom;
var d3 = require("d3");
var dom = new JSDOM();
var doc = dom.window.document;
// simple example
var svg = d3.select(doc.body)
.append("svg");
svg.append("rect")
.attr("width", 80)
.attr("height", 80)
.style("fill", "orange");
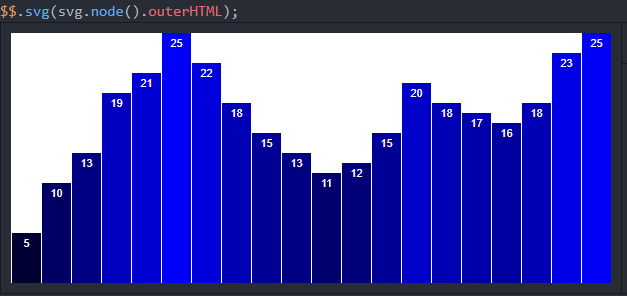
$$.svg(svg.node().outerHTML);
// complex example
var w = 600;
var h = 250;
var dataset = [ 5, 10, 13, 19, 21, 25, 22, 18, 15, 13, 11, 12, 15, 20, 18, 17, 16, 18, 23, 25 ];
dataset
var xScale = d3.scaleBand()
.domain(d3.range(dataset.length))
.rangeRound([0, w])
.paddingInner(0.05);
var yScale = d3.scaleLinear()
.domain([0, d3.max(dataset)])
.range([0, h]);
//Create SVG element
var svg = d3.select(doc.body)
.append("svg")
.attr("width", w)
.attr("height", h);
//Create bars
svg.selectAll("rect")
.data(dataset)
.enter()
.append("rect")
.attr("x", function(d, i) {
return xScale(i);
})
.attr("y", function(d) {
return h - yScale(d);
})
.attr("width", xScale.bandwidth())
.attr("height", function(d) {
return yScale(d);
})
.attr("fill", function(d) {
return "rgb(0, 0, " + Math.round(d * 10) + ")";
});
//Create labels
svg.selectAll("text")
.data(dataset)
.enter()
.append("text")
.text(function(d) {
return d;
})
.attr("text-anchor", "middle")
.attr("x", function(d, i) {
return xScale(i) + xScale.bandwidth() / 2;
})
.attr("y", function(d) {
return h - yScale(d) + 14;
})
.attr("font-family", "sans-serif")
.attr("font-size", "11px")
.attr("fill", "white");
$$.svg(svg.node().outerHTML);`
rpalloni
on 12 Dec 2018
Thanks @n-riesco for the help. I'm glad you got it working @rpalloni.
willingc
on 12 Dec 2018
Related issues
 lgeiger
·
3Comments
lgeiger
·
3Comments
 vader333
·
3Comments
vader333
·
3Comments
 HaoranXue
·
4Comments
HaoranXue
·
4Comments
 ekoepplin
·
4Comments
ekoepplin
·
4Comments
 olegantonyan
·
3Comments
olegantonyan
·
3Comments
Most helpful comment
You are stars! Thanks for your help! I only changed a bit the initial setting up according to https://github.com/jsdom/jsdom/blob/master/README.md
Here follows an example and pic maybe useful for other folks!
Grazie!

Code:
`var jsdom = require("jsdom");
const { JSDOM } = jsdom;
var d3 = require("d3");
var dom = new JSDOM();
var doc = dom.window.document;
// simple example
var svg = d3.select(doc.body)
.append("svg");
svg.append("rect")
.attr("width", 80)
.attr("height", 80)
.style("fill", "orange");
$$.svg(svg.node().outerHTML);
// complex example
var w = 600;
var h = 250;
var dataset = [ 5, 10, 13, 19, 21, 25, 22, 18, 15, 13, 11, 12, 15, 20, 18, 17, 16, 18, 23, 25 ];
dataset
var xScale = d3.scaleBand()
.domain(d3.range(dataset.length))
.rangeRound([0, w])
.paddingInner(0.05);
var yScale = d3.scaleLinear()
.domain([0, d3.max(dataset)])
.range([0, h]);
//Create SVG element
var svg = d3.select(doc.body)
.append("svg")
.attr("width", w)
.attr("height", h);
//Create bars
svg.selectAll("rect")
.data(dataset)
.enter()
.append("rect")
.attr("x", function(d, i) {
return xScale(i);
})
.attr("y", function(d) {
return h - yScale(d);
})
.attr("width", xScale.bandwidth())
.attr("height", function(d) {
return yScale(d);
})
.attr("fill", function(d) {
return "rgb(0, 0, " + Math.round(d * 10) + ")";
});
//Create labels
svg.selectAll("text")
.data(dataset)
.enter()
.append("text")
.text(function(d) {
return d;
})
.attr("text-anchor", "middle")
.attr("x", function(d, i) {
return xScale(i) + xScale.bandwidth() / 2;
})
.attr("y", function(d) {
return h - yScale(d) + 14;
})
.attr("font-family", "sans-serif")
.attr("font-size", "11px")
.attr("fill", "white");
$$.svg(svg.node().outerHTML);`