Holoviews: NdOverlay legends: Style by dim transform association with each of NdOverlay's kdim
When doing e.g. an NdOverlay, the legend has an entry for each Element (see below). For 2 or more key dimensions, this quickly becomes a lot. It would be really nice if instead of listing every single Element, we could style the NdOverlay by setting different Cycle options along the different key dimensions, e.g. along kdim1 we vary line width, along kdim2 the color, along kdim3 the opacity, ... As far as styling the Element goes, this would mostly be a convenience, but it could make the associated legends much clearer.
E.g. this is what it currently looks like:

What the legend could instead look like is that there's a thick line (no colour) for "measured", a thin one for "representative", a blue patch for "overturning", an orange one for "perennial" (no variation in thickness), and so on.
Or is this too complicated to generalize?
Also, unsure if this is related: #1161
 poplarShift
All 6 comments
It would be great if we could have a simple way to construct arbitrary legends as needed. E.g. for datashader, we constructed this legend by adding fake invisible points, just to be able to show the color code:
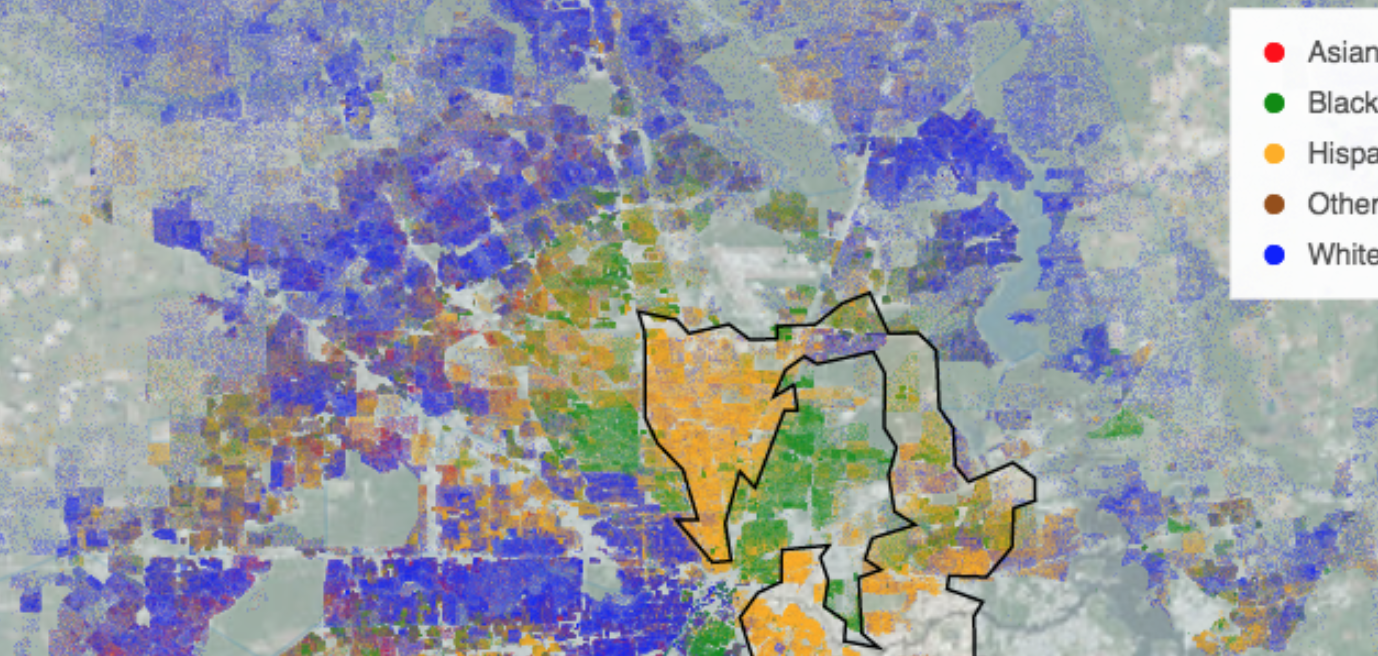
Being able to do that more explicitly but conveniently would be a great help. I don't have any immediate API suggestions other than that it would take some ordered dictionary of some visible item and a text description.
 jbednar
on 28 Feb 2019
jbednar
on 28 Feb 2019
The code snippet shared in #3026 for adding a legend manually to a GridMatrix may also be useful here.
Come to think of it, styling along kdims can probably be achieved pretty easily by just wrapping it into a cartesian product. Should put that into a cookbook somewhere...
Remains adding a custom legend cycling through each of the lists separately, choosing a a fixed entry from all the others.
styles = itertools.product(['blue', 'orange'], ['<', 'o', 's'])
a, b = zip(*styles)
opts.Scatter(color=hv.Cycle(list(a)), marker=hv.Cycle(list(b)))
This is now possible by using style mappers, e.g.:
df = pd.DataFrame({
    'Time': np.tile(np.arange(100), 9),
    'y': np.random.randn(900).cumsum(axis=0),
    'gridsize': np.repeat([0, 1, 2, 0, 1, 2, 0, 1, 2], 100),
    'turbulence': np.repeat([0, 0, 0, 1, 1, 1, 2, 2, 2], 100)})

df['label'] = ['Gridsize: %s, Turbulence: %s' % (r.gridsize, r.turbulence) for i, r in df.iterrows()]

curves = hv.Dataset(df, ['Time']).to(hv.Curve, 'Time', ['y', 'gridsize','turbulence'], 'label')
curves.overlay('label').opts(
    opts.Curve(color=dim('gridsize').categorize({0: 'red', 1: 'blue', 2: 'green'}),
               line_dash=dim('turbulence').categorize({0: 'solid', 1: 'dashed', 2: 'dotdash'})),
    opts.NdOverlay(width=900, legend_position='right'))

I'd like to add a cycle method on dim though so you don't have to provide an explicit mapping.
 philippjfr
on 29 Mar 2019
philippjfr
on 29 Mar 2019
I'd like to add a cycle method on dim though so you don't have to provide an explicit mapping.
Sounds like a great idea.
jbednar
on 29 Mar 2019
Thanks @philippjfr, I learned about dim().categorize a bit later (and .cycle would be even better!). The problem of mapping this into a less bloated legend would remain though.
poplarShift
on 11 Apr 2019
Just to clarify Philipp's code snippet, it may look like you have to pass extra vdims to do the dim transform, but you can even use dim transforms on kdims of NdOverlays! https://nbviewer.jupyter.org/github/poplarShift/pyviz-recipes/blob/master/notebooks/styling_by_attribute.ipynb
Changing title to reflect that.
poplarShift
on 11 Jun 2019
Related issues
 jlstevens
·
6Comments
jlstevens
·
6Comments
 ceh-creare
·
5Comments
ceh-creare
·
5Comments
 mansenfranzen
·
5Comments
mansenfranzen
·
5Comments
 asmith26
·
4Comments
asmith26
·
4Comments
 claresloggett
·
5Comments
claresloggett
·
5Comments
Most helpful comment
This is now possible by using style mappers, e.g.:
I'd like to add a cycle method on
dimthough so you don't have to provide an explicit mapping.