Holoviews: Using bokeh's Arrow to draw VectorField?
So I found the drawing of the vectorfield arrows in the bokeh backend to be a bit awkward (mostly in looks and lack of styling options) and tried to replace it by bokeh's Arrow through a CompositeElementPlot. Problem is (which is maybe why you didn't do that in the first place...) that bokeh's Figure does not expose Arrow, which is an annotation, not a marker or glyph (if I understand correctly), and hence drawing arrows in holoviews has to pass by style options, not data (again, if my understanding is correct).
Question is, do you think that could be addressed on the Holoviews side, or would one have to make a PR on the bokeh side? I briefly skimmed some related discussions on here from when you were implementing VectorField, but that's a while ago and I couldn't find any information on this in particular.
 poplarShift
All 16 comments
The main problem I think is that Arrow is not vectorized in any way. That means each individual arrow would have to be added as a separate annotation, which is not very scalable. After a few hundred arrows the plot would likely slow to a crawl. That's the main reason it was implemented the way it was, if we are aiming to improve on that it will likely take a PR in bokeh to either extend the Arrow annotation or write a new glyph entirely.
 philippjfr
on 11 Feb 2019
philippjfr
on 11 Feb 2019
Actually I think I'm wrong on this and Arrow is actually vectorized, which means we could try this approach.
philippjfr
on 11 Feb 2019
I am not sure I understand, how would that be implemented? Specifying _plot_methods = dict(single='arrow') in the VectorFieldPlot class just runs into the fact that Arrow isn't exposed in Figure. On the other hand, modifying bokeh's Arrow example passing lists for x_start etc. (p.add_layout(Arrow(end=OpenHead(line_color="firebrick", line_width=4),
x_start=[0,1], y_start=[0,1], x_end=[1,3], y_end=[0,5]))) doesn't work either for me.
poplarShift
on 12 Feb 2019
Here's how to use a vectorized Arrow:
p = figure(x_range=(0, 10), y_range=(0, 10))

cds = ColumnDataSource(data=dict(x_start=[0,1, 2], y_start=[0,1, 2], x_end=[1,3, 5], y_end=[0,5, 8]))
p.add_layout(Arrow(end=OpenHead(), source=cds, x_start='x_start', y_start='y_start', x_end='x_end', y_end='y_end'))

pn.Column(p)
Ah, thanks! And you'd put that call into the _init_glyph method, just by passing the data through the mapping argument instead of data like in ArrowPlot?
poplarShift
on 12 Feb 2019
_init_glyph should already be being given a data source as part of the properties. The get_data method needs to be updated to return the x_start/x_end and y_start/y_end values and the correct mapping and then _init_glyph needs to be updated to construct the Arrow annotation manually and add it to the plot.
philippjfr
on 12 Feb 2019
I've taken a stab at it here: https://github.com/pyviz/holoviews/compare/master...poplarShift:arrow_vectors
though I'm struggling a bit with the style opts (currently setting the color, e.g., makes the line of the arrow disappear, but only because I was tinkering with the options to avoid some other error...)
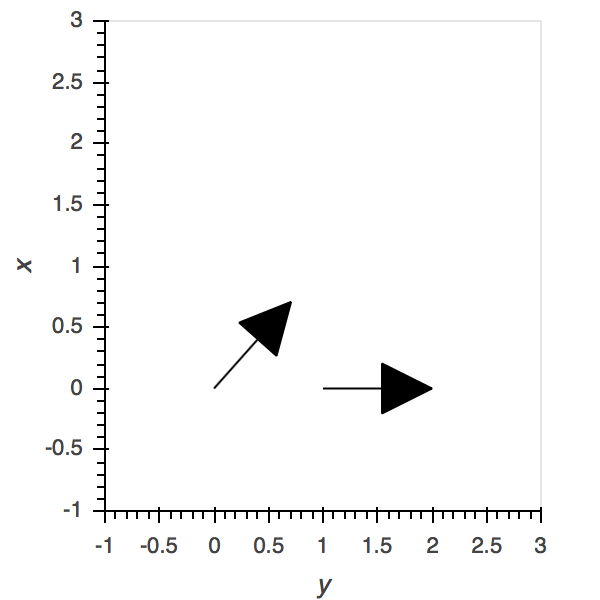
import numpy as np
import holoviews as hv
hv.extension('bokeh')
v = hv.VectorField(([0, 0], [0, 1], [np.pi/4, np.pi/2], [1, 1.5])).redim.range(x=(-1,3), y=(-1,3))

v.opts(invert_axes=True, arrow_head='-|>')
poplarShift
on 12 Feb 2019
@poplarShift Would you like to be added as a collaborator to holoviews so we can collaborate on the PR more easily?
philippjfr
on 12 Feb 2019
If that makes it easier, it would be an honour!
poplarShift
on 13 Feb 2019
Great, you should have received an invite, once you're set up could you push your arrow vectorfield branch straight to the pyviz/holoviews repo?
philippjfr
on 13 Feb 2019
Neat! Branch arrow_vectors is now in the main repo.
poplarShift
on 14 Feb 2019
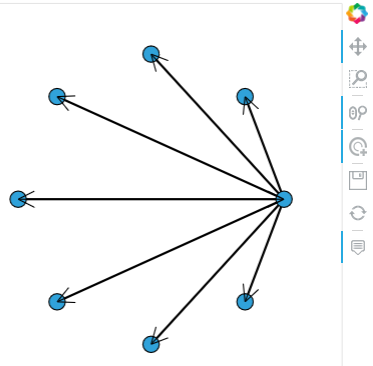
this arrow can be added to network Graph?
 badiku
on 25 Apr 2019
badiku
on 25 Apr 2019
tried to use this vectorized Arrow in network Graph:
# Declare abstract edges
N = 8
node_indices = np.arange(N, dtype=np.int32)
source = np.zeros(N, dtype=np.int32)
target = node_indices


simple_graph = hv.Graph(((source, target),))
#simple_graph

from bokeh.plotting import figure, output_notebook,reset_output, show
from bokeh.models import ColumnDataSource, Arrow, OpenHead, NormalHead, VeeHead

r = hv.render(simple_graph)
pos = simple_graph.nodes.dframe()
xy = simple_graph.data
df = xy.merge(pos,left_on='start',right_index=True).merge(pos,left_on='end',right_index=True,suffixes=['_start','_end'])
cds = ColumnDataSource( df)
r.add_layout(Arrow(end=OpenHead(size=15), source=cds, x_start='x_start', y_start='y_start', x_end='x_end', y_end='y_end'))
show(r)
badiku
on 28 Apr 2019
I think the main issue we had with vectorized arrow in the past is that it doesn't support vectorized style properties like color, line_width etc. I'm not sure whether that is still the case.
philippjfr
on 28 Apr 2019
like this? seems no problem:
p = figure(x_range=(0, 10), y_range=(0, 10))
cds = ColumnDataSource(data=dict(x_start=[0,1, 2], y_start=[0,1, 2], x_end=[1,3, 5], y_end=[0,5, 8], line_width=[16,5, 8], color=['red','blue','yellow']))
p.add_layout(Arrow(end=OpenHead(), source=cds, line_color='color', line_width='line_width', x_start='x_start', y_start='y_start', x_end='x_end', y_end='y_end'))
show(p)

badiku
on 29 Apr 2019
like this? seems no problem:
Neat, we should definitely do it then.
philippjfr
on 29 Apr 2019
Related issues
 ahuang11
·
3Comments
ahuang11
·
3Comments
 claresloggett
·
5Comments
claresloggett
·
5Comments
 michaelaye
·
3Comments
michaelaye
·
3Comments
 CurtLH
·
3Comments
CurtLH
·
3Comments
 mansenfranzen
·
5Comments
mansenfranzen
·
5Comments