Helm-charts: https://localhost:5601/app/kibana: status: Error
@Crazybus
I installed the helm chart o elasticsearch an kibana using alright_keep_your_secrets branch.
it seems that everything worked just fine until I wanted to get into the UI of kibana it doesn't load :
the make goss seems to be working without issue :
GOSS_CONTAINER=$(kubectl get --no-headers=true pods -l release=helm-kibana-security -o custom-columns=:metadata.name | sed -n 1p ) && \
echo Testing with pod: $GOSS_CONTAINER && \
kubectl cp test/goss.yaml $GOSS_CONTAINER:/tmp/goss.yaml && \
kubectl exec $GOSS_CONTAINER -- sh -c "cd /tmp/ && curl -s -L https://github.com/aelsabbahy/goss/releases/download/v0.3.6/goss-linux-amd64 -o goss && chmod +rx ./goss && ./goss --gossfile goss.ya
ml validate --retry-timeout 300s --sleep 5s --color --format documentation"
Testing with pod: helm-kibana-security-kibana-778dfcf8f9-p29zh
File: /usr/share/kibana/config/kibana.yml: exists: matches expectation: [true]
File: /usr/share/kibana/config/kibana.yml: contains: matches expectation: [server.ssl:   enabled: true   key: /usr/share/kibana/config/certs/elastic-certificate.pem   certificate: /usr/share/kiba
na/config/certs/elastic-certificate.pem xpack.security.encryptionKey: elasticsearch.ssl:   certificateAuthorities: /usr/share/kibana/config/certs/elastic-certificate.pem   verificationMode: certi
ficate]
HTTP: https://localhost:5601/app/kibana: status: matches expectation: [200]
HTTP: https://helm-kibana-security-kibana:5601/app/kibana: status: matches expectation: [200]
Total Duration: 0.963s
Count: 4, Failed: 0, Skipped: 0
this is my pods :
NAME                                            READY   STATUS    RESTARTS   AGE
helm-kibana-security-kibana-778dfcf8f9-p29zh    1/1     Running   0          14h
security-master-0                               1/1     Running   0          14h
security-master-1                               1/1     Running   0          6h40m
security-master-2                               1/1     Running   0          12m
in the events log I am seing this warning :
**Failed to update endpoint default/security-master: Operation cannot be fulfilled on endpoints "security-master": the object has been modified; please apply your changes to the latest version and try again | FailedToUpdateEndpoint**
but then my security-master pods are working :
security-master-0 | running
security-master-1 | running
security-master-2 | running
 mounaBoo
All 17 comments
I think there something wrong with the security-master-2 :
network is not ready: [runtime network not ready: NetworkReady=false reason:NetworkPluginNotReady message:docker: network plugin is not ready: Kubenet does not have netConfig. This is most likely due to lack of PodCIDR]
0/2 nodes are available: 2 node(s) didn't match pod affinity/anti-affinity, 2 node(s) didn't satisfy existing pods anti-affinity rules.
it's given me this events even if it's marked as runing
mounaBoo
on 10 Jul 2019
Considering all of the pods are running and healthy it sounds like everything is in good shape.
0/2 nodes are available: 2 node(s) didn't match pod affinity/anti-affinity, 2 node(s) didn't satisfy existing pods anti-affinity rules.
This error makes it sound like the cluster only had 2 nodes originally, but you maybe auto-scaled to add in a third one to satisfy the anti affinity rules.
it seems that everything worked just fine until I wanted to get into the UI of kibana it doesn't load :
I just ran through the instructions again and saw that the port forward is referring to the default example and not the security example. I just pushed a new commit. Can you try with the updated instructions? There is no need to redeploy, just follow the new instructions.
 Crazybus
on 11 Jul 2019
Crazybus
on 11 Jul 2019
O I will try that and then report to you thank you.
mounaBoo
on 11 Jul 2019
so the command to interact with the cluster :
{
  "cluster_name" : "security",
  "status" : "green",
  "timed_out" : false,
  "number_of_nodes" : 3,
  "number_of_data_nodes" : 3,
  "active_primary_shards" : 3,
  "active_shards" : 6,
  "relocating_shards" : 0,
  "initializing_shards" : 0,
  "unassigned_shards" : 0,
  "delayed_unassigned_shards" : 0,
  "number_of_pending_tasks" : 0,
  "number_of_in_flight_fetch" : 0,
  "task_max_waiting_in_queue_millis" : 0,
  "active_shards_percent_as_number" : 100.0
}
and the curl -I -k -u elastic:$Password https://localhost:5601/app/kibana
 HTTP/1.1 200 OK
content-security-policy: script-src 'unsafe-eval' 'nonce-hVJdRFhEJHdFV5kW'; worker-src blob:; child-src blob:
kbn-name: kibana
kbn-xpack-sig: 0ebe654e32c040bd4b2aff05c3931890
cache-control: no-cache
content-type: text/html; charset=utf-8
content-length: 81348
vary: accept-encoding
connection: close
Date: Thu, 11 Jul 2019 11:23:38 GMT
but in the other command shell in which I forwarded I am getting that :
Forwarding from 127.0.0.1:5601 -> 5601
Handling connection for 5601
E0711 12:23:38.398706     441 portforward.go:316] error copying from local connection to remote stream: read tcp4 127.0.0.1:5601->127.0.0.1:51696: read: connection reset by peer
I changed the Makefile of elasticsearch as said and did make , it pass without probleme ,
I did run Makefile of kibana again now I ama getting error :
curl: (7) Failed to connect to localhost port 5601: Connection refused
mounaBoo
on 11 Jul 2019
Both of the commands show that it Elasticsearch and Kibana returned a 200 response showing that they are working correctly!
E0711 12:23:38.398706 441 portforward.go:316] error copying from local connection to remote stream: read tcp4 127.0.0.1:5601->127.0.0.1:51696: read: connection reset by peer
Could be a sign that you might not have a stable connection between your local machine and your Kubernetes cluster. Or that their might be some network timeouts configured that is causing this message. In any case this is not something specific to these helm-charts.
Thank you for helping in testing out the new documentation. As you have shown that it is working I'm going to close this issue!
Crazybus
on 12 Jul 2019
yes it's working but I am still having problem getting my UI so the issue still remain.
mounaBoo
on 12 Jul 2019
I found this abouit the error :
We had this issue as well on our build servers, though it was not intermittent for this particular port-forward -> curl. Turned out to be an expired cert. Might be worth double-checking.
mounaBoo
on 12 Jul 2019
and now I have another issue :
HTTP/2 302
content-type: application/binary
mounaBoo
on 12 Jul 2019
yes it's working but I am still having problem getting my UI so the issue still remain.
If you can give me some more information about what problems you are having, and what commands you running I'm more than willing to help you. Just keep in mind that your output has shown that the issue is not with this helm-chart itself anymore.
Crazybus
on 17 Jul 2019
yes it's working but I am still having problem getting my UI so the issue still remain.
If you can give me some more information about what problems you are having, and what commands you running I'm more than willing to help you. Just keep in mind that your output has shown that the issue is not with this helm-chart itself anymore.
THnk you very much sir I would be happy with your help since I didn't found any solution to my problem, I know that the branch is working perfectly but I really don't know how to fix my UI problem
mounaBoo
on 17 Jul 2019
@Crazybus these are the details of my issue :
when I do local test for elasticsearch :
{
"cluster_name" : "security",
"status" : "green",
"timed_out" : false,
"number_of_nodes" : 3,
"number_of_data_nodes" : 3,
"active_primary_shards" : 3,
"active_shards" : 6,
"relocating_shards" : 0,
"initializing_shards" : 0,
"unassigned_shards" : 0,
"delayed_unassigned_shards" : 0,
"number_of_pending_tasks" : 0,
"number_of_in_flight_fetch" : 0,
"task_max_waiting_in_queue_millis" : 0,
"active_shards_percent_as_number" : 100.0
}
for kibana curl -I -k -u elastic:$Password https://localhost:5601/app/kibana

HTTP/1.1 200 OK
content-security-policy: script-src 'unsafe-eval' 'nonce-hVJdRFhEJHdFV5kW'; worker-src blob:; child-src blob:
kbn-name: kibana
kbn-xpack-sig: 0ebe654e32c040bd4b2aff05c3931890
cache-control: no-cache
content-type: text/html; charset=utf-8
content-length: 81348
vary: accept-encoding
connection: close
Date: Thu, 11 Jul 2019 11:23:38 GMT
but when I forward the deployment to get the UI I get this error:
**Error:

Could not connect to Cloud Shell on port 8080.

Ensure your server is listening on port 8080 and try again.**
Also when I curl the forwarded link it shows me HTTP/2 302 error.
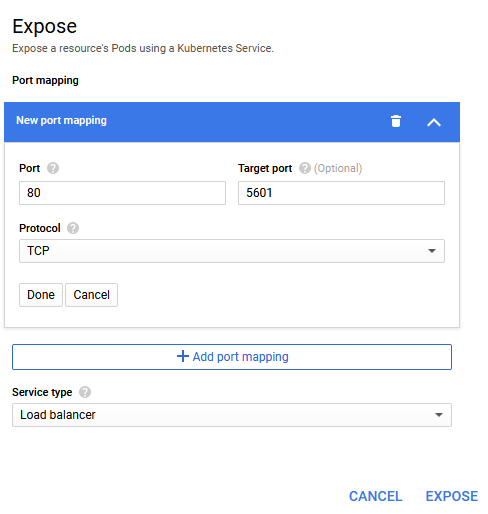
I used 2 methods one using the UI of google cloud platform to expose the service UI used to expose the service, and the other is using the port forwarding using the shell :
&& echo "# When the next line says 'Forwarding from...', go to: https://ssh.cloud.google.com/devshell/proxy?port=8080" && kubectl port-forward $(kubectl get pod --selector="app=kibana,release=
helm-kibana-security" --output jsonpath='{.items[0].metadata.name}') 8080:5601--project test-dev \
Fetching cluster endpoint and auth data.orwarding from...', go to: https://ssh.cloud.google.com/devshell/proxy?port=8080" && kubectl port-forward $(kubectl getpod --selector="app=kibana,release=h
kubeconfig entry generated for test-backend.
# When the next line says 'Forwarding from...', go to: https://ssh.cloud.google.com/devshell/proxy?port=8080
Forwarding from 127.0.0.1:8080 -> 5601
this is the UI interface of google cloud I use to expose the service :
mounaBoo
on 17 Jul 2019
When I try login form firefox this is the error I am getting :
The connection was reset

The connection to the server was reset while the page was loading.

    The site could be temporarily unavailable or too busy. Try again in a few moments.
    If you are unable to load any pages, check your computer’s network connection.
    If your computer or network is protected by a firewall or proxy, make sure that Firefox is permitted to access the Web.
Error:
Could not connect to Cloud Shell on port 8080.
Ensure your server is listening on port 8080 and try again.
Ahh it seems you are using google cloud shell? Port forwarding is not going to work for that since the "localhost" is not the same machine that your browser is running.
When I try login form firefox this is the error I am getting :
What address are you going to when you see that message? If you have set the service to loadbalancer then you should be going to https://public-ip-address:80 for it to work with the configuration you showed me in the screenshot. Using port 443 is going to make more sense here since it is the default port for https.
Also, overriding it in the UI like that is just going to be overridden. It would be much better to configure the service via the helm chart values like this:
service:
  type: LoadBalancer
  port: 443
After deploying it with the LoadBalancer service you can get the public IP address by running:
$ kubectl get service helm-kibana-security-kibana
NAME                          TYPE           CLUSTER-IP      EXTERNAL-IP    PORT(S)         AGE
helm-kibana-security-kibana   LoadBalancer   10.31.247.189   34.67.119.71   443:30480/TCP   3m18s
In this case my public IP is 34.67.119.71 so I can access Kibana at https://34.67.119.71.
Crazybus
on 18 Jul 2019
@Crazybus ooh Thank you very much for your help you just made my day thank so so much , that worked for me as a charm.
I need to do more reading about security , thank you again.
mounaBoo
on 18 Jul 2019
Thank you for following up! I'm really happy that you got it working!
Crazybus
on 19 Jul 2019
Thank you again for your kind help.
I wish I could get to your level of knowledge.
mounaBoo
on 19 Jul 2019
Related issues
 demisx
·
6Comments
demisx
·
6Comments
 ppawel
·
4Comments
ppawel
·
4Comments
 krichter722
·
6Comments
krichter722
·
6Comments
 dperetti
·
4Comments
dperetti
·
4Comments
 naseemkullah
·
6Comments
naseemkullah
·
6Comments
Most helpful comment
Thank you for following up! I'm really happy that you got it working!