Sometimes it's nice to show the data frame in slides, especially when teaching what a data frame is. In those occasions I usually show the top <5 rows, then a row of ..., then the last row. It would be nice to have such a display functionality.
This is pretty hacky, but something along the lines of this:
library(tidyverse)

df <- mtcars %>%
  slice(1:5) %>%
  rbind(rep("...", ncol(.))) %>%
  rbind(slice(mtcars, nrow(mtcars)))

row.names(df)[6] <- "..."
row.names(df)[7] <- nrow(mtcars)

df
#>      mpg cyl disp  hp drat    wt  qsec  vs  am gear carb
#> 1     21   6  160 110  3.9  2.62 16.46   0   1    4    4
#> 2     21   6  160 110  3.9 2.875 17.02   0   1    4    4
#> 3   22.8   4  108  93 3.85  2.32 18.61   1   1    4    1
#> 4   21.4   6  258 110 3.08 3.215 19.44   1   0    3    1
#> 5   18.7   8  360 175 3.15  3.44 17.02   0   0    3    2
#> ...  ... ...  ... ...  ...   ...   ... ... ...  ...  ...
#> 32  21.4   4  121 109 4.11  2.78  18.6   1   1    4    2
Created on 2018-05-14 by the reprex package (v0.2.0).
 mine-cetinkaya-rundel
All 4 comments
@mine-cetinkaya-rundel Really sorry it took awhile to get to this. I've implemented something that seems like a good start for now. Though I'm very open to any changes that will make this easier for the user.
I have this implementation so far:
gt(mtcars, rownames_to_stub = TRUE, preview = TRUE)
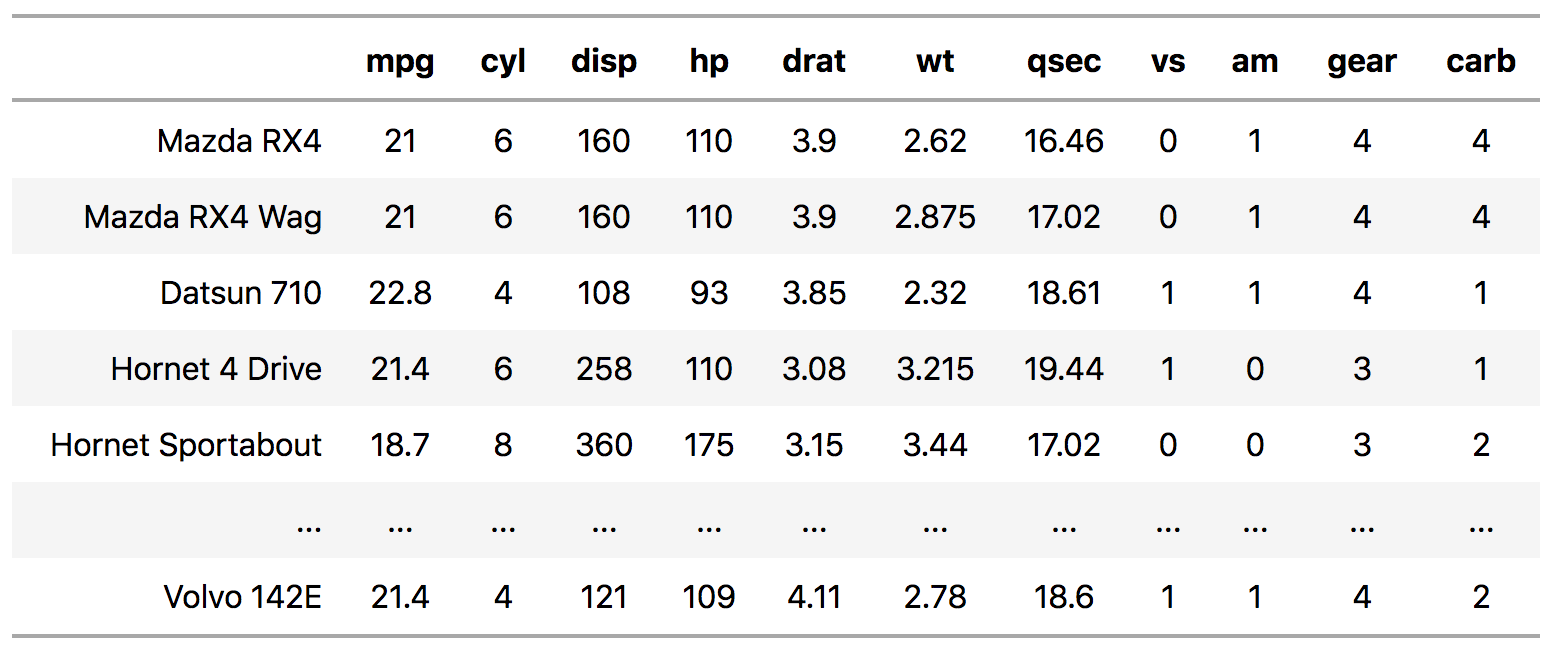
Also, the rownames_to_stub arg can be omitted to get the table without rownames:
gt(mtcars, rownames_to_stub = TRUE, preview = TRUE)
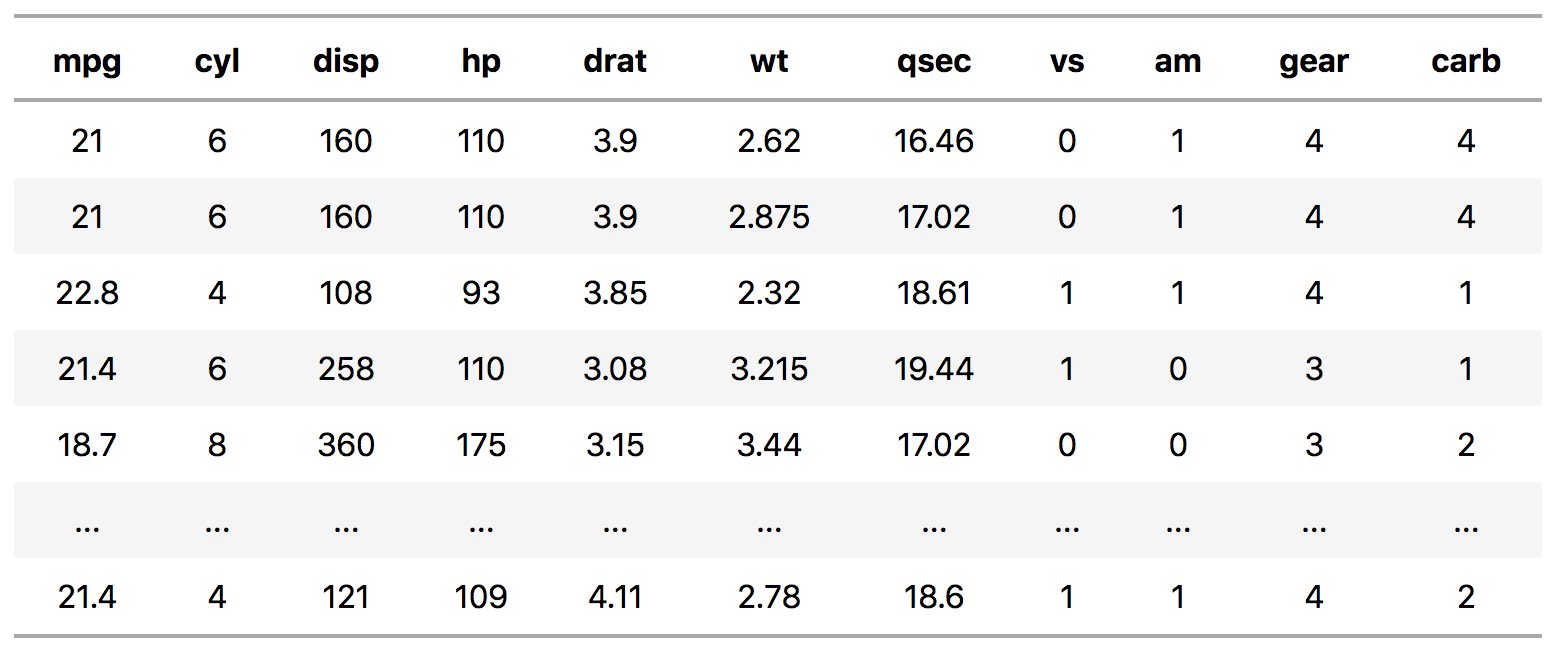
What do you think? We could also make an alias function (maybe gt_preview()) that wraps gt() for this purpose. There are really lots of options. Another idea is pre-populating the source note with information on how many rows were omitted.
 rich-iannone
on 8 Aug 2018
rich-iannone
on 8 Aug 2018
Looks great @rich-iannone!
I like the preview being an argument instead of having a wrapper function.
One comment: would be nice to have something like top_n and bottom_n arguments which could default to 5 and 1. Or it could be a single arguments like rows_to_show that takes a vector like c(1, 5). I like the former, seems more explicit to me.
mine-cetinkaya-rundel
on 9 Aug 2018
The the top_n and bottom_n arguments are perfect. I’ll get that in next!
rich-iannone
on 9 Aug 2018
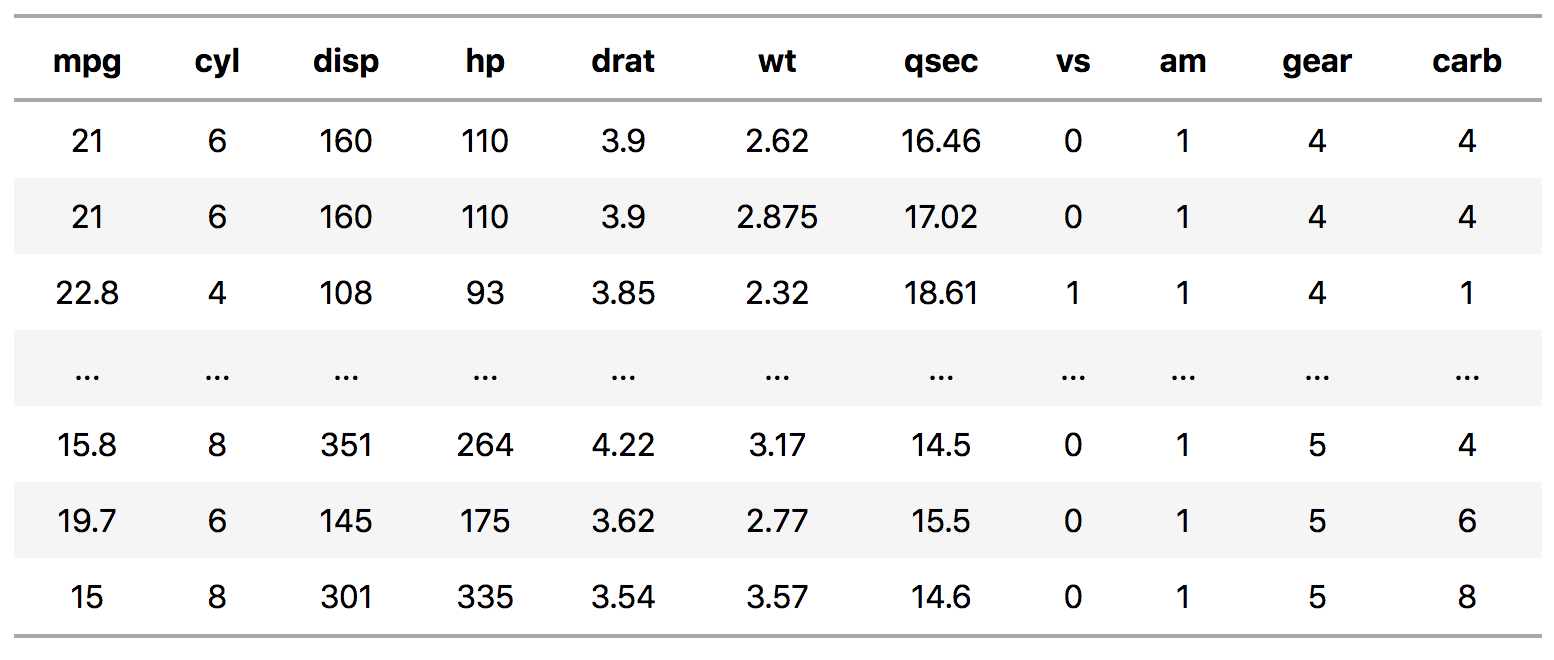
The arguments and logic are now in place and I kept the defaults as top_n = 5 and bottom_n = 1. Here is an example and screenshot of the mtcars preview table where both args are set to 3:
mtcars %>% gt(preview = TRUE, top_n = 3, bottom_n = 3)
Let me know if there is anything else to tweak. For now, closing the issue. Thanks for posting this one and the others!
rich-iannone
on 9 Aug 2018
Related issues
 jenniferp96
·
4Comments
jenniferp96
·
4Comments
 ddsjoberg
·
3Comments
ddsjoberg
·
3Comments
 r2evans
·
5Comments
r2evans
·
5Comments
 scotbader8858
·
4Comments
scotbader8858
·
4Comments
 courtiol
·
3Comments
courtiol
·
3Comments