Grafana-zabbix: Cannot access to datasource menu configuration after update of the grafana plugin
Describe the bug
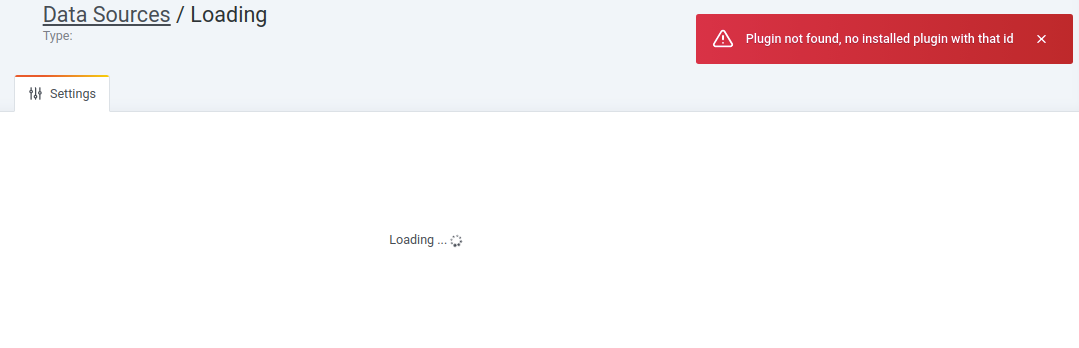
Cannot access to plugin configuration since upgrade to 4.0.1
No Problem with other datasources like Elasticsearch or Prometheus
Rollback to 3.12.2 release seems to fix this
Expected behavior
Access to configuration menu of the datasource
Screenshots
Network data
404 error when access to settings

Software versions
| Grafana | Zabbix | Grafana-Zabbix Plugin |
| ------- | ------ | --------------------- |
| 7.2.1 | 5.0.4 | 4.0.1 |
 samyscoub
All 6 comments
Same issue. The datasource was marked as missing, couldn't re-add it, downgrade fixed.
 garbled1
on 19 Oct 2020
garbled1
on 19 Oct 2020
Having the same issue
 pizzasuprema
on 20 Oct 2020
pizzasuprema
on 20 Oct 2020
Same issue.
 vordee
on 22 Oct 2020
vordee
on 22 Oct 2020
Same issue
 AAERob
on 22 Oct 2020
AAERob
on 22 Oct 2020
Same issue here. Downgraded to 3.12.4.
 mnlsvrs
on 23 Oct 2020
mnlsvrs
on 23 Oct 2020
Problem:
Plugin not found, no installed plugin with that id
Fix:
in /etc/grafana/grafana.ini , Iine 728 [;allow_loading_unsigned_plugins =] delete ; and type [alexanderzobnin-zabbix-datasource]
like this [allow_loading_unsigned_plugins = alexanderzobnin-zabbix-datasource]
and restart daemon, you can see zabbix in datasource
(c) ltoqurl499
 IgorOhrimenko
on 24 Oct 2020
IgorOhrimenko
on 24 Oct 2020
Related issues
 jameskirsop
·
8Comments
jameskirsop
·
8Comments
 mdiorio
·
5Comments
mdiorio
·
5Comments
 dataniard
·
6Comments
dataniard
·
6Comments
 maxlehot1234
·
5Comments
maxlehot1234
·
5Comments
 KevinInphos
·
4Comments
KevinInphos
·
4Comments
Most helpful comment
Problem:
Plugin not found, no installed plugin with that id
Fix:
in /etc/grafana/grafana.ini , Iine 728 [;allow_loading_unsigned_plugins =] delete ; and type [alexanderzobnin-zabbix-datasource]
like this [allow_loading_unsigned_plugins = alexanderzobnin-zabbix-datasource]
and restart daemon, you can see zabbix in datasource
(c) ltoqurl499